

Abstract
α-Synuclein, a presynaptic neuronal protein encoded by the SNCA gene, is strongly implicated in Parkinson disease (PD). PD pathogenesis is linked to increased SNCA levels; however, the transcriptional elements that control SNCA expression are still elusive. Previous experiments in PC12 cells demonstrated that the transcription factor zinc finger and SCAN domain containing 21 (ZSCAN21) plays an important regulatory role in SNCA transcription. Currently, we characterized the role of ZSCAN21 in SNCA transcription in primary neuronal cultures and in vivo. We found that ZSCAN21 is developmentally expressed in neurons in different rat brain regions. We confirmed its binding in the intron 1 region of SNCA in rat cortical cultures. Lentivirus-mediated silencing of ZSCAN21 increased significantly SNCA promoter activity, mRNA, and protein levels in such cultures. In contrast, ZSCAN21 silencing reduced SNCA in neurosphere cultures. Interestingly, ZSCAN21 overexpression in cortical neurons led to robust mRNA but negligible protein expression, suggesting that ZSCAN21 protein levels are tightly regulated post-transcriptionally and/or post-translationally in primary neurons. Efficient adeno-associated virus-mediated knockdown of ZSCAN21 in the postnatal and adult hippocampus, an area linked with non-motor PD symptoms, revealed no significant alterations in SNCA levels. Overall, our study demonstrates that ZSCAN21 is involved in the transcriptional regulation of SNCA in primary neuronal cultures, but the direction of the effect is variable, likely depending on neuronal maturation. However, the unaltered SNCA levels observed following ZSCAN21 down-regulation in the rat brain, possibly due to compensatory mechanisms, imply that ZSCAN21 is not a master regulator of SNCA in vivo.
Keywords: α-synuclein, neuron, Parkinson disease, rat, transcription regulation, zinc finger and SCAN domain containing 21 transcription factor
Introduction
Genetic alterations in SNCA are closely linked to familial and sporadic PD.2 Several lines of evidence have directly linked increased levels of wild type SNCA with dysfunctional and abnormal SNCA deposition and neurodegeneration in animal models and in humans, whereas polymorphisms within and around the SNCA gene locus are correlated to increased risk of PD (1). Importantly, large unbiased genome-wide association studies established single nucleotide polymorphisms in the SNCA region as one of the most common risk factors for sporadic PD (2–6). Collectively, these studies support the overarching idea that dysregulation of SNCA levels, leading to its excess accumulation and aggregation, is a major factor in PD pathogenesis. Nonetheless, to date not much is known about the regulation of SNCA levels in general, let alone its transcriptional regulation.
From previous studies it is well established that under physiological conditions SNCA mRNA levels are developmentally induced in the rat brain (7). The mechanisms involved in the developmental transcriptional regulation of SNCA remain elusive. Conversely, under pathological conditions in PD there has been controversy regarding the expression levels of SNCA mRNA in the brains of sporadic PD patients, with studies reporting both increased and decreased levels of SNCA (8–12). However, in an elegant study, in isolated surviving nigral neurons, increased SNCA mRNA levels were reported (13). Interestingly, in certain mouse models of neurodegenerative diseases, including an inducible SNCA model, reversal of expression of the “causative” proteins ameliorated neurodegeneration (14, 15). Therefore, if SNCA levels could be manipulated on demand, then certain aspects of the disease phenotype could be halted or even reversed.
Consistent with this notion, several studies have reported the presence of regulatory elements that could modulate SNCA transcription. To date, the best characterized polymorphic variant in the SNCA gene acting as a modulator of SNCA transcription in different cell lines and in vivo is the Rep-1 dinucleotide repeat region located ∼10 kb upstream from the transcription start site of the SNCA gene (16–19). Furthermore, regarding the 3′-SNCA region, single nucleotide polymorphisms as well as microRNAs have been shown to influence SNCA levels in different brain regions (19–21). Recent studies have also reported the presence of conserved non-coding areas around and within the SNCA gene that are associated with SNCA expression (22, 23).
In previous work in our laboratory, we have utilized primarily the rat pheochromocytoma PC12 cell line, and also primary neuronal cultures, to study the mechanisms involved in the transcriptional regulation of SNCA. We have found that SNCA is induced at the mRNA level in PC12 cells following growth factor application (24, 25) and rat cortical neurons upon maturation of the cultures (26, 27). We have also demonstrated that the growth factor-mediated up-regulation of SNCA in PC12 cells involves the extracellular signal-regulated kinase (ERK) and the phosphatidylinositol 3-kinase (PI3K) pathways along with transcriptional control elements localized within the regulatory intron 1 region of the SNCA gene locus (25). Of note, several studies have highlighted the regulatory role of intron 1 and TFs binding in this region in the transcriptional control of SNCA (28–34). Specifically, we demonstrated that the ZSCAN21 TF, whose consensus binding element is found at the very beginning of intron 1 of SNCA, was strongly involved in SNCA transcriptional activity in PC12 cells. ZSCAN21 (synonyms: Zipro 1, RU49, Zfp38, NY-REN1, and CTfin51) is a DNA-binding TF that belongs to the Krüppel C2H2-type zinc finger protein family. In general, zinc finger TFs can exert either positive or negative regulation on gene expression (35). Regarding its role in the CNS, it has been shown to participate in the proliferation of granule cell precursors during post-natal development (36–38). In particular, regarding SNCA, a recent study has shown that overexpression of ZSCAN21 can both repress SNCA and increase SNCB expression in the SHSY5Y cell line. Moreover, another study (39) reported that ZSCAN21 binds directly to the intron 1 region of SNCA in human brain tissue. Therefore, given the important role of ZSCAN21 in the transcriptional regulation of SNCA in neuron-like cells, we aimed to investigate its role in the transcriptional regulation of SNCA in primary neuronal cultures and, most importantly, in vivo.
Experimental Procedures
Rat Cortical and Hippocampal Neuron Cultures
Cultures of Wistar rat (embryonic day 17 (E17)) cortical or hippocampal neurons were prepared as described previously (40, 41). Dissociated cells were plated onto poly-d-lysine-coated 12-well dishes at a density of ∼5.5 × 10⁵ cells/well. The cells were maintained in Neurobasal medium (Gibco, Invitrogen), with B27 serum-free supplements (Gibco; Invitrogen), l-glutamine (0.5 mm), and penicillin/streptomycin (1%). The time in culture of cells was calculated using days in vitro (DIV).
Rat Neurosphere Cultures
Neurosphere cultures from E16 rat cortical and hippocampal tissue were prepared as described previously (42). Dissociated cells were plated onto poly-d-lysine-coated 12-well dishes at a density of ∼3.5 × 10⁵ cells/well. The cells were maintained in suspension in full medium +growth factors as follows: 1:1 mixture of Dulbecco's modified Eagle's medium (1 g/liter d-glucose, l-glutamine, pyruvate; Sigma), F-12 nutrient mixture (Sigma) plus 20 ng/ml human epidermal growth factor (EGF; R&D Systems) and 20 ng/ml human basic fibroblast growth factor (R&D Systems), 20 μg/ml insulin (Sigma), 1× B27 supplement (Gibco), 0.25 mm l-glutamine, and 1% penicillin/streptomycin to promote the production of the neurospheres. The neurospheres were passaged 2–3 times before plating in poly-d-lysine-coated plates in the presence of full medium. Differentiated neurosphere cultures were maintained in −growth factors, the same as the full medium +growth factors without human EGF and basic FGF to promote differentiation.
Western Immunoblotting
Primary neuron cultures were washed twice in phosphate-buffered saline (PBS) and then harvested in RIPA lysis buffer (150 mm NaCl, 50 mm Tris, pH 8.0, 0.1% SDS, 1% Nonidet P-40; Sigma, 2 mm EDTA). Brain tissues were homogenized again in RIPA lysis buffer, and clear lysate was isolated following centrifugation at 50,000 × g in 4 °C. Protein concentrations were determined using the Bradford method (Bio-Rad). A variable amount of protein in the lysates was mixed with 4× Laemmli buffer prior to running on 12% SDS-polyacrylamide gels. Following transfer to a nitrocellulose membrane, the blots were probed with antibodies directed against the following: SNCA (1:1000; BD Biosciences); ZSCAN21 (GenScript); ERK (loading control; 1:5000; Santa Cruz Biotechnology); β-actin (1:5000; Sigma); and GAPDH (1:1000; Santa Cruz Biotechnology). Blots were probed with horseradish peroxidase-conjugated secondary antibodies (mouse and rabbit), visualized with a LumiSensor HRP kit (GenScript), and exposed to Super RX film (Fuji Film). Following scanning of the images with Adobe Photoshop, Gel Analyzer software version 1 was used to quantify the intensity of the bands. In all cases, the levels of SNCA and ZSCAN21 were normalized to those of β-actin for quantification and statistical analysis.
Specificity of the Genscript ZSCAN21 Polyclonal Antibody
The specificity of the Genscript-made ZSCAN21 polyclonal antibody was verified following competition with the ZSCAN21-blocking peptide (SNLTKHRRTHTGEKPY, synthesized by Genscript Co.). The ZSCAN21 antibody was diluted in 10 μm Tris-HCl, pH 7.6, and incubated for 3 h at room temperature in the presence of 20-fold molar excess of the blocking peptide. The mixture purified ZSCAN21 antibody/ZSCAN21-blocking peptide was used at a 1:1000 dilution to detect ZSCAN21 following Western immunoblotting.
Immunocytochemistry
Neurosphere cultures grown on 24-well plates with coverslips were fixed with 3.7% formaldehyde for 25 min at 4 °C. Blocking was with 10% normal goat serum and 0.4% Triton X-100 for 1 h at room temperature. Primary antibodies, including SNCA (1:600; BD Biosciences), ZSCAN21 (1:400; Santa Cruz Biotechnology, ZNF-38 (H-68), sc-98315), and TUJ1 (1:2000; Sigma), were applied overnight at 4 °C, followed by fluorescent secondary antibodies as follows: 1:250, rabbit Cy2; 1:250, mouse Cy3; 1:250, mouse Cy2 (Jackson ImmunoResearch) for 1 h at room temperature. Cultures were visualized under an upright microscope, and representative images were recorded.
Immunohistochemistry
Wistar rats were perfused intracardially through the ascending aorta with physiological saline under pentobarbital anesthesia, followed by ice-cold 4% paraformaldehyde. The brains were removed and post-fixed overnight in the same preparation of paraformaldehyde, then transferred to 15% sucrose overnight, and then to 30% sucrose overnight. The brains were frozen with isopentane under dry ice. The brains were cryosectioned through the coronal plane in 20mm increments, and every section throughout the hippocampus was collected.
Fluorescent immunohistochemistry (IF) assay was carried out on embedded sections on slides. The sections were first washed with PBS, followed by antigen retrieval with 10 mm citrate buffer, blocking in 2% normal goat serum, and 0.1% Triton X-100 and incubation for 48 h at 4 °C with the primary antibodies SNCA (1:600; BD Biosciences), ZSCAN21 (1:400; Santa Cruz Biotechnology), and NeuN (1:300; Millipore). Next, the sections were incubated with the secondary antibodies rabbit Cy3 (1:250), mouse Cy3 (1:250), and mouse Cy2 (1:250) (Jackson ImmunoResearch) for 1 h incubation at room temperature. Sections were visualized under a confocal upright microscope, and representative images were recorded.
Cell Sorting of Rat Neurons
AAV-transduced rat brains were extracted under ice and washed with PBS to remove remaining blood. GFP-positive areas of the brains (identified under a stereoscope) were isolated and minced with razorblades. For dissociation and debris removal of rat adult brain tissue prior to FACS analysis, we followed the protocol of Guez-Barber et al. (43).
Next, the pellet was resuspended in the cell sorting buffer (2% FBS, 2 mm EDTA in PBS/filtered through a 0.2-μm filter) for labeling with the following primary antibodies: cell surface markers phycoerythrin mouse anti-rat CD24 (clone HIS50; BD Biosciences, 562104) and Alexa Fluor 467 anti-rat C90.1 (Thy-1.1) (Biolegends, 202507). These antibodies have been reported to label neuronal cells (44, 45). Then the cells were centrifuged at 1400 rpm for 10 min at 4 °C, washed once in cell sorting buffer, and incubated with the dye DAPI (0.5–1 μg/ml) for 5 min. Cells were then centrifuged at 1400 rpm for 10 min at 4 °C, resuspended in cell sorting buffer, and passed through a 50-μm pre-wetted filter to the specified sorting tubes for FACS analysis. To sort GFP-positive and immunolabeled neurons, a FACS Aria IIu cell sorter was used (BD Biosciences). Doublet exclusion and non-transduced tissue were used to design a gating strategy for optimal recovery of positively immunolabeled and GFP+ neurons. GFP+, CD24+, and CD90 + neurons were sorted in RNase-free tubes at 4 °C for RNA isolation. Cells that were GFP−, but CD24 and CD90+, were also sorted and used as the internal control in our study. Post-sort purity was always between 95 and 98%.
RNA Extraction and cDNA Synthesis
Total RNA was extracted from different brain regions, primary neuronal cultures, and neurosphere cultures using TRIzol (Invitrogen). DNase (Promega, 1 unit/μg) was added to remove any remaining DNA. RNA concentration was determined spectrophotometrically at 260 nm, although the quality of purification was determined by a 260:280-nm ratio that showed values between 1.7 and 2.0, indicating high RNA quality. cDNA was generated with the Moloney murine leukemia virus reverse transcription system (Promega). For the reaction we used 1–2 μg of total RNA, 1× buffer, 500 ng of oligo(dT) primer, 2 mm dNTPs, 40 units of RNasin, and 200 units of Moloney murine leukemia virus enzyme. Regarding the FACS assay, total RNA was extracted using an RNeasy kit (Qiagen) according to the manufacturer's instructions, and cDNA was synthesized using the Superscript II reverse transcription system (Invitrogen, 18064). For the reaction, we used 80 ng of RNA, 1× buffer, 500 ng of oligo(dT) primer, 0.5 mm dNTPs, 0.01 m DDT, 40 units of RNasin, and 200 units of Superscript II enzyme.
Reverse Transcription-PCR
Semi-quantitative reverse transcription-PCR was performed using cDNA as a template from different brain areas. For the PCR, we used the Thermopol Taq polymerase system (New England Biolabs, M0267). For the reaction, we used 1× buffer, 0.5 mm dNTPs, 0.5 μm primers, 1.25 units of enzyme, 0.08 μg of cDNA template. The primers used to perform the PCR were as follows: ZSCAN21-F′, 5′-CAGAAGCAGTCTTGGGAGAAA-3′, and ZSCAN21-R′, 5′-TCTCCCTTTCCAGGTTGTTG-3′; SNCA-F′, 5′-CTGCCACTGGTTTTGTCAAG-3′, and SNCA-R′, 5′-TGTACGCCATGGAAGAACAC-3′; and β-actin-F′, 5′-TGGCTCCTAGCACCATGA-3′, and β-actin-R′, 5′-CCACCAATCCACACAGAG-3′.
The PCR conditions were as follows: 95 °C for 4 min; 94 °C for 30 s; 56 °C for 30 s; 72 °C for 30 s (30 cycles); and 72 °C for 5 min. Products were subsequently resolved on agarose gels stained with ethidium bromide.
Real Time PCR Assay
For most cases, we utilized a Platinum Taq kit (Invitrogen, 10966) along with homemade Cyber Green solution. Duplicates or triplicates of each sample were assayed by relative quantitative real time PCR using the Light Cycler 96 (Roche Applied Science) machine to determine the levels of expression of different mRNAs. As a reference gene for normalization, we used β-actin. The primers used for each target were as follows: SNCA RT-F′, 5′-GCCTTTCACCCCTCTTGCAT-3′, and SNCA RT-R′, 5′-TATCTTTGCTCCACACGGCT-3′; ZSCAN21 RT-F′, 5′-CGGTTGTGCTATGGTTCAGC-3′, and ZSCAN21 RT-R′, 5′-ACACTCCAAACCTGGGACTC-3′; and β-actin RT-F′, 5′-TGGCTCCTAGCACCATGA-3′, and β-actin RT-R′, 5′-CCACCAATCCACACAGAG-3′.
Each cDNA sample, derived from 1 to 1.5 μg of total RNA from primary neuronal and neurosphere cultures, was diluted 1:20 before use for the amplification assay. The PCR conditions were as follows: 1× buffer (−Mg), 1.5 mm MgCl2, 0.2 mm dNTPs, 0.2 μm primers, template <500 ng, 2 units of Platinum Taq, and Cyber Green (homemade). The PCR conditions were as follows: 95 °C for 180 s, 95 °C for 10 s, 60 °C for 15 s, and 72 °C for 15 s (45 cycles), and 95 °C for 60 s, 65 °C for 60 s, 95 °C for 10 s, and 37 °C for 30 s.
As a negative control for the specificity of amplification, we used no template samples in each plate. No amplification product was detected in the control reactions. Data were analyzed automatically with a threshold set in the linear range of amplification. The cycle number at which any particular sample crossed that threshold (Ct) was then used to determine fold difference, whereas the geometric mean of the control gene (β-actin) served as a reference for normalization. Fold difference was calculated as 2−ΔΔCt (46).
Regarding the cell sorting and chromatin immunoprecipitation assay (ChIP), we used the Bio-Rad kit instead of the homemade Cyber Green as it is more sensitive for low concentration starting material. The PCR conditions were as follows: 95 °C for 30 s, 55 °C for 50 s (repeat 45 cycles), and 55 °C for 10 min, 95 °C for 10 s, 55 °C for 60 s, and 98 °C for 1 s.
Transfection and Luciferase Assay
All 5′-promoter constructs of SNCA utilized in this study are inserted in the pGL3-empty vector (Promega). The 1.9-kb and intron 1 constructs used were generated as described previously (25, 47). The constructs lacking the first putative ZSCAN21-binding site (1.9d), the second putative ZSCAN21-binding site (1.9dsec), as well as both (1.9dd) were constructed using the 1.9-kb construct as a template via site-directed mutagenesis with a QuikChange Lightning site-directed mutagenesis kit (Promega, 210518). All transfections were performed using Lipofectamine 2000 (Invitrogen) according to the manufacturer's instructions and as described previously (25). Briefly, for the luciferase assay all transfections were performed in 12-well tissue culture dishes with 5.5 × 10⁵ cells/well with 1.6 μg per well of target vector and 1:50 (of the target vector) of TK-Renilla (internal control) (Promega). 4 μl of Lipofectamine per well were determined to give the best transfection efficiency in primary neurons. All transfections were performed for 4 h in plain Neurobasal medium for cortical cultures and plain neurosphere buffer for differentiated neurosphere cultures. Next, complete medium was added. In all luciferase assays, the cells were harvested at 48 h after the addition of complete medium to the cells. Luciferase activity was detected with the Dual-Luciferase assay (Promega) according to the manufacturer's instructions.
ChIP
ChIP experiments were performed according to Kaltezioti et al. (42, 48). 100 μg of chromatin, extracted from rat cortical cultures, were used per immunoprecipitation reaction with 10 μg of antibody. Chromatin-antibody immunocomplexes were formed using antibodies to ZSCAN21 (Genscript) or c-Myb (Santa Cruz Biotechnology, sc-7874). Antibody-bound chromatin was retained on protein G-magnetic beads (Invitrogen). DNA was extracted from the immobilized bound immunocomplexes, reversed, ethanol-precipitated, and analyzed by semi-quantitative PCR. The following primer pairs were used to amplify part of intron 1 (containing the ZSCAN21-binding sites) or part of exon 4/intron 4 (distant area/negative ctl) genomic loci from rat SNCA gene, as indicated in Fig. 5A: ChIP ZSCAN F′, 5′-GAAGCCTAGAGAGCCGGTAAG-3′, and ChIP ZSCAN R′, 5′-CCGAGTGATGTACTTTCCAGTCA-3′; ChIP 3′SNCA F′, 5′-AGATGGGCAAGGTATGGCTG-3′, and ChIP 3′SNCA R′, 5′-CCCAAGGAAAACAGTGCATCG-3′. As an additional negative control, we used primers to amplify a genomic region outside the SNCA gene loci, the OLIG2 gene as follows: ChIP OLIG2 F′, 5′-AGCCTAGGGGGATTACAGGG-3′, and ChIP OLIG2 R′, and 5′-ACCAGGTTCTGGAGCGAATG-3′.
FIGURE 5.

ZSCAN21 binds in the intron 1 regulatory region. A, schematic of the rat SNCA gene; exons are depicted as boxes and introns as lines. The specific location in the rat SNCA gene of the amplified area containing the two ZSCAN21 putative binding sites (ZSCAN21) as well as the amplified nonspecific area (3′-SNCA) that were used for the ChIP assay is presented. B, quantification of ChIP results from real time PCR (three independent experiments). We observed a 15-fold increase for ZSCAN21 compared with the IgG irrelevant antibody. For 3′-SNCA and OLIG2 negative control regions, we detected a small increase in signal.
ZSCAN21 Deletion Constructs
ZSCAN21-binding site deletion constructs were constructed via site-directed mutagenesis with a QuikChange Lightning site-directed mutagenesis kit (Agilent). The deletion constructs were 1.9d ZSCAN21, which lacks the first ZSCAN21-binding site, 1.9dd ZSCAN21, which lacks both binding sites, and 1.9dsec ZSCAN21, which lacks the second ZSCAN21-binding site. The primers were designed using the QuikChange primer design program (available on line), as follows: 1.9d ZSCAN21 sense, 5′-AGCAGAGGGACTCAGGTTGTGGATCTAAACGG-3′, and 1.9d ZSCAN21 antisense, 5′-CCGTTTAGATCCACAACCTGAGTCCCTCTGCT-3′; 1.9dsec ZSCAN21 sense, 5′-GTCTCTGGGAGGTGGTCCCTTTGGGGAG-3′, and 1.9dsec ZSCAN21 antisense, 5′-CTCCCCAAAGGGACCACCTCCCAGAGAC-3′.
The reaction conditions were as follows 1× buffer; 50 ng of dsDNA; 1.25 ng of sense and antisense primers; 1 μl of dNTPs (kit); 1.5 μl of Quick Solution; 1 μl of enzyme. The PCR conditions were as follows: 95 °C for 2 min; 95 °C for 20 s; 60 °C for 10 s; 68 °C for 4 min (30 s/kb of plasmid length) (17 cycles); and 68 °C for 5 min.
Production of Lentiviruses
The small hairpin RNAs(shRNAs) against ZSCAN21 (two targets) and scrambled were cloned into the TRC2-pLKO.1 vector (Sigma) containing the U6 promoter, the selection marker puromycin, and the woodchuck hepatitis post-transcriptional regulatory element. The shRNAs were inserted in the AgeI/EcoRI multiple cloning site. The sense/antisense primers that were used for each shRNA were as follows: pLKO ZSCAN21/1 sense, 5′-CCGGGCCAGCCCTAAATATGAGTTTCTCGAGAAACTCATATTTAGGGCTGGCTTTTTG-3′, and pLKO ZSCAN21/1 antisense, 5′-AATTCAAAAAGCCAGCCCTAAATATGAGTTTCTCGAGAAACTCATATTTAGGGCTGGC-3′; pLKO ZSCAN21/2sense, 5′-CCGGGCTCCAACCTTACCCTTCATTCTCGAGAATGAAGGGTAAGGTTGGAGCTTTTTG-3′, and pLKO ZSCAN21/2 antisense, 5′-AATTCAAAAAGCTCCAACCTTACCCTTCATTCTCGAGAATGAAGGGTAAGGTTGGAGC-3′; pLKO scrambled sense, 5′-CCGGCAACAAGATGAAGAGCACCAACTCGAGTTGGTGCTCTTCATCTTGTTGTTTTTG-3′, and pLKO scrambled antisense, 5′-AATTCAAAAACAACAAGATGAAGAGCACCAACTCGAGTTGGTGCTCTTCATCTTGTTG-3′.
Additionally, we cloned the EGFP sequence from another vector using PCR with the specific primers before the puromycin sequence in the TRC2-pLKO-puro vector by digesting the vector and the EGFP PCR product with BamHI enzyme and then ligating both pieces. The primers that were used were as follows: BamHI-EGFP-F′, 5′-GAGAGGATCCCGCCACCATGGTGAGCAAGGGC-3′, and BamHI-EGFP-R′, 5′-GAGAGGATCCTCACTTGTACAGCTCGTCCATGCCGAGA-3′.
Subsequently, for the production of the viral particles, HEK293 cells (10, 150-mm dishes for each lentivirus) grown to ∼70–80% confluence were transfected using the calcium-phosphate method with the TRC2-pLKO-shRNA vector, the pCMV δ R8.2 plasmid (encoding the HIV-1 GAG/POL, Tat, and Rev regulatory genes), and the pMD2.G plasmid (encoding the VSVG packaging gene). After 3 days of incubation, the supernatant was collected, centrifuged to discard cell debris, passed through a 0.45-μm filter, and centrifuged at 26,000 rpm in a Sorvall Discovery 100SE ultracentrifuge with a TH-641 rotator for 3 h at 4 °C. The pellet was then resuspended in filtered 1× Hanks' buffered saline solution in PBS with 0.5% BSA under mild vortexing for 30 min at 4 °C, centrifuged at 2000 rpm for 30 s, aliquoted into sterile Axygen tubes, and kept at −80 °C. The titration of the viral preparation was performed in HeLa cells following serial dilutions of each lentivirus by FACS analysis of the GFP signal. The titer was then calculated by the equation: % GFP-positive cells × dilution of virus × number of cells infected/100. In general the titer of the lentiviruses was ∼1–2 × 10⁸ transduction units/ml.
Production of Recombinant AAVs
The shRNAs of interest (ZSCAN21/2 and scrambled) were cloned into an rAAV backbone plasmid containing the synapsin-1 promoter, woodchuck hepatitis post-transcriptional regulatory element, and bovine growth hormone poly(A) site. The expression cassette is flanked by AAV2 inverted terminal repeats. The shRNAs were inserted in the HpaI/XhoI multiple cloning site. The sense/antisense primers that were used for each shRNA were as follows: pLL3.7 ZSCAN21/2 sense, 5′-TGCTCCAACCTTACCCTTCATTTTCAAGAGAAATGAAGGGTAAGGTTGGAGCTTTTTTC-3′, and pLL3.7 ZSCAN21/2 antisense, 5′-TCGAGAAAAAAGCTCCAACCTTACCCTTCATTTCTCTTGAAAATGAAGGGTAAGGTTGGAGCA-3′; pLL3.7 scrambledsense, 5′-TGCTGATTCCGCCTAAAGATTCAAGAGATCTTTAGGCGGAATCAGCTTTTTTC-3′, and pLL3.7 scrambled antisense, 5′-TCGAGAAAAAAGCTGATTCCGCCTAAAGATCTCTTGAATCTTTAGGCGGAATCAGCA-3′.
Subsequently, the production of viral particles was performed as described previously (49–51). The titer for AAV/shZSCAN21/2 was 3 × 10¹⁴ and 1.8 × 10¹⁴ transduction units/ml for AAV/shscrambled.
Production of Recombinant AVs
The rat ZSCAN21 overexpression AV vector was generated using the following steps. We first performed PCR from cDNA of rat cortical cultures with specific primers to isolate the coding sequence of ZSCAN21 as follows: OVERZSCAN21-F′, 5′-CTGTGGATGCCAGCCCTAAA-3′, and OVERZSCAN21-R′, 5′-CGCTTTCTTGGGTCCTGAGT-3′.
Next, the rat ZSCAN21 sequence was cloned first into a modified version of the PENTR.GD entry vector and then introduced into the pAd/PL-DEST Gateway vector (Invitrogen). Second generation E1-, E3-, and E2a-deleted recombinant human serotype 5 adenoviruses (rAd) were generated, as described previously (52, 53). The titer was expressed as viral particles/ml, and it was calculated as 1.97 × 10¹¹ viral particles/ml for rAd-ZSCAN21. As a negative control, we used rAd-GFP with a titer of 1.55 × 10¹¹ viral particles/ml, which had already been made in our laboratory.
Animals
Post-natal P3 or 2-month-old adult Wistar rats (180–200 g) were housed in a cage (2–3 animals per cage for adults) with free access to food and water under a 12-h light/dark cycle. All experimental procedures performed were approved by the Institutional Animal Care and Use Committee of the Biomedical Research Foundation of the Academy of Athens.
Stereotaxic Surgical Procedure
For adult rats, all surgical procedures were performed under general anesthesia using isoflurane. After placing the animal into a stereotaxic frame (Kopf Instruments), 4 μl of recombinant AAV solution was injected unilaterally into the dentate gyrus (DG) of the hippocampus at two different sites. The coordinates of the first injection site were −3.0 mm anteroposterior from the bregma, −1.5 mm mediolateral from the bregma, and −3.6 mm dorsoventral from the scalp, and the coordinates of the second injection site were −4.56 mm anteroposterior from the bregma, −2.6 mm mediolateral from the bregma, and −3.2 mm dorsoventral from the scalp, according to the rat stereotaxic atlas (71). The tooth bar was adjusted to 2.3 mm. Injection was performed using a pulled glass capillary (diameter of 60–80 mm) attached to a Hamilton syringe with a 22 s gauge needle. After delivery of the viral vector using an injection rate of 0.1 ml/15 s, the capillary was held in place for 5 min, retracted 0.1 mm, and after 1 min was slowly withdrawn from the brain.
For post-natal day 3 rats (P3 rats), we used a specific stereotaxic unit (model 900 small animal stereotaxic unit; Kopf Instruments). We first anesthetized the pups under ice and then placed them in the stereotaxic frame that was kept cold during the surgical procedure with dry ice and ethanol. We performed bilateral stereotaxic injections in the ventricles (2 μl/ventricle, titer, 7.0 × 10¹³ transduction units/ml). We targeted the ventricles by calculating approximately two-fifths of the distance between the λ and each eye (54).
Microscopic Imaging Data
We used the following microscopes: Leica DMIRE 2 inverted microscope, HCX PLFLUOTAR dry ×20 magnification (numerical aperture 0.40) objective lenses; LEICA DFC350FX camera, GFP fluorochrome and phase, LAS version 3.8 acquisition software; LEICA DMRA2 upright microscope, HC PL FLUOTAR, dry ×40 magnification (numerical aperture 0.75) objective lenses, GFP and Cy3 fluorochromes; LEICA DFC 500 camera, LAS version 3.8 acquisition software; TCS SP5 II-LEICA DM6000 CFS confocal upright microscope, HCX PL S-APO, dry ×5 (numerical aperture) and HC PL APO water ×63 objective lenses, GFP and Cy3 fluorochromes, LAS AF acquisition software version 2.6.0.7266. All images were processed subsequently with Photoshop software.
Statistical Analysis
Statistical analysis was performed using unpaired t test for single analyses. Where multiple testing was required, a one-way analysis of variance test was utilized, with a post hoc Tukey's HSD test. p values < 0.05 were considered significant. All statistical analyses were performed using GraphPad Prism 5 software.
Results
Expression of ZSCAN21 in the Central Nervous System (CNS)
We first checked whether ZSCAN21 is expressed in vivo in different brain areas, where SNCA is also known to be expressed (midbrain, striatum, olfactory bulb, hippocampus, cortex, and cerebellum) and that are linked to varying degrees with PD pathology. Thus, we isolated different rat brain areas (as aforementioned) from two developmental stages, i.e. embryonic (E17) and adult (∼2 months), to test for ZSCAN21 mRNA (Fig. 1A) and protein (Fig. 1B) expression, because limited information regarding ZSCAN21 was available. Regarding ZSCAN21 protein expression, we generated a polyclonal antibody against ZSCAN21 (GenScript), which on Western blot in limited exposures of the film led to the appearance of a single specific band at the expected molecular mass of 63 kDa. Upon longer exposure, two other specific bands with molecular masses of ∼100 and 140 kDa were also discerned, likely representing variants or modified forms of ZSAN21 (Fig. 1B). We detected the expression of ZSCAN21, both mRNA and protein, in all brain areas tested (Fig. 1, A and B). In agreement with previous studies, the expression of SNCA was also verified in these areas (10, 19, 55). Interestingly, ZSCAN21 was more robustly expressed at the embryonic stage compared with adult brain (with a more profound difference at the protein level).
FIGURE 1.
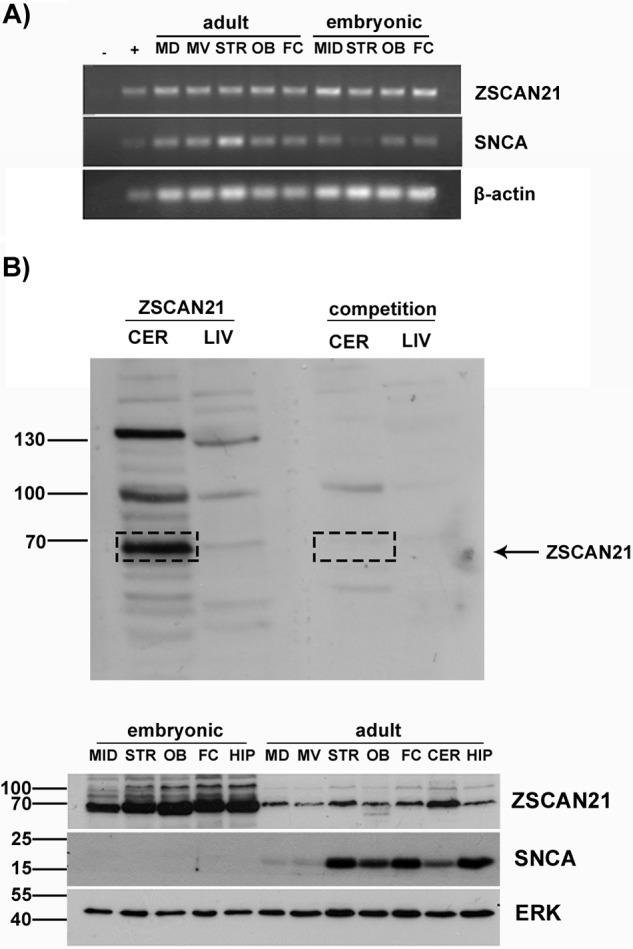
ZSCAN21 expression in different brain areas from embryonic and adult rats. Different brain areas were isolated from embryonic (E17) and adult rats. The brain areas isolated were: midbrain (MID) or midbrain dorsal (MD) and midbrain ventral (MV), striatum (STR), olfactory bulbs (OB), frontal cortex (FC), cerebellum (CER), and hippocampus (HIP). Following homogenization, RNA or protein isolation was performed. Α, RT-PCR for ZSCAN21 and SNCA. β-Actin, loading control; −, negative ctl/no sample; +, PC12 cell RNA extract. B, specificity of the Genscript ZSCAN21 polyclonal antibody. The specificity of the ZSCAN21 antibody was verified following competition with the ZSCAN21 blocking peptide (SNLTKHRRTHTGEKPY, synthesized by Genscript). As a positive control region for ZSCAN21 expression, we used a cerebellum lysate and as negative control a liver lysate. Western blot for ZSCAN21 and SNCA. ERK, loading ctl. Expression of ZSCAN21 (mRNA, protein) was detected in all tested brain areas, both embryonic and adult. Similarly, the expression of SNCA was also verified as expected.
Developmental Expression Profile of ZSCAN21 in the CNS
To establish a complete picture of the expression profile of ZSCAN21 during development and by extension of SNCA, we further analyzed additional developmental stages from the rat brain, including Ε17, P1, P3, P5, P7 or P8; P10, P12, or P13; P16 and adult (∼2 months). The brain region we mainly decided to focus our study was the hippocampus for the following reasons. First, ZSCAN21 is adequately expressed in this area. Second, hippocampus is an area mainly linked with the non-motor symptoms of PD, including primarily cognitive impairment and dementia that affect a high percentage of PD patients (56, 57). Additionally, hippocampal accumulation of SNCA has been reported to be involved in the pathogenesis of PD and other synucleinopathies (57), suggesting that the regulation of SNCA expression in this region may be of critical importance. Therefore, we performed RNA and protein extraction from different developmental stages of the hippocampus. We observed that ZSCAN21 expression both at the mRNA and protein level is developmentally down-regulated from P10 onward; however, its levels were still present in adulthood. There was no definite negative or positive correlation between ZSCAN21 protein levels and SNCA mRNA expression (Fig. 2A). It should be noted that we observed in adulthood, as reported previously (7), a discrepancy between the dropping levels of SNCA mRNA and the stabilized levels of its protein product, due to post-transcriptional regulation.
FIGURE 2.

ZSCAN21 developmental neuronal co-expression with SNCA in the hippocampus region of the rat brain. A, hippocampus was isolated from different developmental stages of the rat brain as follows: E17, P1, P3, P5, P7, or P8; P10, P12, or P13; P16 and adult (∼2 months). Next, the tissues were homogenized and assessed for ZSCAN21 and SNCA mRNA and protein expression levels with RT-PCR and Western blot analysis, respectively. β-Actin and ERK, loading ctls for mRNA and protein, respectively. B, co-expression of ZSCAN21 and the neuronal marker NeuN (merged picture). Representative images from the DG of the hippocampus (×63, scale bar 50 μm, confocal microscope) from P10 rat brain. C, co-expression of ZSCAN21 and SNCA (merged picture). Representative images from the DG of the hippocampus (×40 zoomed, scale bar 25 μm, confocal microscope) from P10 rat brain, where SNCA presents a cell soma cytoplasmic staining. This cell soma SNCA staining was not present upon pre-incubation of the antibody with recombinant protein or upon incubation with secondary antibody alone, and it was greatly reduced in later developmental stages, where essentially only neuropil staining was discerned.
We additionally performed IF in cryo-sections from rat brain of different developmental stages (P5, P10, P15, and adult) with a specific antibody against ZSCAN21 (Santa Cruz Biotechnology). This antibody gave a more specific staining on IF compared with the GenScript antibody and was used for all IF experiments presented here. Similarly, we verified the same pattern of expression for ZSCAN21 during development (data not shown).
Neuronal Co-expression of ZSCAN21 with SNCA
We next assessed whether ZSCAN21 is expressed in neurons. We performed an IF assay using cryo-sections from P10 rat brains where ZSCAN21 is expressed robustly, with specific antibodies against ZSCAN21 and the neuronal marker NeuN. We observed co-localization of ZSCAN21 and NeuN expression in nuclei in different brain areas, indicating that ZSCAN21, as expected for a TF, has a nuclear localization and is indeed expressed in neurons. Representative images are shown from the DG of the hippocampus (Fig. 2B).
In addition, we also verified co-expression of ZSCAN21 and SNCA in early developmental stages, until P15, where SNCA presents a cell soma staining pattern in contrast to a diffuse pattern of reactivity throughout the neuropil in the adult brain (58–60). In parallel, we used sections that were not incubated with a primary antibody as a negative control (data not shown). Representative images are shown from the DG of the hippocampus from P10 rat brain sections (Fig. 2C).
shRNA-mediated Knockdown of ZSCAN21 Up-regulates SNCA in Primary Neuronal Cultures
To evaluate the functional consequences of modulating ZSCAN21 expression on SNCA transcription, we constructed shRNA lentiviruses selectively silencing ZSCAN21. In particular, we designed two shRNAs against ZSCAN21 (shZSCAN21/1 and shZSCAN21/2) as well as scrambled shRNA (control virus). The above shRNAs were cloned in the TRC2-pLKO.1 lentivirus vector, which is widely used for down-regulating different proteins in primary cultures as well as in in vivo systems with high efficacy (61–65). In addition, we incorporated the EGFP reporter protein in the vector for monitoring the efficiency of transduction. As a first step toward evaluating potential alterations of SNCA expression due to ZSCAN21 down-regulation, we infected rat embryonic cortical cultures with the shZSCAN21-expressing lentiviruses. We were able to achieve high efficiency of infection in the rat cortical cultures for all lentiviruses (Fig. 3A). At 5 days post-infection, the cultures were harvested and processed either for RNA or protein isolation. The mRNA and protein levels of ZSCAN21 and SNCA were evaluated with real time PCR and Western blotting, respectively. Efficient down-regulation of ZSCAN21 at both the mRNA and protein level (for both ZSCAN21 targets) significantly increased SNCA at both mRNA and protein, a reverse expression pattern compared with PC12 cells (47). Similar results were also obtained from primary hippocampal cultures (Fig. 3, B and C). We should also mention that different time points were assessed for ZSCAN21 and SNCA expression levels from the ones shown. Shorter time points (<96 h) had no effect upon SNCA, and later time points (>5 days) demonstrated compromised cell integrity.
FIGURE 3.

SNCA is increased following down-regulation of ZSCAN21 in primary cortical neuronal cultures. Cortical or hippocampal cultures were prepared from embryonic day 17 (E17) rats. The neurons were infected at 4 DIV with shZSCAN21/2, shZSCAN21/1, or shscrambled (control) lentiviruses at an m.o.i. of 1. At 5 (for cortical) or 7 (for hippocampal) days post-infection, the cultures were assessed for ZSCAN21 and SNCA mRNA and protein expression with real time PCR and Western blot analysis, respectively. A, efficiency of transduction in rat cortical cultures (×20, scale bar 100 μm, inverted microscope). B, quantification of results from real time PCR normalized by β-actin. For shZSCAN21/2 and shZSCAN21/1, five independent experiments were performed in triplicate, and two independent experiments were performed in quadruplicate, respectively. Results are presented as means ± S.E. (n = 15, n = 8 respectively). Efficient down-regulation of ZSCAN21 expression for both shRNA targets led to a statistical significant increase of SNCA (p < 0.0001) in rat cortical cultures. For shZSCAN21/2, four independent experiments were performed in triplicate. Results are presented as means ± S.E. (n = 12). Efficient down-regulation of ZSCAN21 expression led to a statistically significant increase of SNCA expression (p < 0.0001) in rat hippocampal cultures. Statistical analysis was performed via an unpaired t test. C, Western blot analysis and quantification of results. For shZSCAN21/2 and shZSCAN21/1, four independent experiments were performed in triplicate, and one independent experiment was performed in quadruplicate, respectively. Results are presented as means ± S.E. (n = 12, n = 4, respectively). Efficient down-regulation of ZSCAN21 expression led to a statistically significant increase of SNCA expression (shZSCAN21/2, p < 0.01, and shZSCAN21/1, p < 0.05) in rat cortical cultures. For shZSCAN21/2, three independent experiments were performed in triplicate. Results are presented as means ± S.E. (n = 9). Efficient down-regulation of ZSCAN21 expression led to a statistically significant increase of SNCA expression (p < 0.01) in rat hippocampal cultures. β-Actin, loading control. Statistical analysis was performed via an unpaired t test. *, p < 0.05; **, p < 0.01; ***, p < 0.0001.
SNCA Promoter Activity Is Induced Following ZSCAN21 Silencing in Cortical Neuronal Cultures
Next, we tested whether the shZSCAN21-mediated induction of SNCA expression is accompanied by increased transcriptional activity of the SNCA promoter. To address this issue, we utilized the 1.9-kb SNCA promoter construct, which we verified to be highly induced in the luciferase assay (in contrast to intron 1) in rat cortical cultures (Fig. 4, A and B) (26). Therefore, we infected rat embryonic cortical cultures with either the shZSCAN21/2, shZSCAN21/1, or shscrambled lentiviruses. At 3 days post-infection, we transfected these cultures with the 1.9-kb and pGL3-empty (control vector) luciferase constructs, and we performed the luciferase assay 48 h later. Accordingly, we observed a significant induction in the luciferase assay following ZSCAN21 down-regulation with both shRNA targets compared with shscrambled for the 1.9-kb promoter (Fig. 4C), suggesting that this SNCA induction is likely promoter-driven by the 1.9-kb promoter region of SNCA. Of note, in the intron 1 region of SNCA, there are two predicted binding sites for ZSCAN21, conserved in human and rat (MatInspector), one at the very beginning of intron 1 and one ∼130 bases downstream (Fig. 4A). To examine whether ZSCAN21 directly mediates SNCA transcription, through binding in its consensus binding sites in the intron 1 region of SNCA, we designed constructs lacking the first putative ZSCAN21-binding site (1.9d), the second putative ZSCAN21-binding site (1.9dsec), as well as both binding sites (1.9dd) using the 1.9-kb construct (which, as mentioned is highly induced in the luciferase assay in cortical cultures) as a template, and we performed luciferase assays in primary cortical cultures. However, we did not detect a significant difference between the 1.9-kb construct and the 1.9-kb deletion constructs (Fig. 4D). This raises two possibilities as follows: either ZSCAN21 could bind to the 1.9-kb region even in the absence of its putative binding sites (indirectly as a co-factor) or ZSCAN21 binding to these sites does not affect the expression of the downstream region.
FIGURE 4.

Increased transcriptional activity of the SNCA promoter following ZSCAN21 down-regulation in rat cortical cultures. A, schematic of the 5′ genomic region of human SNCA. Exons are depicted as closed boxes and introns as lines. The canonical 5′ transcriptional start site is depicted with an angled arrow at the start of exon 1. ATG marks the translational start site at exon 2. The two ZSCAN21 putative binding sites are depicted as red filled stars in the intron 1 region. The 1.9-kb (core promoter and intron 1 regions) and intron 1 luciferase constructs are depicted as lines connected to a LUC-labeled box. B, relative luciferase activity of the 1.9-kb (p < 0.0001) and intron 1 (int1) luciferase constructs compared with pGL3-empty vector in naive cortical cultures. Quantification of results from four independent experiments performed in duplicate. Results are presented as means ± S.E. (n = 8). C, cortical neurons were infected at day 4 DIV culture with shZSCAN21/2, shZSCAN21/1, or shscrambled (control) lentiviruses at an m.o.i. of 1. At 3 days post-infection, the cultures were transfected with the 1.9-kb, intron 1 (Int1), and pGL3 basic-empty vector luciferase constructs. At 48 h post-transfection, the cells were lysed and assessed for the luciferase assay. For shZSCAN21/2 (Z2) and shZSCAN21/1 (Z1), five independent experiments were performed in duplicate, and one experiment was performed in triplicate, respectively. Results are presented as mean ± S.E. (n = 10 and n = 3, respectively). Statistical analysis was performed via an unpaired t test. Significant induction was observed in the luciferase assay following ZSCAN21 down-regulation compared with scrambled (fold induction set as 1 for each construct in the scrambled condition) for the 1.9-kb construct (Z2, p < 0.0001, and Z1, p < 0.01). D, cortical cultures were transfected at 7 DIV with the 1.9-kb construct, ZSCAN21 deletion constructs (1.9d, 1.9dd, and 1.9dsec), and pGL3 basic empty vector (control). At 48 h post-transfection, the cells were lysed and assessed for luciferase assay. Quantification of results from four independent experiments performed in duplicate and normalized according to the pGL3 empty vector. Results are presented as means ±S.E. (n = 8). Statistical analysis was performed via one-way analysis of variance and post hoc Tukey's test. We observed no statistically significant differences between the 1.9-kb and the ZSCAN21 deletion constructs. **, p < 0.01; ***, p < 0.0001.
Assessment of ZSCAN21 Mode of SNCA Transcriptional Regulation in Cortical Neuronal Cultures
To confirm whether ZSCAN21 is indeed recruited in the intron 1 region of the SNCA gene, we performed ChIP assays in rat cortical cultures. Specifically, we designed specific primers to include the region (∼150 bp) with both putative ZSCAN21-binding sites (Fig. 5A). For the immunoprecipitation, we used the ZSCAN21 GenScript antibody as well as a negative control (IgG control) irrelevant antibody of the same isotype (c-Myb). Additionally, we used primers amplifying either a distant region in the same gene (an area in the exon/intron 4 region of SNCA/3′-SNCA) or a region in another gene (in this case the OLIG2 gene) as negative controls. We found an increase of ∼15-fold in the case of the ZSCAN21 antibody compared with the irrelevant IgG control for the 150-bp designated region in the intron 1 region in the real time PCR assay. Regarding the negative control regions for 3′-SNCA and OLIG2, we observed an ∼4- and 2-fold signal, respectively (Fig. 5B). These data verify that ZSCAN21 is indeed recruited in the intron 1 regulatory region of SNCA in rat cortical neuronal cultures.
Overexpression of ZSCAN21 in Cortical Neuronal Cultures
We also assessed the effects of overexpression of ZSCAN21 on SNCA transcription in rat cortical cultures. For this purpose, we produced AVs expressing the rat ZSCAN21 coding sequence to overexpress ZSCAN21 in rat cortical neuronal cultures. AVs, similarly to lentiviruses, have the ability to transduce post-mitotic cells with high efficiency. However, we were unable to detect ZSCAN21 overexpression at the protein level. We detected only a slight ZSCAN21 overexpression at early time points (24 and 48 h) (Fig. 6B), even though we tested different multiplicities of infection (50–400). Notwithstanding, we could efficiently overexpress ZSCAN21 in HEK293T cells (data not shown). Conversely, at the mRNA level, we detected robust ZSCAN21 overexpression starting from an ∼15-fold difference compared with endogenous levels at the early time point of 24 h, then 10-fold at 48 h, 5-fold at 72 h, and finally 3.5-fold at 5 days (Fig. 6A). The gradual reduction seen in the overexpressed ZSCAN21 mRNA levels over time was expected, due to the episomal nature of the AV expression. Additionally we excluded the possibility that this mRNA overexpression detected with real time PCR could be attributed to ZSCAN21 AV DNA, as cDNA from overexpressed ZSCAN21 samples had an almost 32–64-fold difference compared with samples that were not reverse-transcribed (negative control/data not shown). As expected, because no ZSCAN21 protein overexpression was achieved, there was no change in SNCA mRNA levels (Fig. 6A).
FIGURE 6.

ZSCAN21 protein levels are under tight regulation in rat cortical neuronal cultures. Cortical neuron cultures were prepared from E17 rats. The neurons were infected 4 DIV with the AV/OVERZSCAN21 or AV/GFP (control) viruses at an m.o.i. of 100. The cultures were collected at different time points (24, 48, and 72 h and 5 days) and assessed for ZSCAN21 and SNCA mRNA and protein levels with real time PCR and Western blot analysis, respectively. A, quantification of results from real time PCR (two experiments) normalized by β-actin. Overexpression of ZSCAN21 mRNA was evident at all time points tested. SNCA mRNA levels remained unaltered. B, representative Western blots, one with all time points and one magnified on the 48-h time point where ZSCAN21 slight overexpression was more evident. This slight overexpression of ZSCAN21 was observed only at early time points (24 and 48 h), in which ZSCAN21 ran slightly higher on the blot compared with the endogenous protein. GAPDH was used as loading control.
Silencing of ZSCAN21 in Differentiated Neurosphere Cultures
We also examined the interplay between ZSCAN21 and SNCA in free-floating cultures of neural stem cells termed neurospheres (66). Neurospheres represent an early developmental model system, and because ZSCAN21 demonstrates the highest levels of expression very early in development, it seemed appropriate to examine its role in SNCA regulation in this system as well. In our study, we utilized only differentiated cultures, because SNCA was not detected in the proliferating cultures (data not shown). The percent of neurons in these cultures is ∼15–20%. We must mention that the maturation state of the differentiated cultures is completely different from that of primary cultures. These differentiated neurons derived from neurospheres are positive for β-III tubulin (TUJ1/early neuronal marker) and essentially negative for NeuN (mature neuronal marker). IF against ZSCAN21, SNCA, and TUJ1 verified the co-expression of ZSCAN21 and TUJ1, SNCA, and TUJ1 and ZSCAN21 and SNCA (Fig. 7A).
FIGURE 7.

Lentivirus-mediated silencing of ZSCAN21 led to decreased levels of SNCA in differentiated neurosphere cultures. A, co-expression of ZSCAN21 and SNCA in early neurons in differentiated neurospheres. Co-localization of TUJ1 with ZSCAN21, TUJ1 with SNCA, and ZSCAN21 with SNCA. Representative images (×40, scale bar 50 μm, confocal microscope). B, efficiency of transduction for shZSCAN21/2, shZSCAN21/1, and shscrambled lentiviruses (×20, scale bar 100 μm, inverted microscope) at 5 days post-infection. C, quantification of results from real time PCR normalized by β-actin. For shZSCAN21/2 and shZSCAN21/1, three independent experiments were performed in triplicate, and two independent experiments were performed in quadruplicate, respectively. Results are presented as means ± S.E. (n = 9 and n = 8). Statistical analysis was performed via an unpaired t test. Efficient down-regulation of ZSCAN21 expression for both shRNA targets led to a statistically significant decrease of SNCA expression (p < 0.001). D, representative Western blots. ZSCAN21 down-regulation (shZSCAN21/2 (Z2) and shZSCAN21/1 (Z1)) led to decreased SNCA levels. β-Actin, loading control. ***, p < 0.001.
We next infected these differentiated cultures with the shZSCAN21 lentiviruses (shZSCAN21/1 and shZSCAN21/2) and shscrambled (control) and assessed them for ZSCAN21 and SNCA expression levels at 5 days post-infection. We observed high infection efficiency for all lentiviruses (Fig. 7B). Significant silencing of ZSCAN21 with both lentiviruses surprisingly led to decreased levels of SNCA at both the mRNA and protein level (Fig. 7, C and D).
Evaluating the Role of ZSCAN21 upon SNCA Regulation in Different Developmental Stages in Vivo
For the in vivo experiments, we produced AAVs targeting ZSCAN21 expression. The reason we utilized AAVs over lentiviruses is due to their increased transduction efficacy in in vivo settings. Specifically, for the AAVs used in this study, shRNA expression was driven by a synapsin promoter that ensures the selective transduction of neurons. In addition, a GFP selection marker was also incorporated in the AAV vector sequence for the visualization of the signal. We studied the role of ZSCAN21 in SNCA regulation in vivo in two developmental stages due to the differential regulation of SNCA transcription following ZSCAN21 silencing in the neurosphere cultures (early developmental stage) and the rat primary neuronal cultures (representing a more mature stage). The shZSCAN21 target that was cloned in the AAV vector was shZSCAN21/2. We achieved high neuronal transduction efficiency in both developmental stages with AAV/shZSCAN21/2 and AAV/shscrambled. Regarding the early developmental stage, we performed stereotaxic delivery of both AAVs in the lateral ventricles of postnatal day 3 (P3) rat brains. We followed this approach as it is particularly difficult to target a specific brain area at such a young age. The AAVs, due to the small diameter of their viral particles (∼20-30 nm), have the ability to spread efficiently through the lateral ventricles and transduce proximal brain areas, including the hippocampus, which was of most interest in this study. The animals were sacrificed at 1 month post-infection, and the brain samples were processed either for IF or cell sorting for RNA analysis. IF of brain cryo-sections with the neuronal marker NeuN revealed sufficient neuronal transduction mainly in the areas surrounding the ventricles, such as the striatum, cortex, and hippocampus. In most cases, neuronal transduction was more evident in the hippocampus (Fig. 8A). In parallel, brain samples were processed for cell sorting to isolate the infected neurons for mRNA analysis of ZSCAN21 and SNCA expression for both AAVs. To achieve efficient cell sorting, we utilized the GFP reporter marker of the AAVs along with antibodies for neuronal cell surface markers. The non-transduced neuronal population served as an internal control for the endogenous cargo. We assessed these sorted samples for ZSCAN21 and SNCA mRNA expression (Fig. 8B). We achieved robust down-regulation of ZSCAN21 in the case of the AAV/shZSCAN21-treated animals versus AAV/shscrambled and ctl (non-transduced population) according to real time PCR analysis. Additionally, the animals that demonstrated the highest down-regulation were also highly enriched for the GFP signal, thus substantiating the effectiveness of the sorting assay utilized. Nevertheless, SNCA mRNA levels remained unchanged following ZSCAN21 down-regulation (Fig. 8C). Of note, from the total of 11 animals (5 AAV/shZSCAN21 and 6 AAV/shscrambled) that underwent sorting, only three were highly enriched for the GFP signal in the case of AAV/shZSCAN21 and three in the case of AAV/shscrambled viruses. This was due to variation in the transduction efficiency of both AAVs following stereotaxic injection in the ventricles (also evident in the IF assay) of P3 rats.
FIGURE 8.

AAV-mediated silencing of ZSCAN21 did not alter SNCA levels in the early postnatal rat brain. A, efficiency of neuronal transduction of the AAVs (AAV/shZSCAN21/2 and AAV/shscrambled) in 1-month-old rat brains. Co-localization of NeuN (red) and GFP (green) was observed in the merged picture. Representative images from the DG of the hippocampus (×63, scale bar 50 μm, confocal microscope). B, schematic of the protocol used to sort GFP+ neurons using FACS. Dissociation of tissue to a cell suspension, removal of debris by filtration and Percoll gradient centrifugation, immunolabeling of cells with cell surface neuronal markers (CD24 and CD90) are presented on the left. Representative gating strategy for selecting GFP+ is presented on the right. Numbers in the dashed boxes represent percentages of GFP+ neurons. C, quantification of results from real time PCR normalized by β-actin. Results are presented as means ± S.E. (n = 5 for control scrambled (CTL SCR), n = 4 for control ZSCAN21 (CTL ZSCAN21), n = 3 for AAV/shscrambled (SCR) and n = 3 for AAV/shZSCAN21 (ZSCAN21). Statistical analysis was performed via an unpaired t test. Efficient down-regulation of ZSCAN21 expression (p < 0.01) did not significantly affect SNCA levels. **, p < 0.01.
Regarding later developmental stages, we again performed stereotaxic injections utilizing the above AAVs targeting the DG of the hippocampus in 2-month-old rats, where we had observed significant co-localization of ZSCAN21 and SNCA (Fig. 2C). For this assay, we used a total of 12 adult rats (6 AAV/shZSCAN21 and 6 AAV/shscrambled). The injections were performed at two distinct sites of the DG of the hippocampus in the right hemisphere of the brain to transduce efficiently a more extended area. The animals were sacrificed at 2 months post-infection. IF of brain cryo-sections with the neuronal marker NeuN in one animal per group revealed widespread neuronal transduction of the DG of the hippocampus (Fig. 9A). The remaining five animals in each group were processed for ZSCAN21 and SNCA mRNA levels. We isolated the right infected area of the DG of the hippocampus through a stereoscope by visualizing the GFP signal. We also isolated the same area from the left hemisphere (non-injected) that represents the endogenous levels of expression for each animal. We then isolated total RNA and performed real time PCR. We observed significant ZSCAN21 down-regulation in the group of AAV/shZSCAN21 animals compared with AAV/shscrambled. Similarly to the early postnatal stage, we were not able to detect significant alterations in SNCA mRNA levels between the two groups (Fig. 9B).
FIGURE 9.

AAV-mediated silencing of ZSCAN21 did not alter SNCA levels in the DG of the hippocampus in adult rat. A, efficiency of neuronal transduction of the AAVs (AAV/shZSCAN21/2 and AAV/shscrambled) in 4-month-old rat brains. Co-localization of NeuN (red) and GFP (green) was observed in the merged picture. Representative images from the DG of the hippocampus (×5, scale bar 500 μm; ×63, scale bar 50 μm, confocal microscope). B, quantification of the results from real time PCR normalized by β-actin. Results are presented as means ± S.E. (n = 5 for AAV/shZSCAN21 and n = 4 for AAV/shscrambled). Statistical analysis was performed via an unpaired t test. Efficient down-regulation of ZSCAN21 expression (p < 0.01) did not significantly affect SNCA levels. **, p < 0.01.
Discussion
Although SNCA levels play a critical role in familial and sporadic PD, and potentially in other neurodegenerative conditions, the mechanisms that regulate SNCA transcription are not well understood.
By using the PC12 cell line, we have previously identified the ZSCAN21 TF as an important regulator of SNCA transcription (47). Therefore, in this study, we focused on ZSCAN21's potential involvement in SNCA transcription in primary neuronal cultures and most importantly in vivo, as a more physiologically relevant setting. Importantly, a study by Yang et al. (37) demonstrated no significant phenotypic or functional alterations in Zscan21−/− BAC transgenic mice; thus, if ZSCAN21 silencing could successfully reduce SNCA levels in vivo, as in PC12 cells, it would not only establish its important role in SNCA transcription but could also serve as a potential therapeutic target for PD.
Here, we show that efficient down-regulation of ZSCAN21 increases SNCA expression at both the mRNA and protein level in rat cortical neuronal cultures, the opposite expression pattern to that observed in differentiated PC12 cells. Similarly, SNCA levels were also increased in rat hippocampal cultures, thus further validating the specificity of the result. Importantly, ZSCAN21 silencing was also found to further increase the activity of the 1.9-kb SNCA promoter construct in the luciferase assay in rat cortical cultures, suggesting that this SNCA induction is likely promoter-driven by the 1.9-kb promoter region of SNCA. Therefore, ZSCAN21 silencing leads to increased SNCA promoter transcriptional activity that subsequently results in elevated SNCA mRNA and protein levels in rat primary neuronal cultures. Of note, previous experiments in our laboratory have showed that the 1.9-kb deletion construct (which includes the core promoter and the intron 1 of SNCA) demonstrated a reverse pattern of transcriptional activity in rat cortical cultures and PC12 cells (26). Therefore, this different SNCA promoter transcriptional activity may explain the discrepancy observed in SNCA levels following ZSCAN21 down-regulation in these cultures. A note should be made on the discrepancy between our results presented here and those achieved previously by our laboratory in preliminary experiments in cortical neuron cultures, where we had found that siRNA-mediated down-regulation of ZSCAN led to a reduction of SNCA levels (47). Those experiments were based solely on immunofluorescence of single transfected cells, and thus lack the rigorous quantitative analysis in the whole neuronal population, at the promoter, mRNA, and protein level, as we have performed here.
Furthermore, we verified ZSCAN21 binding in the regulatory intron 1 region of SNCA via ChIP assay. However, deletion of the putative binding sites of ZSCAN21 did not reveal any significant alterations in SNCA transcription in the luciferase assay, suggesting that ZSCAN21 in cortical neurons may not directly regulate SNCA transcription by binding to its predicted binding sites but rather indirectly as a co-factor. This again marks a contrast with the PC12 cell system, where deletion of the first ZSCAN21-binding site led to marked inhibition of the effects on SNCA transcriptional activity (47).
In addition, we also assessed the effect of ZSCAN21 overexpression on SNCA levels, because a recent study by Wright et al. (67) reported that overexpression of ZSCAN21 was able to significantly reduce SNCA levels in SHSY5Y cells. Interestingly, we found that even though we achieved robust ZSCAN21 mRNA overexpression, we could only detect a small amount of ZSCAN21 protein that was only evident at the early time points (24 and 48 h) in rat cortical cultures. In contrast, we could detect robust overexpression of ZSCAN21 protein in HEK293T cells, indicating that in primary neurons ZSCAN21 mRNA is tightly regulated at the post-transcriptional or post-translational level so that its protein levels remain steady. Supporting evidence toward this hypothesis was the fact that the slightly overexpressed ZSCAN21 protein was detected a little higher than the endogenous ZSCAN21 protein on the Western blot, indicating that perhaps the overexpressed protein could be post-translationally modified with ubiquitin, which subsequently leads to its clearance. However, this needs to be investigated further. It is interesting to note that although the mRNA levels of ZSCAN21 remain stable beyond P13, its protein levels continue to fall, especially in adulthood (Figs. 1 and 2), suggesting that such tight post-transcriptional regulation of ZSCAN21 levels also occurs in vivo. The fact that we could also detect overexpression of ZSCAN21 in another cell line, i.e. HEK293T cells, but not in cortical neuron cultures, implies that ZSCAN21 protein levels must be under tight regulation selectively in neurons and not in cell lines.
Regarding differentiated neurosphere cultures, where ZSCAN21 is expressed at higher levels, efficient silencing of ZSCAN21 leads to decreased levels of SNCA expression at both the mRNA and protein level, in contrast to the increased SNCA levels in cortical cultures and similarly to PC12 cells. The most likely explanation for this difference in SNCA transcription could be that it reflects the different neuronal maturation stage that these systems, cortical neurons and neurosphere cultures/PC12 cells, represent. Specifically, it is well known that defined sets of TFs are expressed during neuronal development to orchestrate specific regulatory functions and interactions that are distinct to each developmental stage. Additionally, many TFs can act as either activators or repressors of transcription depending on the associated co-factors. Specifically, regarding ZSCAN21, recent data from affinity capture mass spectrometry and two-hybrid assays (68–70) have shown that ZSCAN21 can physically interact with many TFs, being either co-activators or co-repressors RCOR1 (REST co-repressor 1), ZSCAN3, and Zkscan4 are examples of TFs that function as repressors. Therefore, we could posit that ZSCAN21 can either activate or repress a gene target, here SNCA, depending on the TF associated and the developmental stage expressed.
Regarding the in vivo situation, similarly to the in vitro study, we assessed SNCA transcription following ZSCAN21 silencing at two distinct developmental stages as follows: an early developmental stage (ZSCAN21 is robustly expressed) and a more mature stage (ZSCAN21 is expressed at low levels). Intriguingly, efficient down-regulation of ZSCAN21 did not affect SNCA mRNA levels in any of the two developmental stages tested. This lack of effect on SNCA levels in both developmental stages possibly indicates the presence of compensatory mechanisms that regulate SNCA transcription in the more complex in vivo settings. Alternatively, ZSCAN21 might have a role in even earlier developmental regulation of SNCA levels, where ZSCAN21 is expressed robustly (P1–10), but to examine this will require manipulating ZSCAN21 levels earlier than the 1-month period. Ideally, this could be achieved with the use of a ZSCAN21 knock-out animal that would allow us to assess SNCA expression throughout development. In contrast, an AAV-driven ZSCAN21 silencing approach is limited due to the fact that it requires long intervals (>15 days) for efficient down-regulation of the target gene.
Collectively, our data indicate that ZSCAN21 is a TF diversely involved in the process of SNCA transcriptional regulation dependent upon the neuronal maturation status of the culture system tested (cortical cultures and neurospheres). However, the fact that no alteration of SNCA levels was evident following ZSCAN21 down-regulation in vivo implies that ZSCAN21 is not a master regulator of SNCA transcription in vivo, at least at the developmental stages that were tested. Notwithstanding, another hypothesis could be that the transcriptional regulation of SNCA in not driven by a master regulator but instead involves a network of interactions between TFs and cis-regulatory elements within and around SNCA. Supporting evidence toward this scenario is the very complicated transcriptional architecture of the SNCA promoter and the fact that SNCA is transcriptionally induced in the luciferase assay in cortical neuronal cultures only when the core promoter and the intron 1 region act synergistically and not in isolation. Additionally, in combination with the inability to overexpress ZSCAN21 in post-mitotic neurons, likely due to its strict post-transcriptional/post-translational control, it would appear that, in the context of synucleinopathies, attempts to modulate SNCA transcription based on ZSCAN21 manipulation alone may not be fruitful. Conversely, strategies aiming at signaling pathways involved in SNCA transcription, or more directly targeting the specific gene or other regulatory regions involved in SNCA transcription, perhaps synergistically with ZSCAN21, would be more worthwhile.
Author Contributions
G. D. performed the majority of the experimental work, analyzed the results, and wrote most of the paper. N. P. set up the parameters and performed the FACS assay with G. D. P. K. P. helped with setting up the neurosphere cultures and the ChIP assay and also contributed to the interpretation of the data. L. S. conceived the idea for the project, designed the general framework for the experiments with G. D., and wrote the paper with G. D.
Acknowledgments
We thank Dr. Maria Xilouri for valuable advice and help in the construction of the AAV and AV viruses as well as assistance in the stereotaxic surgeries on this project. We also acknowledge the contribution of the graduate student Dimitra Mazaraki in the production of the AV viruses.
This work was supported in part by the European Union (European Social Fund) and Greek National Funds through the Operational Program “Education and Lifelong Learning” of the National Strategic Reference Framework-Research Funding Program: Heracleitus II, Investing in Knowledge Society through the European Social Fund. The authors declare that they have no conflicts of interest with the contents of this article.
- PD
- Parkinson disease
- AV
- adenovirus
- AAV
- adeno-associated virus
- DIV
- days in vitro
- IF
- fluorescent immunocyto/histochemistry
- P
- post-natal day
- SNCA
- α-synuclein protein
- TF
- transcription factor
- ZSCAN21
- zinc finger and SCAN domain containing 21 transcription factor
- m.o.i.
- multiplicity of infection
- EGFP
- enhanced GFP
- rAd
- recombinant adenovirus
- DG
- dentate gyrus
- ctl
- control.
References
- 1. Deng H., and Yuan L. (2014) Genetic variants and animal models in SNCA and Parkinson disease. Ageing Res. Rev. 15, 161–176 [DOI] [PubMed] [Google Scholar]
- 2. Pankratz N., Wilk J. B., Latourelle J. C., DeStefano A. L., Halter C., Pugh E. W., Doheny K. F., Gusella J. F., Nichols W. C., Foroud T., Myers R. H., (2009) Genomewide association study for susceptibility genes contributing to familial Parkinson disease. Hum. Genet. 124, 593–605 [DOI] [PMC free article] [PubMed] [Google Scholar]
- 3. Satake W., Nakabayashi Y., Mizuta I., Hirota Y., Ito C., Kubo M., Kawaguchi T., Tsunoda T., Watanabe M., Takeda A., Tomiyama H., Nakashima K., Hasegawa K., Obata F., Yoshikawa T., et al. (2009) Genome-wide association study identifies common variants at four loci as genetic risk factors for Parkinson's disease. Nat. Genet. 41, 1303–1307 [DOI] [PubMed] [Google Scholar]
- 4. Simón-Sánchez J., Schulte C., Bras J. M., Sharma M., Gibbs J. R., Berg D., Paisan-Ruiz C., Lichtner P., Scholz S. W., Hernandez D. G., Krüger R., Federoff M., Klein C., Goate A., Perlmutter J., et al. (2009) Genome-wide association study reveals genetic risk underlying Parkinson's disease. Nat. Genet. 41, 1308–1312 [DOI] [PMC free article] [PubMed] [Google Scholar]
- 5. Edwards T. L., Scott W. K., Almonte C., Burt A., Powell E. H., Beecham G. W., Wang L., Züchner S., Konidari I., Wang G., Singer C., Nahab F., Scott B., Stajich J. M., Pericak-Vance M., Haines J., Vance J. M., and Martin E. R. (2010) Genome-wide association study confirms SNPs in SNCA and the MAPT region as common risk factors for Parkinson disease. Ann. Hum. Genet. 74, 97–109 [DOI] [PMC free article] [PubMed] [Google Scholar]
- 6. International Parkinson Disease Genomics Consortium, Nalls M. A., Plagnol V., Hernandez D. G., Sharma M., Sheerin U. M., Saad M., Simón-Sánchez J., Schulte C., Lesage S., Sveinbjörnsdóttir S., Stefánsson K., Martinez M., Hardy J., Heutink P., Brice A., Gasser T., Singleton A. B., and Wood N. W. (2011) Imputation of sequence variants for identification of genetic risks for Parkinson's disease: a meta-analysis of genome-wide association studies. Lancet 377, 641–649 [DOI] [PMC free article] [PubMed] [Google Scholar]
- 7. Petersen K., Olesen O. F., and Mikkelsen J. D. (1999) Developmental expression of α-synuclein in rat hippocampus and cerebral cortex. Neuroscience 91, 651–659 [DOI] [PubMed] [Google Scholar]
- 8. Rockenstein E., Hansen L. A., Mallory M., Trojanowski J. Q., Galasko D., and Masliah E. (2001) Altered expression of the synuclein family mRNA in Lewy body and Alzheimer's disease. Brain Res. 914, 48–56 [DOI] [PubMed] [Google Scholar]
- 9. Kingsbury A. E., Daniel S. E., Sangha H., Eisen S., Lees A. J., and Foster O. J. (2004) Alteration in α-synuclein mRNA expression in Parkinson's disease. Mov. Disord. 19, 162–170 [DOI] [PubMed] [Google Scholar]
- 10. Chiba-Falek O., Lopez G. J., and Nussbaum R. L. (2006) Levels of α-synuclein mRNA in sporadic Parkinson disease patients. Mov. Disord. 21, 1703–1708 [DOI] [PubMed] [Google Scholar]
- 11. Dachsel J. C., Lincoln S. J., Gonzalez J., Ross O. A., Dickson D. W., and Farrer M. J. (2007) The ups and downs of α-synuclein mRNA expression. Mov. Disord. 22, 293–295 [DOI] [PubMed] [Google Scholar]
- 12. Papapetropoulos S., Adi N., Mash D. C., Shehadeh L., Bishopric N., and Shehadeh L. (2007) Expression of α-synuclein mRNA in Parkinson's disease. Mov. Disord. 22, 1057–1059 [DOI] [PubMed] [Google Scholar]
- 13. Gründemann J., Schlaudraff F., Haeckel O., and Liss B. (2008) Elevated α-synuclein mRNA levels in individual UV-laser-microdissected dopaminergic substantia nigra neurons in idiopathic Parkinson's disease. Nucleic Acids Res. 36, e38. [DOI] [PMC free article] [PubMed] [Google Scholar]
- 14. Nuber S., Petrasch-Parwez E., Winner B., Winkler J., von Hörsten S., Schmidt T., Boy J., Kuhn M., Nguyen H. P., Teismann P., Schulz J. B., Neumann M., Pichler B. J., Reischl G., Holzmann C., et al. (2008) Neurodegeneration and motor dysfunction in a conditional model of Parkinson's disease. J. Neurosci. 28, 2471–2484 [DOI] [PMC free article] [PubMed] [Google Scholar]
- 15. Lim Y., Kehm V. M., Lee E. B., Soper J. H., Li C., Trojanowski J. Q., and Lee V. M. (2011) α-Syn suppression reverses synaptic and memory defects in a mouse model of dementia with Lewy bodies. J. Neurosci. 31, 10076–10087 [DOI] [PMC free article] [PubMed] [Google Scholar]
- 16. Chiba-Falek O., and Nussbaum R. L. (2001) Effect of allelic variation at the NACP-Rep1 repeat upstream of the α-synuclein gene (SNCA) on transcription in a cell culture luciferase reporter system. Hum. Mol. Genet. 10, 3101–3109 [DOI] [PubMed] [Google Scholar]
- 17. Chiba-Falek O., Touchman J. W., and Nussbaum R. L. (2003) Functional analysis of intra-allelic variation at NACP-Rep1 in the α-synuclein gene. Hum. Genet. 113, 426–431 [DOI] [PubMed] [Google Scholar]
- 18. Chiba-Falek O., Kowalak J. A., Smulson M. E., and Nussbaum R. L. (2005) Regulation of α-synuclein expression by poly (ADP ribose) polymerase-1 (PARP-1) binding to the NACP-Rep1 polymorphic site upstream of the SNCA gene. Am. J. Hum. Genet. 76, 478–492 [DOI] [PMC free article] [PubMed] [Google Scholar]
- 19. Linnertz C., Saucier L., Ge D., Cronin K. D., Burke J. R., Browndyke J. N., Hulette C. M., Welsh-Bohmer K. A., and Chiba-Falek O. (2009) Genetic regulation of α-synuclein mRNA expression in various human brain tissues. PLoS One 4, e7480. [DOI] [PMC free article] [PubMed] [Google Scholar]
- 20. Fuchs J., Tichopad A., Golub Y., Munz M., Schweitzer K. J., Wolf B., Berg D., Mueller J. C., and Gasser T. (2008) Genetic variability in the SNCA gene influences α-synuclein levels in the blood and brain. FASEB J. 22, 1327–1334 [DOI] [PubMed] [Google Scholar]
- 21. Mizuta I., Takafuji K., Ando Y., Satake W., Kanagawa M., Kobayashi K., Nagamori S., Shinohara T., Ito C., Yamamoto M., Hattori N., Murata M., Kanai Y., Murayama S., Nakagawa M., and Toda T. (2013) YY1 binds to α-synuclein 3′-flanking region SNP and stimulates antisense noncoding RNA expression. J. Hum. Genet. 58, 711–719 [DOI] [PubMed] [Google Scholar]
- 22. Sterling L., Walter M., Ting D., and Schüle B. (2014) Discovery of functional non-coding conserved regions in the α-synuclein gene locus. F1000Res. 3, 259. [DOI] [PMC free article] [PubMed] [Google Scholar]
- 23. Lutz M. W., Saul R., Linnertz C., Glenn O. C., Roses A. D., and Chiba-Falek O. (2015) A cytosine-thymine (CT)-rich haplotype in intron 4 of SNCA confers risk for Lewy body pathology in Alzheimer's disease and affects SNCA expression. Alzheimer's Dementia 11, 1133–1143 [DOI] [PMC free article] [PubMed] [Google Scholar]
- 24. Stefanis L., Kholodilov N., Rideout H. J., Burke R. E., and Greene L. A. (2001) Synuclein-1 is selectively up-regulated in response to nerve growth factor treatment in PC12 cells. J. Neurochem. 76, 1165–1176 [DOI] [PubMed] [Google Scholar]
- 25. Clough R. L., and Stefanis L. (2007) A novel pathway for transcriptional regulation of α-synuclein. FASEB J. 21, 596–607 [DOI] [PubMed] [Google Scholar]
- 26. Clough R. L., Dermentzaki G., Haritou M., Petsakou A., and Stefanis L. (2011) Regulation of α-synuclein expression in cultured cortical neurons. J. Neurochem. 117, 275–285 [DOI] [PubMed] [Google Scholar]
- 27. Vogiatzi T., Xilouri M., Vekrellis K., and Stefanis L. (2008) Wild type α-synuclein is degraded by chaperone-mediated autophagy and macroautophagy in neuronal cells. J. Biol. Chem. 283, 23542–23556 [DOI] [PMC free article] [PubMed] [Google Scholar]
- 28. Abbott R. D., Petrovitch H., White L. R., Masaki K. H., Tanner C. M., Curb J. D., Grandinetti A., Blanchette P. L., Popper J. S., and Ross G. W. (2001) Frequency of bowel movements and the future risk of Parkinson's disease. Neurology 57, 456–462 [DOI] [PubMed] [Google Scholar]
- 29. Jowaed A., Schmitt I., Kaut O., and Wüllner U. (2010) Methylation regulates α-synuclein expression and is decreased in Parkinson's disease patients' brains. J. Neurosci. 30, 6355–6359 [DOI] [PMC free article] [PubMed] [Google Scholar]
- 30. Matsumoto L., Takuma H., Tamaoka A., Kurisaki H., Date H., Tsuji S., and Iwata A. (2010) CpG demethylation enhances α-synuclein expression and affects the pathogenesis of Parkinson's disease. PLoS One 5, e15522. [DOI] [PMC free article] [PubMed] [Google Scholar]
- 31. Wang Y., Wang X., Li R., Yang Z. F., Wang Y. Z., Gong X. L., and Wang X. M. (2013) A DNA methyltransferase inhibitor, 5-aza-2′-deoxycytidine, exacerbates neurotoxicity and upregulates Parkinson's disease-related genes in dopaminergic neurons. CNS Neurosci. Ther. 19, 183–190 [DOI] [PMC free article] [PubMed] [Google Scholar]
- 32. Ai S. X., Xu Q., Hu Y. C., Song C. Y., Guo J. F., Shen L., Wang C. R., Yu R. L., Yan X. X., and Tang B. S. (2014) Hypomethylation of SNCA in blood of patients with sporadic Parkinson's disease. J. Neurol. Sci. 337, 123–128 [DOI] [PubMed] [Google Scholar]
- 33. Pihlstrøm L., Berge V., Rengmark A., and Toft M. (2015) Parkinson's disease correlates with promoter methylation in the α-synuclein gene. Mov. Disord. 30, 577–580 [DOI] [PubMed] [Google Scholar]
- 34. Tan Y. Y., Wu L., Zhao Z. B., Wang Y., Xiao Q., Liu J., Wang G., Ma J. F., and Chen S. D. (2014) Methylation of α-synuclein and leucine-rich repeat kinase 2 in leukocyte DNA of Parkinson's disease patients. Parkinsonism Relat. Disord. 20, 308–313 [DOI] [PubMed] [Google Scholar]
- 35. Laity J. H., Lee B. M., and Wright P. E. (2001) Zinc finger proteins: new insights into structural and functional diversity. Curr. Opin. Struct. Biol. 11, 39–46 [DOI] [PubMed] [Google Scholar]
- 36. Yang X. W., Zhong R., and Heintz N. (1996) Granule cell specification in the developing mouse brain as defined by expression of the zinc finger transcription factor RU49. Development 122, 555–566 [DOI] [PubMed] [Google Scholar]
- 37. Yang X. W., Wynder C., Doughty M. L., and Heintz N. (1999) BAC-mediated gene-dosage analysis reveals a role for Zipro1 (Ru49/Zfp38) in progenitor cell proliferation in cerebellum and skin. Nat. Genet. 22, 327–335 [DOI] [PubMed] [Google Scholar]
- 38. Alder J., Cho N. K., and Hatten M. E. (1996) Embryonic precursor cells from the rhombic lip are specified to a cerebellar granule neuron identity. Neuron 17, 389–399 [DOI] [PubMed] [Google Scholar]
- 39. Brenner S., Wersinger C., and Gasser T. (2015) Transcriptional regulation of the α-synuclein gene in human brain tissue. Neurosci. Lett. 599, 140–145 [DOI] [PubMed] [Google Scholar]
- 40. Rideout H. J., and Stefanis L. (2002) Proteasomal inhibition-induced inclusion formation and death in cortical neurons require transcription and ubiquitination. Mol. Cell. Neurosci. 21, 223–238 [DOI] [PubMed] [Google Scholar]
- 41. Dietrich P., Rideout H. J., Wang Q., and Stefanis L. (2003) Lack of p53 delays apoptosis, but increases ubiquitinated inclusions, in proteasomal inhibitor-treated cultured cortical neurons. Mol. Cell. Neurosci. 24, 430–441 [DOI] [PubMed] [Google Scholar]
- 42. Kaltezioti V., Kouroupi G., Oikonomaki M., Mantouvalou E., Stergiopoulos A., Charonis A., Rohrer H., Matsas R., and Politis P. K. (2010) Prox1 regulates the notch1-mediated inhibition of neurogenesis. PLoS Biol. 8, e1000565. [DOI] [PMC free article] [PubMed] [Google Scholar]
- 43. Guez-Barber D., Fanous S., Harvey B. K., Zhang Y., Lehrmann E., Becker K. G., Picciotto M. R., and Hope B. T. (2012) FACS purification of immunolabeled cell types from adult rat brain. J. Neurosci. Methods 203, 10–18 [DOI] [PMC free article] [PubMed] [Google Scholar]
- 44. Pruszak J., Ludwig W., Blak A., Alavian K., and Isacson O. (2009) CD15, CD24, and CD29 define a surface biomarker code for neural lineage differentiation of stem cells. Stem Cells 27, 2928–2940 [DOI] [PMC free article] [PubMed] [Google Scholar]
- 45. Yuan S. H., Martin J., Elia J., Flippin J., Paramban R. I., Hefferan M. P., Vidal J. G., Mu Y., Killian R. L., Israel M. A., Emre N., Marsala S., Marsala M., Gage F. H., Goldstein L. S., and Carson C. T. (2011) Cell-surface marker signatures for the isolation of neural stem cells, glia and neurons derived from human pluripotent stem cells. PLoS One 6, e17540. [DOI] [PMC free article] [PubMed] [Google Scholar]
- 46. Livak K. J., and Schmittgen T. D. (2001) Analysis of relative gene expression data using real-time quantitative PCR and the 2(−ΔΔC(T)) Method. Methods 25, 402–408 [DOI] [PubMed] [Google Scholar]
- 47. Clough R. L., Dermentzaki G., and Stefanis L. (2009) Functional dissection of the α-synuclein promoter: transcriptional regulation by ZSCAN21 and ZNF219. J. Neurochem. 110, 1479–1490 [DOI] [PubMed] [Google Scholar]
- 48. Kaltezioti V., Antoniou D., Stergiopoulos A., Rozani I., Rohrer H., and Politis P. K. (2014) Prox1 regulates Olig2 expression to modulate binary fate decisions in spinal cord neurons. J. Neurosci. 34, 15816–15831 [DOI] [PMC free article] [PubMed] [Google Scholar]
- 49. Grimm D., Kern A., Rittner K., and Kleinschmidt J. A. (1998) Novel tools for production and purification of recombinant adenoassociated virus vectors. Hum. Gene Ther. 9, 2745–2760 [DOI] [PubMed] [Google Scholar]
- 50. Zolotukhin S., Byrne B. J., Mason E., Zolotukhin I., Potter M., Chesnut K., Summerford C., Samulski R. J., and Muzyczka N. (1999) Recombinant adeno-associated virus purification using novel methods improves infectious titer and yield. Gene Ther. 6, 973–985 [DOI] [PubMed] [Google Scholar]
- 51. Xilouri M., Brekk O. R., Landeck N., Pitychoutis P. M., Papasilekas T., Papadopoulou-Daifoti Z., Kirik D., and Stefanis L. (2013) Boosting chaperone-mediated autophagy in vivo mitigates α-synuclein-induced neurodegeneration. Brain 136, 2130–2146 [DOI] [PubMed] [Google Scholar]
- 52. He T. C., Zhou S., da Costa L. T., Yu J., Kinzler K. W., and Vogelstein B. (1998) A simplified system for generating recombinant adenoviruses. Proc. Natl. Acad. Sci. U.S.A. 95, 2509–2514 [DOI] [PMC free article] [PubMed] [Google Scholar]
- 53. Xilouri M., Kyratzi E., Pitychoutis P. M., Papadopoulou-Daifoti Z., Perier C., Vila M., Maniati M., Ulusoy A., Kirik D., Park D. S., Wada K., and Stefanis L. (2012) Selective neuroprotective effects of the S18Y polymorphic variant of UCH-L1 in the dopaminergic system. Hum. Mol. Genet. 21, 874–889 [DOI] [PubMed] [Google Scholar]
- 54. Kim J. Y., Ash R. T., Ceballos-Diaz C., Levites Y., Golde T. E., Smirnakis S. M., and Jankowsky J. L. (2013) Viral transduction of the neonatal brain delivers controllable genetic mosaicism for visualising and manipulating neuronal circuits in vivo. Eur. J. Neurosci. 37, 1203–1220 [DOI] [PMC free article] [PubMed] [Google Scholar]
- 55. Neystat M., Lynch T., Przedborski S., Kholodilov N., Rzhetskaya M., and Burke R. E. (1999) α-Synuclein expression in substantia nigra and cortex in Parkinson's disease. Mov. Disord. 14, 417–422 [DOI] [PubMed] [Google Scholar]
- 56. Saleh H., Saleh A., Yao H., Cui J., Shen Y., and Li R. (2015) Mini review: linkage between α-synuclein protein and cognition. Transl. Neurodegener. 4, 5. [DOI] [PMC free article] [PubMed] [Google Scholar]
- 57. Calabresi P., Castrioto A., Di Filippo M., and Picconi B. (2013) New experimental and clinical links between the hippocampus and the dopaminergic system in Parkinson's disease. Lancet 12, 811–821 [DOI] [PubMed] [Google Scholar]
- 58. Bayer T. A., Jäkälä P., Hartmann T., Egensperger R., Buslei R., Falkai P., and Beyreuther K. (1999) Neural expression profile of α-synuclein in developing human cortex. Neuroreport 10, 2799–2803 [DOI] [PubMed] [Google Scholar]
- 59. Galvin J. E., Schuck T. M., Lee V. M., and Trojanowski J. Q. (2001) Differential expression and distribution of α-, β-, and γ-synuclein in the developing human substantia nigra. Exp. Neurol. 168, 347–355 [DOI] [PubMed] [Google Scholar]
- 60. Raghavan R., Kruijff Ld., Sterrenburg M. D., Rogers B. B., Hladik C. L., and White C. L. 3rd (2004) α-Synuclein expression in the developing human brain. Pediatr. Dev. Pathol. 7, 506–516 [DOI] [PubMed] [Google Scholar]
- 61. Moffat J., Grueneberg D. A., Yang X., Kim S. Y., Kloepfer A. M., Hinkle G., Piqani B., Eisenhaure T. M., Luo B., Grenier J. K., Carpenter A. E., Foo S. Y., Stewart S. A., Stockwell B. R., Hacohen N., et al. (2006) A lentiviral RNAi library for human and mouse genes applied to an arrayed viral high-content screen. Cell 124, 1283–1298 [DOI] [PubMed] [Google Scholar]
- 62. Stewart S. A., Dykxhoorn D. M., Palliser D., Mizuno H., Yu E. Y., An D. S., Sabatini D. M., Chen I. S., Hahn W. C., Sharp P. A., Weinberg R. A., and Novina C. D. (2003) Lentivirus-delivered stable gene silencing by RNAi in primary cells. RNA 9, 493–501 [DOI] [PMC free article] [PubMed] [Google Scholar]
- 63. Zufferey R., Nagy D., Mandel R. J., Naldini L., and Trono D. (1997) Multiply attenuated lentiviral vector achieves efficient gene delivery in vivo. Nat. Biotechnol. 15, 871–875 [DOI] [PubMed] [Google Scholar]
- 64. Zufferey R., Dull T., Mandel R. J., Bukovsky A., Quiroz D., Naldini L., and Trono D. (1998) Self-inactivating lentivirus vector for safe and efficient in vivo gene delivery. J. Virol. 72, 9873–9880 [DOI] [PMC free article] [PubMed] [Google Scholar]
- 65. Yamamoto T., and Tsunetsugu-Yokota Y. (2008) Prospects for the therapeutic application of lentivirus-based gene therapy to HIV-1 infection. Curr. Gene Ther. 8, 1–8 [DOI] [PubMed] [Google Scholar]
- 66. Reynolds B. A., and Weiss S. (1992) Generation of neurons and astrocytes from isolated cells of the adult mammalian central nervous system. Science 255, 1707–1710 [DOI] [PubMed] [Google Scholar]
- 67. Wright J. A., McHugh P. C., Pan S., Cunningham A., and Brown D. R. (2013) Counter-regulation of α- and β-synuclein expression at the transcriptional level. Mol. Cell. Neurosci. 57, 33–41 [DOI] [PubMed] [Google Scholar]
- 68. Woods N. T., Mesquita R. D., Sweet M., Carvalho M. A., Li X., Liu Y., Nguyen H., Thomas C. E., Iversen E. S. Jr., Marsillac S., Karchin R., Koomen J., and Monteiro A. N. (2012) Charting the landscape of tandem BRCT domain-mediated protein interactions. Sci. Signal. 5, rs6. [DOI] [PMC free article] [PubMed] [Google Scholar]
- 69. Huttlin E. L., Ting L., Bruckner R. J., Gebreab F., Gygi M. P., Szpyt J., Tam S., Zarraga G., Colby G., Baltier K., Dong R., Guarani V., Vaites L. P., Ordureau A., Rad R., et al. (2015) The BioPlex Network: A Systematic Exploration of the Human Interactome. Cell 162, 425–440 [DOI] [PMC free article] [PubMed] [Google Scholar]
- 70. Rolland T., Taşan M., Charloteaux B., Pevzner S. J., Zhong Q., Sahni N., Yi S., Lemmens I., Fontanillo C., Mosca R., Kamburov A., Ghiassian S. D., Yang X., Ghamsari L., Balcha D., et al. (2014) A proteome-scale map of the human interactome network. Cell 159, 1212–1226 [DOI] [PMC free article] [PubMed] [Google Scholar]
- 71. Paxinos G., and Watson C. (eds) (1998) The Rat Brain in Stereotaxic Coordinates, 4th Ed., Academic Press, New York [Google Scholar]