Abstract
It has been recognized that the rate-limiting function of pyruvate kinase M2 (PKM2) in glycolysis plays an important role in distributing glycolytic intermediates for anabolic and catabolic purposes in cancer cells. However, after analysis of the catalytic capacity of PKM2 relative to other glycolytic enzymes, the regulation range of PKM2 activity, metabolic flux control, and thermodynamics, we suggest that the PKM2-catalyzed reaction is not a rate-limiting step in cancer cell glycolysis. Hexokinase and phosphofructokinase 1 (PFK1), the first and third enzyme along the pathway, are rate-limiting enzymes that limit the overall glycolytic rate, whereas PKM2 and lactate dehydrogenase, the last two enzymes in the pathway, are for the fast removal of upstream intermediates to prevent the obstruction of the pathway. The argument is in accordance with the catalytic capacity of glycolytic enzymes, regulation range of enzyme activities, metabolic flux control, and thermodynamics.
Keywords: cancer, glycolysis, hexokinase, phosphofructokinase, pyruvate kinase
Introduction
During tumorigenesis, pyruvate kinase (PK) isotype in cells switches from pyruvate kinase M1 (PKM1) or pyruvate kinase L (PKL) to PKM2 (1, 2), suggesting that PKM2 plays a part in tumor initiation and development. PK catalyzes the last step of glycolysis and is commonly regarded as a rate-limiting enzyme. In cancer cells, PKM2 is considered as a rate-limiting enzyme, because its enzyme activity is sensitive to allosteric regulation (3, 4) and it catalyzes a thermodynamically favorable reaction. It is proposed that when it is allosterically inhibited, its catalytic rate is lower than the upstream glycolytic rate; hence, phosphoenolpyruvate (PEP)4 and upstream glycolytic intermediate may accumulate and flow to anabolic pathways; when it is allosterically activated, its activity is higher than the upstream glycolytic rate, and the upstream glycolytic intermediate would flow to pyruvate, which is then converted to lactate or enters mitochondria for complete oxidation. There are several lines of evidence that support this hypothesis (1, 4–11).
However, the evidence to support PKM2 as a rate-limiting enzyme is not sufficient. If PKM2 is a rate-limiting enzyme, the following lines of evidence are required: (a) PKM2 catalyzes an irreversible reaction; (b) its enzyme activity relative to other glycolytic enzymes is low; (c) its activity is sensitive to regulation; and (d) when its activity is allosterically activated, its catalytic rate should be higher than the upstream glycolytic rate and when its activity is allosterically inhibited, its catalytic rate should be lower than upstream glycolytic rate. So far, there is evidence of points a and c but no b and d.
Experimental Procedures
Cell Lines
Murine breast cancer cell line 4T1, human breast cancer cell line Bcap37, human cervical cancer cell line HeLa, human gastric cancer cell line SGC7901, human colon cancer cell line RKO, human liver cancer cell lines HepG2 and SMMC7721 were used in this study. Cells were maintained in RPMI 1640 medium (Invitrogen) supplemented with 10% fetal bovine serum (FBS), 100 units/ml penicillin/streptomycin, and 2 mm l-glutamine (complete RPMI 1640 medium).
Reagents and Enzymes
Glucose, Glc-6-P, fructose 6-phosphate (Fru-6-P), fructose 1,6-bisphosphate (FBP), glyceraldehyde 3-phosphate (GA3P), 3-phosphoglycerate (3PG), 2-phosphoglycerate (2PG), PEP, pyruvate, ADP, ATP, AMP, NAD(P), NAD(P)H, hexokinase 2 (HK2), phosphohexose isomerase (PGI), aldolase, triose-phosphate isomerase (TPI), glyceraldehyde-3-phosphate dehydrogenase (GAPDH), phosphoglycerate kinase (PGK), enolase, PK, and LDH were all from Sigma. PFK1 was from XIMEI (China).
Preparation of Recombinant PKM2, PKM1, and PKL
Recombinant PKM2, PKM1, and PKL was cloned and purified as the method described by us previously (12). The cDNA of PKM2, PKM1, and PKL was amplified from the cDNAs of the human breast cancer cell line MCF-7, human muscle, and human liver, respectively. Specimens of human muscle and human liver were obtained from the Tissue Bank of the Second Affiliated Hospital, Zhejiang University. The use of human tissue was approved by the hospital's Institutional Review Board. The cDNA of PKM2, PKM1, and PKL was cloned into pQE-30 (Qiagen, Hamburg, Germany) with an N-terminal His6 tag and expressed in Escherichia coli strain XL-1 blue (Qiagen). Each clone was confirmed by sequencing by Invitrogen. When the E. coli culture attained an absorbance (600 nm) of 0.7, expression was induced by 1 mm isopropyl β-d-thiogalactoside (Gibco) for 6 h at room temperature. The cells were collected and lysed by a freeze/thaw cycle and sonication. The lysate was passed through a nickel-Sepharose column (GE Healthcare); the protein not bound to nickel-Sepharose was washed with washing buffer (0.1 m Tris-HCl, pH 7.8, containing 0.5 m NaCl, and 40 mm imidazole), and PK was eluted by using 250 mm imidazole. The purity of recombinant PKs was determined by SDS-PAGE and Coomassie Blue staining. The kinetic characteristic of the PKs was determined by an LDH-coupled activity assay.
Glucose Consumption and Lactate Generation
1 × 10⁶ cells were seeded into 25-cm2 culture flask (Corning) to allow attachment overnight in a humidified CO2 incubator. The culture media were then replaced with fresh complete RPMI 1640 medium plus 6 mm glucose. The glucose level was measured automatically by the HK colorimetric method using an Olympus AU2700 system, and the lactate production was determined by the VITROS Chemistry Product LAC Slides using the VITROS 5.1 FS system; the L/G ratio was calculated as lactate generated over glucose consumption.
Preparation of Cell Lysate
4T1, Bcap37, HeLa, SGC7901, RKO, HepG2, and SMMC7721 cells cultured in complete RPMI 1640 medium with 6 mm glucose and at 70% confluence were washed twice with ice-cold PBS and lysed with M-PERTM mammalian protein extraction reagent supplemented with HaltTM protease inhibitor mixture (both from Thermo Scientific). The resultant crude cell lysates were used for enzyme activity and Km determination. Protein concentration was measured by BCA protein assay kit (Pierce).
Western Blot
Cells were lysed with M-PERTM mammalian protein extraction reagent supplemented with HaltTM protease inhibitor mixture. Protein concentration was measured by BCA protein assay kit. After heat denaturation, the protein was applied to a 10–12% SDS-polyacrylamide gel, transferred to a PVDF membrane, and then detected by the proper primary and secondary antibodies before visualization by Western Lighting Plus ECL kit (PerkinElmer Life Sciences). The primary antibodies used were as follows: rabbit anti-PKM1 and PKM2 (Cell Signaling Technology); rabbit anti-PKLR (Abcam); rabbit anti-HK2 (Cell Signaling Technology); and mouse anti-lactate dehydrogenase A (LDHA) (Cell Signaling Technology).
Measurement of Enzyme Activity at Saturating Substrate Concentration
The activities of each of the 11 enzymes were individually measured according to previously reported methods (13–23). Briefly, a reaction was initiated by addition of the cell lysate (2–20 μg of protein) into the reaction buffer, reactant, and when appropriate the cofactor in a total volume of 1 ml. The amounts of the lysates used and the reaction times were carefully tested for each enzyme to maintain the linearity for each reaction. The absorbance at a wavelength of 260 nm (phosphoglycerate mutase and enolase) or 340 nm (HK, PGI, PFK1, aldolase, TPI, GAPDH, PGK, PKM2, and LDH) were monitored at 37 °C with a spectrophotometer (DU® Series 700, Beckman Coulter, Inc.). To get the linearity of each reaction, we added different amounts of cell lysate into the reaction mixture for different enzyme assays. The reaction mixture for each enzyme measurement was as described below.
HK
Reaction mixture contained 50 mm Hepes, 5 mm MgCl2, 0.1 m glucose, 0.5 mm ATP, 0.2 mm NADP, 1 unit of glucose-6-phosphate dehydrogenase, and the cell lysate was added into the reaction mixture to a final concentration of 20 μg of protein/ml.
PGI
50 mm Hepes, 5 mm MgCl2, 2 mm Fru-6-P and cell lysate was added into the reaction mixture to a final concentration of 5 μg of protein/ml.
PFK1
50 mm Hepes, 100 mm KCl, 5 mm MgCl2, 5 mm Na2HPO4, 1 mm NH4Cl, 5 mm Fru-6-P, 1.5 mm ATP, 0.2 mm NADH, 0.1 mm AMP, 1 unit of α-glycerophosphate dehydrogenase (α-GPDH), 1 unit of TPI, 1 unit of aldolase, and cell lysate was added into the reaction mixture to a final concentration of 20 μg of protein/ml.
Aldolase
50 mm Hepes, 1 mm FBP, 0.2 mm NADH, 1 unit of α-GPDH, 1 unit of TPI, and cell lysate was added into the reaction mixture to a final concentration of 15 μg of protein/ml.
TPI
50 mm Hepes, 5 mm EDTA, 1 mm GA3P, 0.2 mm NADH, 1 unit of α-GPDH and cell lysate was added into reaction mixture to a final concentration of 2 μg of protein/ml.
GAPDH
50 mm Hepes, 5 mm Na2HPO4, 0.2 mm EDTA, 1 mm GA3P, 1 mm NAD, and cell lysate was added into the reaction mixture to a final concentration of 4 μg of protein/ml.
PGK
50 mm Hepes, 10 mm 3PG, 4 mm ATP, 6 mm MgSO4, 0.2 mm EDTA, 0.2 mm NADH, 1 unit of GAPDH, and cell lysate was added into the reaction mixture to a final concentration of 4 μg/ml.
Phosphoglycerate Mutase
50 mm Hepes, 5 mm MgCl2, 2 mm 3PG, 1 unit of enolase, and cell lysate was added into the reaction mixture to a final concentration of 20 μg of protein/ml.
Enolase
50 mm Hepes, 1 mm MgCl2, 50 mm KCl, 1 mm EDTA, 1 mm 2PG, and cell lysate was added into the reaction mixture to a final concentration of 20 μg of protein/ml.
PKM2
50 mm Hepes, 100 mm KCl, 5 mm MgCl2, 0.5 mm EDTA, 0.2 mm NADH, 1.5 mm ADP, 5 mm PEP, 1 unit of LDH, and cell lysate was added into the reaction mixture to a final concentration of 2 μg of protein/ml.
LDH
50 mm Hepes, 0.05% BSA, 2 mm pyruvate, 0.2 mm NADH, and cell lysate was added into the reaction mixture to a final concentration of 2 μg of protein/ml.
Measurement of Enzyme Activity at Physiological Substrate Concentration
The condition is the same as above, except for the concentration of substrates. The PEP and ADP for PKM2 was 0.25 mm and 50 μm, respectively; the Fru-6-P for PFK1 was 0.1 mm, and the glucose for HK was 2 mm.
Measurement of Glycolytic Intermediates
A million (1 × 10⁶) cells per well in complete RPMI 1640 medium were seeded into 6-well plates and allowed to attach overnight. The culture media were then replaced with 2 ml of fresh complete RPMI 1640 medium plus 6 mm glucose and cultured for 2 h. After removal of the medium, cells were quickly washed twice with ice-cold PBS. Prechilled 400 μl of 0.6 m HClO4 was added, shaken on ice for 10 min, and aspirated. The solution was neutralized with 40 μl of 3 m K2CO3 and kept on ice for about 30 min. After centrifugation, the supernatant was used for spectrophotometric determination of glycolytic intermediates (24).
Assay of Glucose, Glc-6-P, and Fru-6-P
100 μl of supernatant and 10 μl of 20 mm NADP were added to the reaction buffer (200 mm Hepes, 5 mm MgCl2, pH 7.3) for a total volume of 1 ml. The reaction was started with 1 unit of G6PDH to measure Glc-6-P. After reaction termination, 1 unit of PGI was added to measure Fru-6-P. 10 μl of 50 mm ATP and 1 unit of HK2 were added to measure glucose.
Assay of FBP, Dihydroxyacetone Phosphate, and GA3P
100 μl of supernatant and 10 μl of 20 mm NADH were added to the reaction buffer (200 mm Hepes, 5 mm EDTA, pH 7.3) for a total volume of 1 ml. The reaction was started with 1 unit of α-GPDH to measure dihydroxyacetone phosphate. After reaction termination, 1 unit of TPI was added to measure GA3P. 1 unit of aldolase was added to measure FBP.
Assay of 3PG
100 μl of supernatant, 10 μl of 20 mm NADH, and 1 unit of PGK were added to the reaction buffer (200 mm Hepes, 5 mm MgCl2, pH 7.3) for a total volume of 1 ml. The reaction was started with 1 unit of GAPDH to measure 3PG.
Assay of 2PG, PEP, and Pyruvate
100 μl of supernatant and 10 μl of 20 mm NADH were added to the reaction buffer (200 mm Hepes, 5 mm MgCl2, pH 7.3) for a total volume of 1 ml. The reaction was started with 1 unit of LDH to measure pyruvate. After reaction termination, 10 μl of 50 mm ADP and 1 unit of PK were added to measure PEP. 1 unit of enolase was added to measure 2PG.
In Vitro Glycolytic System
4T1 cells cultured in complete RPMI 1640 medium with 6 mm glucose, and at 70% confluence the cells were washed twice with ice-cold PBS and lysed with M-PERTM mammalian protein extraction reagent supplemented with HaltTM protease inhibitor mixture. The resultant crude 4T1 cell lysates when reconstituted with a buffer (200 mm Hepes, pH 7.3, 5 mm MgCl2, 0.5 mm EDTA, 5 mm Na2HPO4, 50 mm KCl, 10 mm glucose, 1.5 mm ATP, 1.5 mm ADP, 2 mm NAD, and 0.2 mm NADH), empirically determined to be suitable for all 11 relevant enzymes, were able to fulfill an entire conversion of glucose to lactate in the cell-free system. Unless otherwise specified, each reaction was initiated by adding 4T1 cell lysates to the above buffer in a total volume of 600 μl; because the volumes of added cell lysates were small as compared with total reaction volumes, the levels of endogenous glycolytic metabolites and cofactors were negligible. The action was terminated by adding 600 μl 1 m HClO4, then neutralized with 100 μl 3 m K2CO3, After keeping on ice for about 30 min and centrifugation, the supernatant obtained was analyzed for the lactate generated. When PKM2 was assayed, the reaction mixture was the same as above, except ADP was 50 μm. The amounts of generated lactate were determined by HPLC as described by us previously (25).
Metabolic Flux Control Assay
Metabolic flux control assay is aimed at describing the control ability of each glycolytic enzyme to glycolysis. The control is described as the infinitesimal fractional change in the activity of the enzyme that causes the fractional change of flux (26). Using the in vitro glycolytic system as described above, we monitored the flux change by adding extra glycolytic enzyme to the system, so we could get a serial glycolysis flux with different enzyme activity, e.g. when we tried to determine the contribution of HK to glycolytic rate, we added a serial amount of pure HK2 into the in vitro glycolytic system. The fluxes were reflected by the amount of generated lactate. The amounts of generated lactate were determined by HPLC as described by us previously (25). For PKM2, assay, the condition was the same as above except that ADP concentration in the in vitro glycolytic system was 50 μm.
To plot the graph about flux and enzyme activity, flux values were normalized with respect to the value of basal flux (without adding any extra enzyme), and enzyme activity values were divided by their respective Km values as described before (27).
Calculation of the Gibbs Free Energy Change (ΔG) of the Glycolytic Reactions
ΔG can be calculated according to the following equation: ΔG = ΔG310 K′0 + RTlnQ, where ΔG310 K′0 denotes the standard transformed Gibbs free energy at 37 °C, and Q can be calculated from the glycolytic intermediates data (Table 2), and ATP/ADP and NAD/NADH were set as 10 and 78.8, respectively. (We determined the ATP, ADP, NAD, and NADH concentrations in 4T1, HeLa, and Bcap37 cells, which were relatively stable and so the average value was used for Q value calculation.) For example, the Q value of the reaction catalyzed by HK was calculated as [Glc-6-P][ADP]/[glucose][ATP].
TABLE 2.
Glycolytic metabolites in seven cancer cell lines
| Cells | Glycolytic metabolites (mm) |
||||||
|---|---|---|---|---|---|---|---|
| Glucose | G6P | F6P | FBP | PEP | Pyruvate | Lactate | |
| 4T1 | 1.91 ± 0.05 | 0.14 ± 0.02 | 0.09 ± 0.00 | 0.64 ± 0.02 | 0.25 ± 0.01 | 0.28 ± 0.03 | 2.00 ± 0.15 |
| HepG2 | 2.52 ± 0.05 | 0.22 ± 0.01 | 0.15 ± 0.01 | 0.57 ± 0.06 | 0.21 ± 0.03 | 0.20 ± 0.02 | 6.95 ± 0.33 |
| SGC7901 | 3.09 ± 0.04 | 0.22 ± 0.02 | 0.14 ± 0.02 | 0.55 ± 0.01 | 0.20 ± 0.01 | 0.27 ± 0.02 | 3.95 ± 0.44 |
| SMMC7721 | 3.66 ± 0.02 | 0.17 ± 0.01 | 0.12 ± 0.01 | 0.36 ± 0.03 | 0.25 ± 0.01 | 0.32 ± 0.06 | 6.86 ± 0.21 |
| HeLa | 3.00 ± 0.05 | 0.18 ± 0.01 | 0.16 ± 0.01 | 0.46 ± 0.03 | 0.16 ± 0.02 | 0.21 ± 0.02 | 6.30 ± 0.52 |
| RKO | 1.62 ± 0.05 | 0.18 ± 0.01 | 0.14 ± 0.01 | 0.48 ± 0.01 | 0.15 ± 0.04 | 0.18 ± 0.01 | 5.03 ± 0.55 |
| Bcap37 | 2.93 ± 0.04 | 0.20 ± 0.02 | 0.17 ± 0.02 | 0.58 ± 0.01 | 0.23 ± 0.02 | 0.23 ± 0.06 | 5.38 ± 0.40 |
The question is that ΔG′0310 K is not available. We calculated the ΔG′0310 K from ΔG′0298 K according to Equation 1,
Because the change of ΔH and ΔS is negligible between 298 K (25 °C) and 31 0K (37 °C) (28, 29), the equation can be expressed as shown in Equation 2,
 |
siRNA Knockdown Experiment
1 × 10⁵ 4T1 cells per well in complete RPMI 1640 medium were seeded into 6-well plates, then transfected with either negative control siRNA (siR-RiboTM negative control, Ribobio, China) or HK2, PFK1, PKM2, and LDHA siRNA, and cultured for 72 h. The sequences of deployed siRNAs were as follows: HK2 sense, CCAAAGAUGUCUCGGAUAU-dTdT, and antisense, AUAUCCGAGACAUCUUUGG-dTdT; PFK1 sense, GCACGACUUGUGACCGAAU-dTdT, and antisense, AUUCGGUCACAAGUCGUGC-dTdT; PKM2 sense, CCAUUAUCGUGCUCACCAA-dTdT, and antisense, UUGGUGAGCACGAUAAUGG-dTdT; and LDHA sense, GGAUGAGCUUGCCCUUGUU-dTdT, and antisense, AACAAGGGCAAGCUCAUCC-dTdT. The final concentrations for negative control of HK2, PFK1, and PKM2 siRNA were 50 nm and for LDHA siRNA was 20 nm. The culture media were then replaced with 2 ml of fresh complete RPMI 1640 medium plus 6 mm glucose and cultured for a further 5 h. The culture media were collected for glucose and lactate determination. Cells were counted and collected for Western blot detection and enzyme activity assays, and the glucose consumption and lactate generation by intact cells and intracellular glycolytic intermediates were measured as described above.
PFK1 mRNA Detection
As the antibody against PFK1 is not commercially available, we used real time PCR to determine the transcriptional level of this enzyme. 1 × 10⁵ 4T1 cells per well in complete RPMI 1640 medium were seeded into 6-well plates, then transfected with either negative control siRNA or PFK1 siRNA (final concentration 50 nm), and cultured for 48 h. RNA was extracted and used to synthesize the first-strand cDNA using the Superscript system (Life Technologies, Inc.) according to the manufacturer's instructions. Real time PCR was performed using the Power SYBR Green PCR Master Mix protocol (Applied Biosystems). Sequences of the primers for real time PCR was as follows: forward 5′-CCCCCAGTCTCTAAGGGTGG-3′ and reverse 5′-ATCATGTACGACCAGCACCC-3′.
PKM2 Activator TEPP-46 Treatment Experiment
A million (1 × 10⁶) 4T1 cells per well in complete RPMI 1640 medium were seeded into 6-well plates and allowed to attach overnight. The culture media were then replaced with 2 ml of fresh complete RPMI 1640 medium plus 6 mm glucose with 0.5 or 2 μm TEPP-46 (Cayman Chemical) or not and then cultured for 5 h. The culture media were collected for glucose and lactate determination, and cells were collected and subjected to PKM2 enzyme activity assays and intracellular FBP determination, as described above.
Results and Discussion
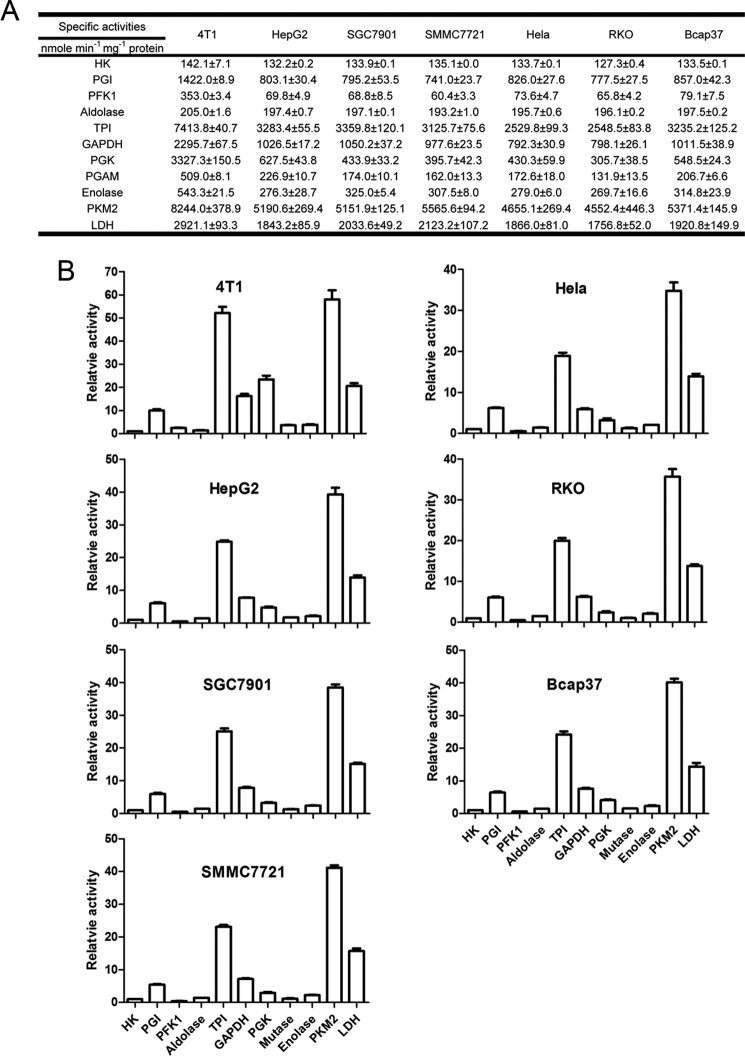
The first question is as follows. In cancer cells is PKM2 activity relatively low in comparison with other glycolytic enzymes? We measured the glycolytic enzymes in seven randomly picked cancer cell lines. These cancer cells express PKM2 (Fig. 1). The pattern of the enzyme activities in these cancer cells was remarkably similar (Fig. 2). The activities of PKM2 in seven cancer cells lines were all the highest in glycolytic enzymes (Fig. 2). By contrast, the activities of HK and PFK1 were lower than those of other glycolytic enzymes, except that PFK1 activity was higher than that of aldolase in 4T1 cells. The relative activities of PKM2 in the tested cancer cells were 34.8–58.1-fold higher than HK, and 23.4–92.1-fold higher than PFK1 (Fig. 2). Similarly, PKM2 activities in clinical tumors were also far higher than those of HK (Table 1).
FIGURE 1.
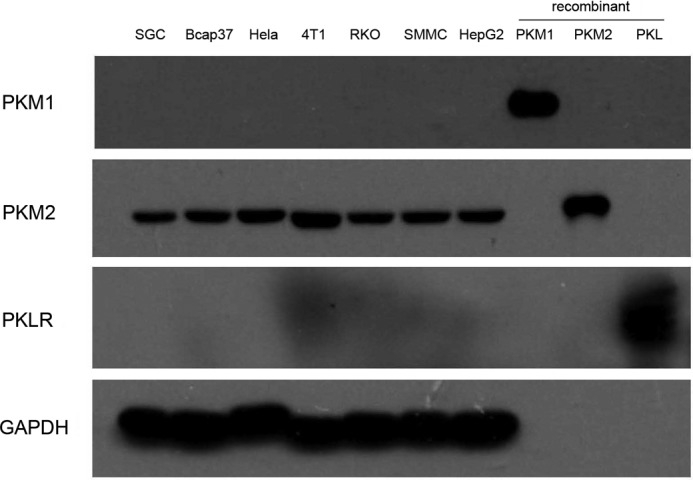
Immunoblot analyses for PKM1, PKM2, and PKLR in the lysates of SGC7901, Bcap37, HeLa, 4T1, RKO, SMMC7721, and HepG2 cells and recombinant PKM1, PKM2, and PKL were used as positive control. The amount of cell lysate protein was 10 μg and recombinant protein was 2 μg. The experiments were repeated two times.
FIGURE 2.
Activities of glycolytic enzymes in seven cancer cell lines. A, specific enzyme activities. The detailed measurement of enzyme activity is described under “Experimental Procedures” under the subtitle “Measurement of Enzyme Activities at Saturating Substrate Concentration.” B, activities of enzymes relative to HK. As the activity unit for all enzymes is expressed as nmol/mg of protein/min, we used the activity of HK to divide those of HK and other enzymes, and as such the relative activity of HK is 1. Data are means ± S.D., n = 3.
TABLE 1.
HK, PFK, and PK activities in clinical tumor samples
| Unit | Enzyme activity |
Tumor description | Refs. | ||
|---|---|---|---|---|---|
| HK | PFK | PK | |||
| Units/mg of protein | 0.076 ± 0.045 | 0.324 ± 0.158 | 1.94 ± 1.18 | B-CLL | 38 |
| Units/mg of protein | 0.006 ± 0.001 | 0.017 ± 0.002 | 0.773 ± 0.128 | Malignant cervix uteri | 39 |
| Units/g of protein | 30.3 ± 19.6 | 71.5 ± 45.5 | 1910 ± 2550 | Uterus cervix carcinoma | 40 |
| 28.1 ± 16.1 | 91.4 ± 61.4 | 1440 ± 1040 | Uterus endometrium carcinoma | ||
| Units/mg of protein | 0.052 ± 0.003 | 0.048 ± 0.003 | 0.977 ± 0.079 | Breast carcinomas | 41 |
| 0.032 ± 0.007 | 0.027 ± 0.008 | 0.455 ± 0.131 | Intraductal carcinoma | ||
| 0.064 ± 0.006 | 0.053 ± 0.005 | 1.118 ± 0.136 | Carcinoma with combined histology | ||
| 0.032 ± 0.007 | 0.033 ± 0.013 | 0.726 ± 0.256 | Lobular carcinoma | ||
| Units/mg of protein | 0.052 ± 0.003 | 0.048 ± 0.003 | 0.977 ± 0.079 | Primary breast cancer | 42 |
| 0.083 ± 0.007 | 0.065 ± 0.006 | 1.28 ± 0.182 | Metastatic breast cancer | ||
| mol/h/kg dry weight | 0.46 ± 0.20 | 0.23 ± 0.23 | 0.94 ± 0.53 | Malignant mammary tumor | 43 |
| Units/mg of protein | 0.032 ± 0.007 | \ | 1.54 ± 0.031 | Lung tumor | 44 |
| Units/mg of protein | 0.036 ± 0.023 | \ | 1.26 ± 0.084 | Neuroblastoma | 45 |
| Units/g of wet weight | 1.3 ± 0.2 | \ | 25.2 ± 4.2 | Primary malignant hepatoma | 46 |
| Units/mg of protein | 0.05–0.015 | \ | 2.88–0.84 | Retinoblastoma | 47 |
| Units/100 mg of tissue | 0.040 ± 0.005 | \ | 6.590 ± 0.630 | Infiltrating ductal breast carcinoma | 48 |
| Units/mg of DNA | 0.116 ± 0.01 | \ | 9.84 ± 0.64 | Infiltrating ductal carcinoma | 49 |
| Units/mg of protein | 0.025 ± 0.003 | \ | 0.95 ± 0.14 | All human breast cancer tissues | 50 |
| 0.028 ± 0.005 | \ | 1.23 ± 0.2 | Primary breast cancer | ||
| 0.019 ± 0.003 | \ | 0.66 ± 0.06 | Metastatic breast cancer | ||
| 0.015 ± 0.004 | \ | 0.38 ± 0.07 | Chest wall | ||
| 0.010 ± 0.006 | \ | 0.56 ± 0.06 | Lung | ||
| 0.032 ± 0.018 | \ | 1.45 ± 0.64 | Lymphoma | ||
| 0.0144 | \ | 1.24 | Bone | ||
| 0.021 ± 0.010 | \ | 0.25 ± 0.13 | Brain | ||
| 0.014 | \ | 1.24 | Liver | ||
| 0.021 ± 0.006 | \ | 0.70 ± 0.09 | Lymph node | ||
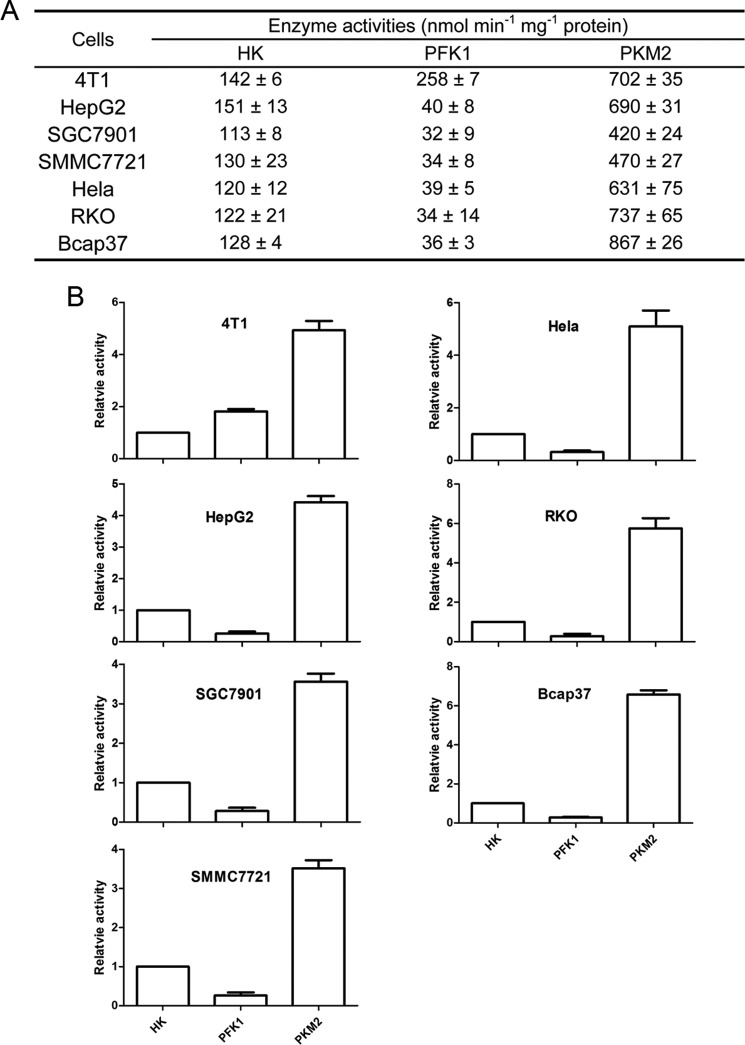
Nevertheless, the above measurement of enzyme activities was carried out under the condition of saturating substrate concentration. It was necessary to measure the actual enzyme activities under physiological substrate concentrations. We then measured the concentration of glucose, Fru-6-P, PEP, and pyruvate in the tested cancer cells (Table 2), and the enzyme activities according to the substrate concentration in the cancer cells (Fig. 3). PKM2 activities even under physiological PEP concentrations were 3.5–6.6-fold higher than HK and 2.7–24.1-fold higher than PFK1 (Fig. 3).
FIGURE 3.
Activities of HK, PFK1, and PKM2 assayed according to the substrate concentration in cancer cells. A, actual activities of enzymes. The measurement of enzyme activity is described under “Experimental Procedures” under the subtitle “Measurement of Enzyme Activities at Physiological Substrate Concentration.” B, activities of PKM2 or PFK1 relative to HK, which is defined as 1. Data are means ± S.D., n = 3.
The catalytic rate of HK may represent the maximal glycolytic rate, but the actual glycolytic rates of cancer cells were lower than the HK rate (Fig. 4). As a result, the activities of PKM2 in cancer cells at physiological concentration of PEP are many fold higher than the actual glycolytic rates (Fig. 4).
FIGURE 4.
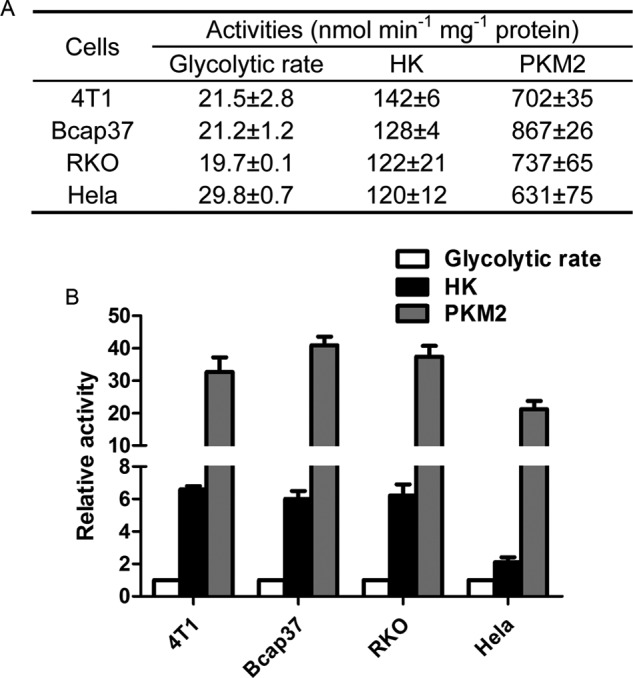
Actual glycolytic rates of live cancer cells in comparison with the catalytic rates of HK and PKM2. A, glycolytic rates of live cancer cells were measured as described under “Experimental Procedures” under the subtitle “Glucose Consumption and Lactate Generation.” Catalytic rates of HK and PKM2 were taken from Fig. 3. B, catalytic rates of HK and PKM2 relative to actual glycolytic rates of live cancer cells, where glycolytic rates of live cancer cells were defined as 1. Data are mean ± S.D., n = 3.
The second key question is as follows. If PKM2-catalyzed reaction is a rate-limiting step in glycolysis, the activity of PKM2 should be jump between x and y (x denotes the actual glycolytic rates in cancer cells, and y denotes the actual activities of PKM2, e.g. for 4T1, x and y are 21.5 and 702 nmol min−1 mg−1 protein, respectively, Fig. 4A). According to the general principle of metabolic flux control, this change magnitude of enzyme activity seems far too large for an enzyme to function as a rate-limiting enzyme.
The activity of PKM2 is sensitive to regulation (32). The most potent allosteric regulator is FBP, which tetramerizes four subunits of PKM2 and the tetramer is the form with high activity; without FBP, PKM2 molecules dissociate to a dimer, which is a form with low activity. The Vmax of PKM2 dimer and tetramer is comparable, but the Km value of the dimer and tetramer toward PEP is 0.5 and 0.03 mm, respectively (33). Under physiological PEP concentrations, in the tested cancer cells, if all the molecules of PKM2 were tetramer, its catalytic rate would be 2.7–3.6-fold higher than if all the enzyme molecules were dimer (Fig. 5A). The subsequent questions then are as follows. Are the catalytic rates of PKM2 dimer and tetramer lower and higher, respectively, than the overall glycolytic rate? Could this regulation possibly limit the rate at this step?
FIGURE 5.
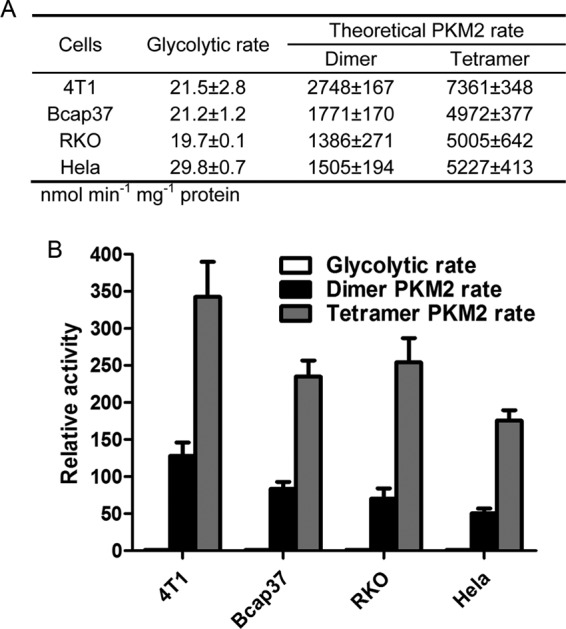
Actual glycolytic rates of live cancer cells in comparison with the theoretical catalytic rates of PKM2 dimer and tetramer. A, glycolytic rates of live cancer cells were described under “Experimental Procedures.” Theoretical catalytic rates were calculated according to Michaelis-Menten equation, using the Vmax from Fig. 2, and Km values 0.03 mm (tetramer) and 0.5 mm (dimer) from Ref. 33. B, catalytic rates of PKM2 dimer and tetramer relative to actual glycolytic rates of live cancer cells. Data are mean ± S.D., n = 3.
In fact, when we measured PKM2 activities, we did not add FBP into the assay system. Under such conditions, most PKM2 molecules should be dimers. Indeed, the Km value of PKM2 in the tested cancer cells, except 4T1 PKM2, were 0.46–0.61 mm (Fig. 6), which were similar to the reported value of the PKM2 dimer (33). The Km value of 4T1 PKM2 was 0.13 mm, although significantly lower than that of enzymes from other cell lines, and about 4-fold higher than that of dimeric Km. We do not know why PKM2 from 4T1 has a lower Km value, but probably it is because 4T1 is a mouse cancer cell line and others are all human cancer cell lines. To objectively assess whether the fluctuation of PKM2 activity can possible play a part in rate-limiting, we compared the actual glycolytic rate of the tested cancer cells with the calculated rate of PKM2 in tested cells. The comparison led to the conclusion that even if all molecules of PKM2 were dimers, the activities were 50–128-fold higher than the actual glycolytic rate in the tested cancer cells (Fig. 5B); if all molecules of PKM2 were tetramers, the activities were 175–342-fold higher than those of the actual glycolytic rates in the tested cancer cells, indicating that, no matter whether tetramer or dimer, the activities of PKM2 were far higher than the overall glycolytic rate, i.e. the regulation range of PKM2 activity by FBP unlikely makes the enzyme-catalyzed reaction a rate-limiting step in cancer cell glycolysis. Although the activity of PKM2 can be subjected to many regulations (1, 3–5, 7–9, 32, 34, 35), these regulations are less potent than FBP, and hence are less likely to make this reaction a rate-limiting step.
FIGURE 6.
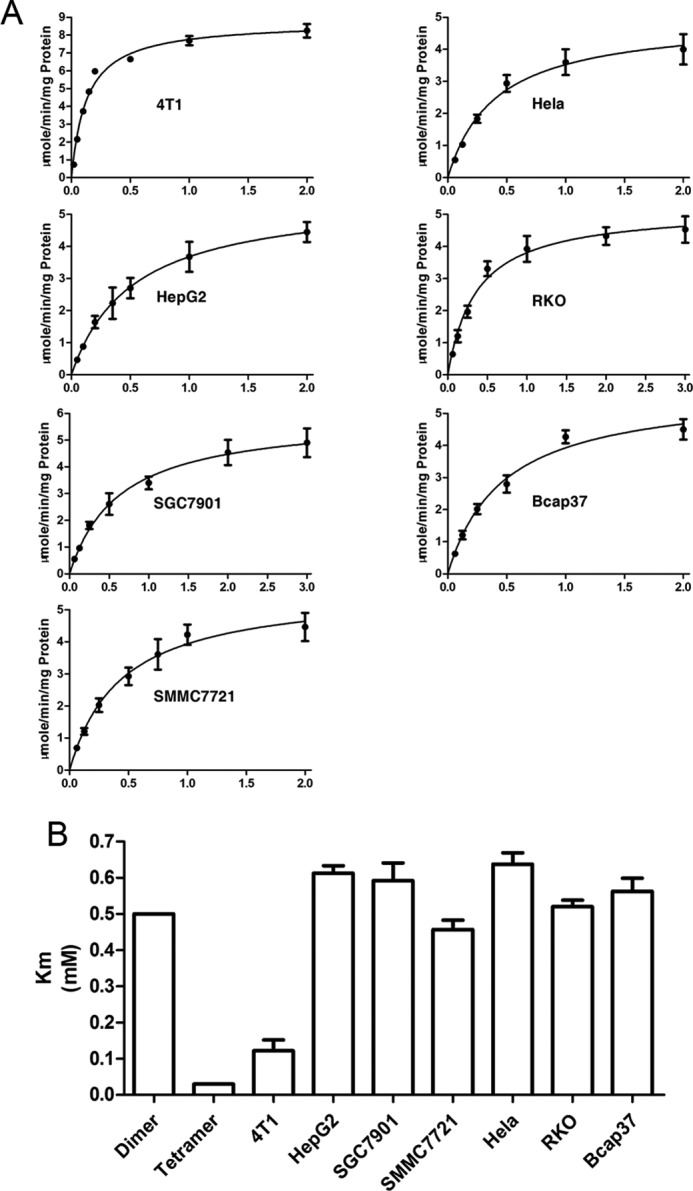
Determination of Km values of PKM2 in cancer cells. A, Km values derived from the relationship between the initial velocity of each enzyme with the varying substrate concentrations. B, Km values of PKM2 in cancer cells, in comparison with reported Km values of dimeric or tetrameric PKM2. Data are means ± S.D., n = 3.
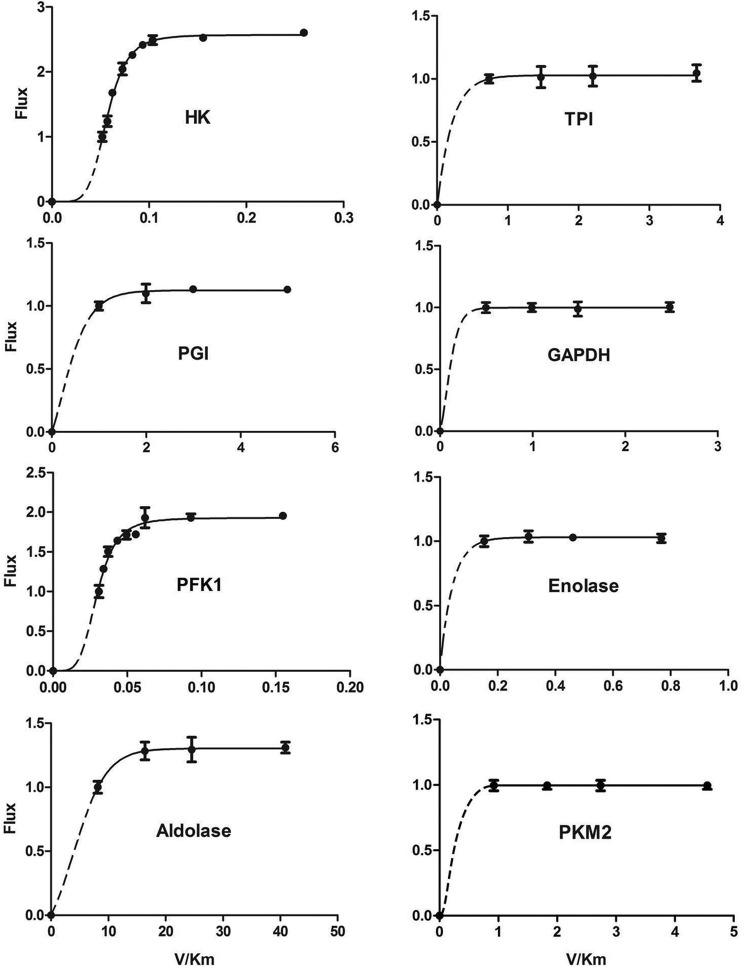
We then did metabolic flux analysis. The results were in our expectations (Fig. 7). HK was the major rate-limiting enzyme, followed by PFK1. Aldolase and PGI exerted a minor rate-limiting effect on glycolysis. Other glycolytic enzymes, including PKM2, have no detectable rate-limiting effect on glycolysis. The results of metabolic flux assay excellently match the results of the relative activities of enzymes.
FIGURE 7.
Contribution of each glycolytic enzyme to rate-limiting of glycolysis. The measurement of the effect of each glycolytic enzyme on glycolytic rate is described under “Experimental Procedures” under the subtitle “In vitro Glycolytic System and Metabolic Flux Control Assay.” Data are means ± S.D., n = 3.
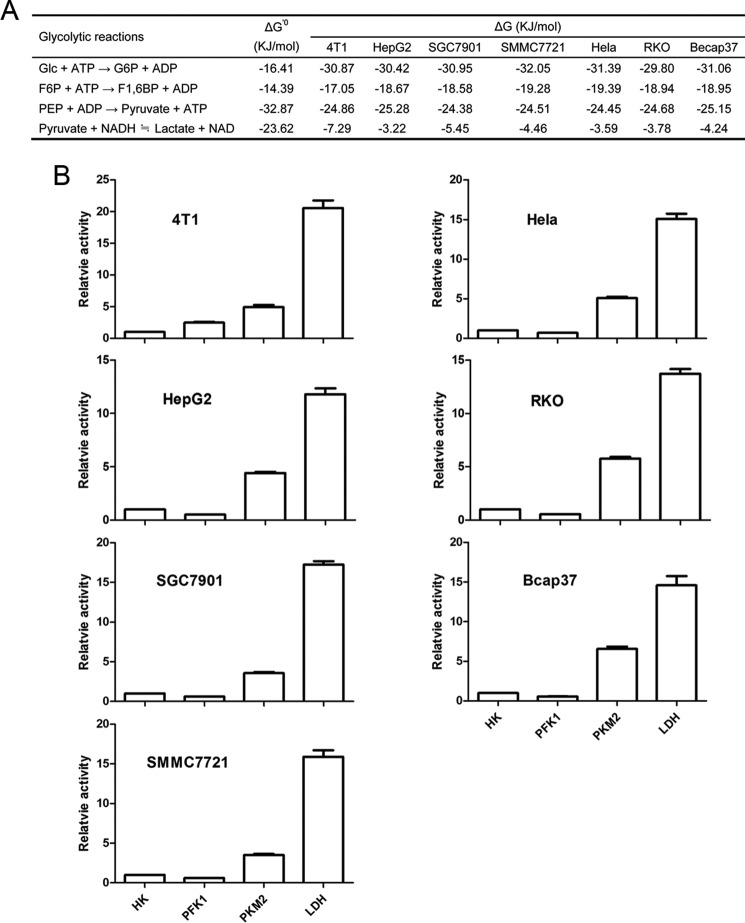
It would be worthwhile to discuss the change of Gibbs free energy accompanied by the reaction catalyzed by PKM2. The standard change of Gibbs free energy of this reaction is −32.87 kJ/mol, and the actual changes of Gibbs free energy of this reaction in tested cancer cells are −25.28 to −24.38 kJ/mol (Fig. 8A). A reaction with such a large change in the Gibbs free energy in a metabolic pathway is commonly considered as a rate-limiting step, but the prerequisite condition is that the catalytic capacity of the corresponding enzyme that catalyzes this reaction should be low in comparison with other enzymes along the metabolic pathway, and the regulation range of its activity should make its catalytic rate fluctuate around the overall rate of the pathway. As the PKM2-catalyzed rate is far higher than the actual glycolytic rate of cancer cells, the regulation of PKM2 activity would hardly exert a significant impact on the overall rate of glycolysis. As such, the large change of the Gibbs free energy of the reaction catalyzed by the quite excessive catalytic capacity of PKM2 (both low and high catalytic form) drives PEP from the upstream glycolytic flux unconditionally, rapidly, and effectively to pyruvate, i.e. we cannot perceive a biochemical basis that the PKM2-catalyzed reaction can be lower than the upstream rate so that PEP and its upstream intermediates can accumulate. Therefore, PKM2 is unlikely a rate-limiting enzyme, and hence its catalyzed reaction is unlikely a rate-limiting step in cancer cell glycolysis. By contrast, the large change of the Gibbs free energy of the reactions catalyzed by HK and PFK1 (Fig. 8A), the low activities of HK and PFK1 relative to other glycolytic enzymes (Figs. 2 and 3), and their sensitivity to allosteric regulation (36, 37) make them perfect rate-limiting enzymes.
FIGURE 8.
Gibbs free energy change in cancer cells and the relative activities of PFK1, PKM2, and LDH to HK at physiological substrate concentrations. A, standard and actual change of Gibbs free energy in cancer cells. The standard change of Gibbs free energy ΔG′0298 K is from Ref. 30; the actual change of Gibbs free energy ΔG is calculated as described as “Experimental Procedures.” B, activities of enzymes relative to HK, which is defined as 1. Data are mean ± S.D., n = 3.
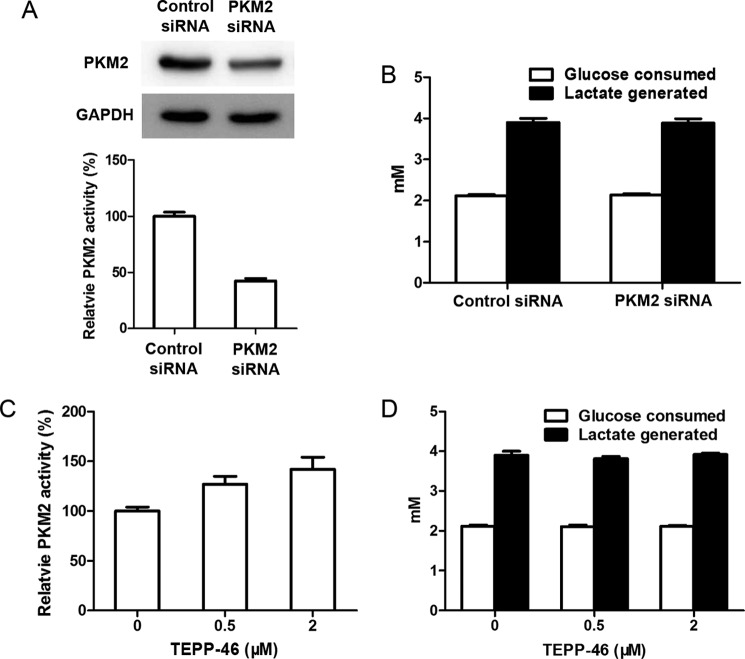
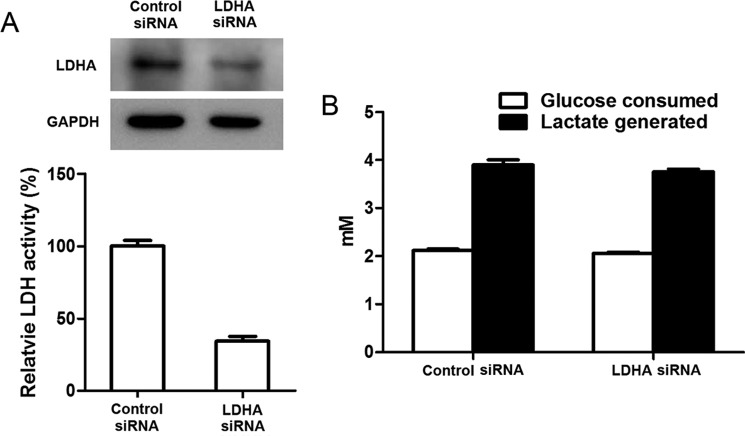
We then carried out additional experiments to provide additional proof. After knocking down PKM2, the amount and activity of this enzyme reduced significantly, but glucose consumption and lactate generation in cells did not decrease significantly (Fig. 9, A and B). Conversely, after the cells were treated with the PKM2 activator, despite a significant enhanced activity of PK, glucose consumption and lactate generation remained nearly unchanged in comparison with control cells (Fig. 9, C and D). LDHA knockdown did not significantly affect glucose consumption and lactate generation (Fig. 10).
FIGURE 9.
Regulation of PKM2 activity does not significantly affect the rates of glucose consumption and lactate generation by intact 4T1 cells. A, PKM2 siRNA transfection significantly reduced the amount and activity of PKM2. 4T1 cells were transiently transfected with PKM2 siRNA or negative control siRNA for 72 h; cells were collected and lysed; the cell lysates were subjected to Western blot and enzyme assay for PKM2. B, PKM2 siRNA transfection did not significantly decrease glucose consumption and lactate generation. Cells were incubated in fresh culture medium for further 5 h; the concentrations of glucose and lactate in culture medium were determined, and then glucose consumption and lactate generation were calculated. C, PKM2 activator TEPP-46 significantly enhanced PKM2 activity. 4T1 cells were treated with 0.5 or 2 μm TEPP-46 or not for 5 h; cells were collected and lysed; PKM2 activity in cell lysate was determined. D, TEPP-46 did not significantly increase glucose consumption and lactate generation. 4T1 cells were incubated in fresh culture medium containing 0, 0.5, or 2 μm TEPP-46 for 5 h; the concentrations of glucose and lactate in culture medium were determined. The detailed procedure of siRNA knockdown, Western blot, PKM2 enzyme activity assay, and determination of glucose and lactate is described under “Experimental Procedures.” Data are mean ± S.D., n = 4.
FIGURE 10.
Down-regulation of LDH does not significantly affect the rates of glucose consumption and lactate generation by intact 4T1 cells. A, LDHA siRNA transfection significantly reduced the amount and activity of LDH. 4T1 cells were transiently transfected with LDHA siRNA or negative control siRNA for 72 h; cells were collected and lysed; the cell lysate was subjected for Western blot and enzyme assay for LDH. B, LDHA siRNA transfection did not significantly decrease glucose consumption and lactate generation. Cells were incubated in fresh culture medium for a further 5 h; the concentrations of glucose and lactate in culture medium were determined, and then glucose consumption and lactate generation were calculated. The detailed procedure of siRNA knockdown, Western blot, LDH enzyme activity assay, and determination of glucose and lactate is described under “Experimental Procedures.” Data are means ± S.D., n = 4.
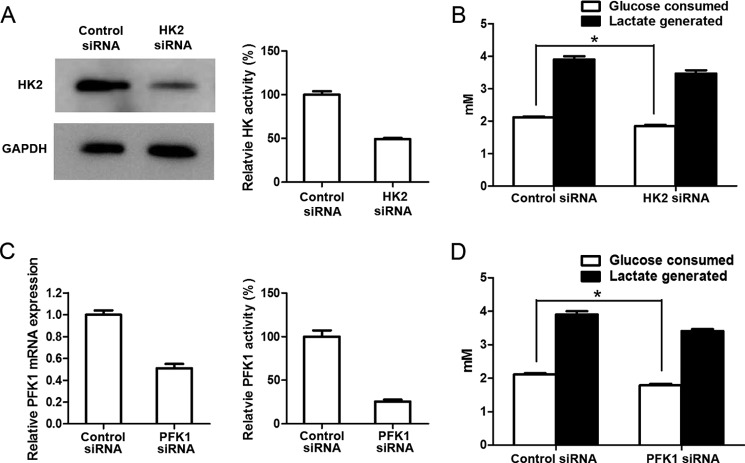
In contrast, knocking down HK2 and PFK1 significantly reduced glucose consumption and lactate generation (Fig. 11). Nevertheless, given the large change of HK activity (reduced by 50%) and PFK1 activity (reduced by 75%), the reduction of glucose consumption and lactate generation is much smaller than expected. The in vitro assay (Fig. 7) indicated that glycolysis was very sensitive to the change of HK or PFK1 activity. Thus, the results suggest a need to further study the rate control of glycolysis in intact cells.
FIGURE 11.
Down-regulation of HK and PFK1 significantly decreases glucose consumption and lactate generation by 4T1 cells. A, HK2 siRNA transfection significantly reduced the amount and activity of HK. 4T1 cells were transiently transfected with HK2 siRNA or negative control siRNA for 72 h; cells were collected and lysed; and the cell lysates were subjected for Western blot and enzyme assay for HK. B, HK2 siRNA transfection significantly decreased glucose consumption and lactate generation. Cells were incubated in culture medium for a further 5 h; the concentrations of glucose and lactate in culture medium were determined, and then glucose consumption and lactate generation were calculated. C, PFK1 siRNA transfection significantly reduced the amount and activity of PFK1. 4T1 cells were transiently transfected with PFK1 siRNA or negative control siRNA for 48 h; RNA was extracted and subjected to real time PCR determination of PFK1; enzyme assay for PFK1 activity was carried 72 h after siRNA transfection. D, PFK1 siRNA transfection significantly decreased glucose consumption and lactate generation. Cells were incubated in fresh culture medium for further 5 h; the concentrations of glucose and lactate in culture medium were determined, and then glucose consumption and lactate generation were calculated. The detailed procedure of siRNA knockdown, Western blot, enzyme activity assay, and determination of glucose and lactate is described under “Experimental Procedures.” Data are mean ± S.D., n = 4.
In addition, we determined the concentrations of FBP, PEP, and pyruvate in intact cells (Fig. 12) to see whether alteration of activities of HK, PFK1, PKM2, and LDH would also change the intermediate concentration. Knocking down HK2 or PFK1 in 4T1 cells significantly decreased the concentration of FBP, but it did not alter the concentration of PEP and pyruvate. Knocking down PKM2 did not significantly reduce the concentrations of FBP and pyruvate, but slightly elevated PEP concentration by 2%. TEPP-46 (an activator of PKM2) treatment decreased FBP by 8% and increased pyruvate by 11%. Knocking down LDHA did not significantly alter the concentration of FBP but elevated PEP and pyruvate by 23 and 47%, respectively. When considering the effect of these enzymes on glycolysis (Figs. 9–11), it seems that the concentration change of these intermediates is not necessarily associated with the rate change of glycolysis.
FIGURE 12.
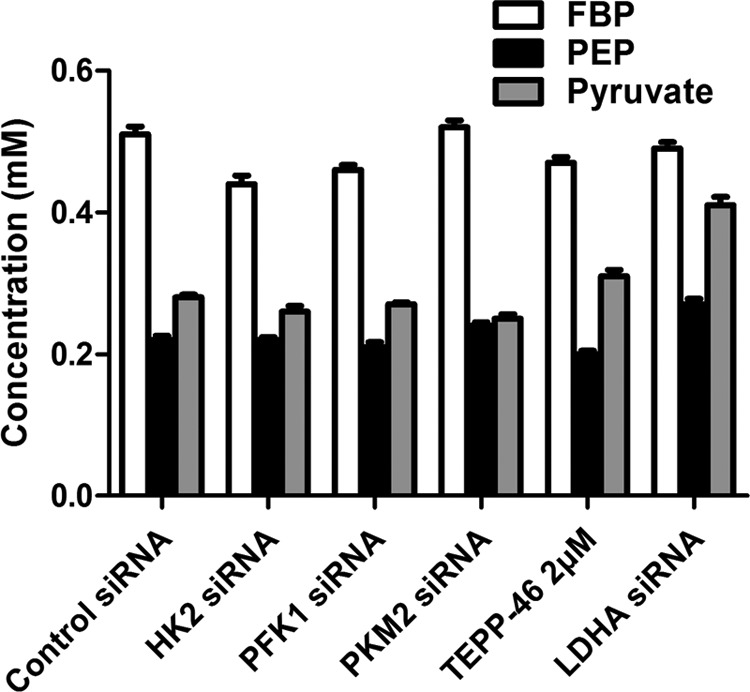
Concentrations of FBP, PEP, and pyruvate in intact 4T1 cells with or without HK2, PFK1, PKM2, or LDHA siRNA transfection or with or without TEPP-46 treatment. The conditions of cell culture, transfection, or treatment with TEPP-46 were the same as described in Figs. 9–11. Cells were washed twice with ice-cold PBS and lysed with 0.6 m HClO4 and neutralized with 3 m K2CO3, and then the intermediates were measured as described under “Experimental Procedures.” Data are mean ± S.D., n = 3.
The intermediate determination raises several biochemical issues, e.g. it is understandable that LDHA knockdown elevated the concentration of pyruvate, but it is beyond our understanding that LDHA knockdown also significantly elevated the concentration of PEP. Does it imply that PKM2-catalyzed reaction is at near equilibrium state, so that elevation of pyruvate caused elevation of PEP? Such an interpretation is of course incorrect, because the Keq of this reaction is 2 × 10⁴, and if it is approaching an equilibrium state, the concentration of pyruvate would reach the molar range, wreaking osmotic havoc. Hence, this is a puzzle to be resolved.
Alteration of enzyme activities of HK or PFK1 altered overall glycolytic rates in intact cells and also lowered the concentration of FBP. However, alteration of enzyme activities of PKM2 and LDH did not alter the overall glycolytic rates in intact cells, but it could alter the concentrations of FBP, PEP, or pyruvate. As the overall glycolytic rate is not changed, the alteration of PKM2 and LDH activities should not change the overall metabolic fate of glucose. Nevertheless, there should be some meaning of these changes, but so far, based on the available data, we are not able to plausibly interpret what the concentration fluctuation of these intermediates associated with the activity change of PKM2 and LDH implies.
Then, what is the possible role of PKM2 in glycolysis? Because no matter whether a tetramer or dimer, the catalytic capacity of PKM2 in cancer cells is far higher than the actual glycolytic rate; and a reasonable interpretation is that it is for the rapid removal of PEP to prevent accumulation of upstream glycolytic intermediates. To avoid the accumulation of pyruvate, cancer cells also express excessive LDH (Figs. 2 and 8B), which rapidly converts pyruvate to lactate. It should be noted that the standard change of Gibbs free energy of the LDH-catalyzed reaction is −23.62 kJ/mol, and in cancer cells, as the mass action ratio is smaller than the equilibrium constant, the actual change of Gibbs free energy is −7.29 to −3.22 kJ/mol (Fig. 8A), which is sufficient to drive this reaction from pyruvate to lactate. In fact, most cancer cells produce a quantity of lactate, converting 80–90% of incoming glucose to lactate, even with ample oxygen.
Taken together, the results suggest that PKM2 and LDH, the last two enzymes in the pathway, are probably for the fast removal of upstream intermediates to prevent the obstruction of the pathway. In addition, the pattern of activities of glycolytic enzymes in cancer cells and the thermodynamics of the reactions laid the fundamental biochemical basis for the Warburg effect.
Author Contributions
X. H. conceived the concept and designed the study; J. X. and C. D. performed the experiments; X. H., J. X., and C. D. analyzed the data; J. X. and C. D. drew the graphs; and X. H. wrote the paper.
This work was supported in part by China National 973 Project 2013CB911303, China Natural Sciences Foundation Projects 81272456 and 81470126, and the Fundamental Research Funds for the Central Universities, National Ministry of Education, China (to X. H.). The authors declare that they have no conflicts of interest with the contents of this article.
- PEP
- phosphoenolpyruvate
- HK
- hexokinase
- LDH
- lactate dehydrogenase
- Fru-6-P
- fructose 6-phosphate
- FBP
- fructose 1,6-bisphosphate
- GA3P
- glyceraldehyde 3-phosphate
- 3PG
- 3-phosphoglycerate
- 2PG
- 2-phosphoglycerate
- HK2
- hexokinase 2
- PGI
- phosphohexose isomerase
- TPI
- triose-phosphate isomerase
- LDHA
- lactate dehydrogenase A
- α-GPDH
- α-glycerophosphate dehydrogenase.
References
- 1. Christofk H. R., Vander Heiden M. G., Harris M. H., Ramanathan A., Gerszten R. E., Wei R., Fleming M. D., Schreiber S. L., and Cantley L. C. (2008) The M2 splice isoform of pyruvate kinase is important for cancer metabolism and tumour growth. Nature 452, 230–233 [DOI] [PubMed] [Google Scholar]
- 2. Wong C. C., Au S. L., Tse A. P., Xu I. M., Lai R. K., Chiu D. K., Wei L. L., Fan D. N., Tsang F. H., Lo R. C., Wong C. M., and Ng I. O. (2014) Switching of pyruvate kinase isoform L to M2 promotes metabolic reprogramming in hepatocarcinogenesis. PLoS ONE 9, e115036. [DOI] [PMC free article] [PubMed] [Google Scholar]
- 3. Mellati A. A., Yücel M., Altinörs N., and Gündüz U. (1992) Regulation of M2-type pyruvate kinase from human meningioma by allosteric effectors fructose 1,6 diphosphate and l-alanine. Cancer Biochem. Biophys. 13, 33–41 [PubMed] [Google Scholar]
- 4. Christofk H. R., Vander Heiden M. G., Wu N., Asara J. M., and Cantley L. C. (2008) Pyruvate kinase M2 is a phosphotyrosine-binding protein. Nature 452, 181–186 [DOI] [PubMed] [Google Scholar]
- 5. Anastasiou D., Poulogiannis G., Asara J. M., Boxer M. B., Jiang J. K., Shen M., Bellinger G., Sasaki A. T., Locasale J. W., Auld D. S., Thomas C. J., Vander Heiden M. G., and Cantley L. C. (2011) Inhibition of pyruvate kinase M2 by reactive oxygen species contributes to cellular antioxidant responses. Science 334, 1278–1283 [DOI] [PMC free article] [PubMed] [Google Scholar]
- 6. Anastasiou D., Yu Y., Israelsen W. J., Jiang J. K., Boxer M. B., Hong B. S., Tempel W., Dimov S., Shen M., Jha A., Yang H., Mattaini K. R., Metallo C. M., Fiske B. P., Courtney K. D., et al. (2012) Pyruvate kinase M2 activators promote tetramer formation and suppress tumorigenesis. Nat. Chem. Biol. 8, 839–847 [DOI] [PMC free article] [PubMed] [Google Scholar]
- 7. Keller K. E., Tan I. S., and Lee Y. S. (2012) SAICAR stimulates pyruvate kinase isoform M2 and promotes cancer cell survival in glucose-limited conditions. Science 338, 1069–1072 [DOI] [PMC free article] [PubMed] [Google Scholar]
- 8. Zhao D., Zou S. W., Liu Y., Zhou X., Mo Y., Wang P., Xu Y. H., Dong B., Xiong Y., Lei Q. Y., and Guan K. L. (2013) Lysine-5 acetylation negatively regulates lactate dehydrogenase A and is decreased in pancreatic cancer. Cancer Cell 23, 464–476 [DOI] [PMC free article] [PubMed] [Google Scholar]
- 9. Chaneton B., Hillmann P., Zheng L., Martin A. C., Maddocks O. D., Chokkathukalam A., Coyle J. E., Jankevics A., Holding F. P., Vousden K. H., Frezza C., O'Reilly M., and Gottlieb E. (2012) Serine is a natural ligand and allosteric activator of pyruvate kinase M2. Nature 491, 458–462 [DOI] [PMC free article] [PubMed] [Google Scholar]
- 10. Cairns R. A., Harris I. S., and Mak T. W. (2011) Regulation of cancer cell metabolism. Nat. Rev. Cancer 11, 85–95 [DOI] [PubMed] [Google Scholar]
- 11. Ward P. S., and Thompson C. B. (2012) Metabolic reprogramming: a cancer hallmark even Warburg did not anticipate. Cancer Cell 21, 297–308 [DOI] [PMC free article] [PubMed] [Google Scholar]
- 12. Chen J., Xie J., Jiang Z., Wang B., Wang Y., and Hu X. (2011) Shikonin and its analogs inhibit cancer cell glycolysis by targeting tumor pyruvate kinase-M2. Oncogene 30, 4297–4306 [DOI] [PubMed] [Google Scholar]
- 13. Bueding E., and Mackinnon J. A. (1955) Studies of the phosphoglucose isomerase of Schistosoma mansoni. J. Biol. Chem. 215, 507–513 [PubMed] [Google Scholar]
- 14. Cowgill R. W., and Pizer L. I. (1956) Purification and some properties of phosphorylglyceric acid mutase from rabbit skeletal muscle. J. Biol. Chem. 223, 885–895 [PubMed] [Google Scholar]
- 15. Deng H., Yu F., Chen J., Zhao Y., Xiang J., and Lin A. (2008) Phosphorylation of Bad at Thr-201 by JNK1 promotes glycolysis through activation of phosphofructokinase-1. J. Biol. Chem. 283, 20754–20760 [DOI] [PMC free article] [PubMed] [Google Scholar]
- 16. Ferdinand W. (1964) The isolation and specific activity of rabbit-muscle glyceraldehyde phosphate dehydrogenase. Biochem. J. 92, 578–585 [DOI] [PMC free article] [PubMed] [Google Scholar]
- 17. Gracy R. W., Lacko A. G., and Horecker B. L. (1969) Subunit structure and chemical properties of rabbit liver aldolase. J. Biol. Chem. 244, 3913–3919 [PubMed] [Google Scholar]
- 18. Ikeda Y., and Noguchi T. (1998) Allosteric regulation of pyruvate kinase M2 isozyme involves a cysteine residue in the intersubunit contact. J. Biol. Chem. 273, 12227–12233 [DOI] [PubMed] [Google Scholar]
- 19. Pagliaro L., Kerr K., and Taylor D. L. (1989) Enolase exists in the fluid phase of cytoplasm in 3T3 cells. J. Cell Sci. 94, 333–342 [DOI] [PubMed] [Google Scholar]
- 20. Plaut B., and Knowles J. R. (1972) pH dependence of the triose-phosphate isomerase reaction. Biochem. J. 129, 311–320 [DOI] [PMC free article] [PubMed] [Google Scholar]
- 21. Scopes R. K. (1969) Crystalline 3-phosphoglycerate kinase from skeletal muscle. Biochem. J. 113, 551–554 [DOI] [PMC free article] [PubMed] [Google Scholar]
- 22. Sekine N., Cirulli V., Regazzi R., Brown L. J., Gine E., Tamarit-Rodriguez J., Girotti M., Marie S., MacDonald M. J., and Wollheim C. B. (1994) Low lactate dehydrogenase and high mitochondrial glycerol phosphate dehydrogenase in pancreatic beta-cells. Potential role in nutrient sensing. J. Biol. Chem. 269, 4895–4902 [PubMed] [Google Scholar]
- 23. Wilson J. E. (1968) Brain hexokinase. A proposed relation between soluble-particulate distribution and activity in vivo. J. Biol. Chem. 243, 3640–3647 [PubMed] [Google Scholar]
- 24. Bergmeyer H. U. (ed) (1974) Methods of Enzymatic Analysis, 2nd Ed., pp. 1196–1456, Verlag Chemie, Deerfield Beach, FL [Google Scholar]
- 25. Xie J., Wu H., Dai C., Pan Q., Ding Z., Hu D., Ji B., Luo Y., and Hu X. (2014) Beyond Warburg effect–dual metabolic nature of cancer cells. Sci. Rep. 4, 4927. [DOI] [PMC free article] [PubMed] [Google Scholar]
- 26. Burns J. A., Cornishbowden A., Groen A. K., Heinrich R., Kacser H., Porteous J. W., Rapoport S. M., Rapoport T. A., Stucki J. W., Tager J. M., Wanders R. J. A., and Westerhoff H. V. (1985) Control analysis of metabolic systems. Trends Biochem. Sci. 10, 16–16 [Google Scholar]
- 27. Torres N. V., Mateo F., Riol-Cimas J. M., and Meléndez-Hevia E. (1990) Control of glycolysis in rat liver by glucokinase and phosphofructokinase: influence of glucose concentration. Mol. Cell. Biochem. 93, 21–26 [DOI] [PubMed] [Google Scholar]
- 28. Alberty R. A. (2006) Biochemical thermodynamics: applications of Mathematica. Methods Biochem. Anal. 48, 1–458 [PubMed] [Google Scholar]
- 29. Méndez E. (2008) Biochemical thermodynamics under near physiological conditions. Biochem. Mol. Biol. Educ. 36, 116–119 [DOI] [PubMed] [Google Scholar]
- 30. Nelson D. L., and Cox M. M. (2005) Lehninger Principles of Biochemistry. 4th Ed., W. H. Freeman, New York [Google Scholar]
- 31. Li X., Wu F., Qi F., and Beard D. A. (2011) A database of thermodynamic properties of the reactions of glycolysis, the tricarboxylic acid cycle, and the pentose phosphate pathway. Database 10.1093/database/bar005 [DOI] [PMC free article] [PubMed] [Google Scholar]
- 32. Mazurek S. (2011) Pyruvate kinase type M2: a key regulator of the metabolic budget system in tumor cells. Int. J. Biochem. Cell Biol. 43, 969–980 [DOI] [PubMed] [Google Scholar]
- 33. Mazurek S. (2007) Pyruvate kinase type M2: a key regulator within the tumour metabolome and a tool for metabolic profiling of tumours. Ernst Schering Found. Symp. Proc. 2007;(4):99–124 [DOI] [PubMed] [Google Scholar]
- 34. Hitosugi T., Kang S., Vander Heiden M. G., Chung T. W., Elf S., Lythgoe K., Dong S., Lonial S., Wang X., Chen G. Z., Xie J., Gu T. L., Polakiewicz R. D., Roesel J. L., Boggon T. J., et al. (2009) Tyrosine phosphorylation inhibits PKM2 to promote the Warburg effect and tumor growth. Sci. Signal. 2, ra73. [DOI] [PMC free article] [PubMed] [Google Scholar]
- 35. Olavarría J. S., Artacho E., Sánchez F., Martínez P., and Núñez de Castro I. (1986) Synergistic effect of ammonium and potassium ions on pyruvate kinase from Ehrlich ascites tumor cells. Enzyme 35, 34–41 [DOI] [PubMed] [Google Scholar]
- 36. Gregoriou M., Trayer I. P., and Cornish-Bowden A. (1986) Allosteric character of the inhibition of rat-muscle hexokinase B by Glc-6-P. Eur. J. Biochem. 161, 171–176 [DOI] [PubMed] [Google Scholar]
- 37. Tornheim K., and Lowenstein J. M. (1976) Control of phosphofructokinase from rat skeletal muscle. Effects of fructose diphosphate, AMP, ATP, and citrate. J. Biol. Chem. 251, 7322–7328 [PubMed] [Google Scholar]
- 38. Kraaijenhagen R. J., de Gast G. C., van der Heijden M. C., Streefkerk M., Gmelig-Meyling F. H., Rijksen G., and Staal G. E. (1982) Isozyme distribution of hexokinase, phosphofructokinase and pyruvate kinase in lymphocytes from patients with chronic lymphocytic leukemia. Clin. Chim. Acta 124, 91–101 [DOI] [PubMed] [Google Scholar]
- 39. Pedersen S. N. (1975) The glycolytic enzyme activity of the human cervix uteri. Cancer 35, 469–474 [DOI] [PubMed] [Google Scholar]
- 40. Marshall M. J., Goldberg D. M., Neal F. E., and Millar D. R. (1978) Enzymes of glucose metabolism in carcinoma of the cervix and endometrium of the human uterus. Br. J. Cancer 37, 990–1001 [DOI] [PMC free article] [PubMed] [Google Scholar]
- 41. Hennipman A., Smits J., van Oirschot B., van Houwelingen J. C., Rijksen G., Neyt J. P., Van Unnik J. A., and Staal G. E. (1987) Glycolytic enzymes in breast cancer, benign breast disease and normal breast tissue. Tumour Biol. 8, 251–263 [DOI] [PubMed] [Google Scholar]
- 42. Hennipman A., van Oirschot B. A., Smits J., Rijksen G., and Staal G. E. (1988) Glycolytic enzyme activities in breast cancer metastases. Tumour Biol. 9, 241–248 [DOI] [PubMed] [Google Scholar]
- 43. Larner E. H., and Rutherford C. L. (1978) Application of a microchemical technique to the elucidation of enzyme activity profiles within single human mammary tumors. Cancer 41, 1863–1870 [DOI] [PubMed] [Google Scholar]
- 44. Balinsky D., Greengard O., Cayanis E., and Head J. F. (1984) Enzyme activities and isozyme patterns in human lung tumors. Cancer Res. 44, 1058–1062 [PubMed] [Google Scholar]
- 45. Beemer F. A., Vlug A. M., Rousseau-Merck M. F., van Veelen C. W., Rijksen G., and Staal G. E. (1984) Glycolytic enzymes from human neuroectodermal tumors of childhood. Eur. J. Cancer Clin. Oncol. 20, 253–259 [DOI] [PubMed] [Google Scholar]
- 46. Balinsky D., Cayanis E., Geddes E. W., and Bersohn I. (1973) Activities and isoenzyme patterns of some enzymes of glucose metabolism in human primary malignant hepatoma. Cancer Res. 33, 249–255 [PubMed] [Google Scholar]
- 47. Beemer F. A., Vlug A. M., Rijksen G., Hamburg A., and Staal G. E. (1982) Characterization of some glycolytic enzymes from human retina and retinoblastoma. Cancer Res. 42, 4228–4232 [PubMed] [Google Scholar]
- 48. Hilf R., Goldenberg H., Michel I., Orlando R. A., and Archer F. L. (1970) Enzymes, nucleic acids, and lipids in human breast cancer and normal breast tissue. Cancer Res. 30, 1874–1882 [PubMed] [Google Scholar]
- 49. Hilf R., Wittliff J. L., Rector W. D., Savlov E. D., Hall T. C., and Orlando R. A. (1973) Studies on certain cytoplasmic enzymes and specific estrogen receptors in human breast cancer and in nonmalignant diseases of the breast. Cancer Res. 33, 2054–2062 [PubMed] [Google Scholar]
- 50. Balinsky D., Platz C. E., and Lewis J. W. (1984) Enzyme activities in normal, dysplastic, and cancerous human breast tissues. J. Natl. Cancer Inst. 72, 217–224 [PubMed] [Google Scholar]


