

Abstract
Purpose
Physical activity may reduce endogenous estrogens but few studies have assessed effects on estrogen metabolism and none have evaluated sedentary behavior in relation to estrogen metabolism. We assessed relationships between accelerometer-measured physical activity and sedentary behavior and 15 urinary estrogens and estrogen metabolites (EM) among postmenopausal controls from a population-based breast cancer case-control study conducted in Poland (2000-2003).
Methods
Postmenopausal women (N=542) were ages 40 to 72 years and not currently using hormone therapy. Accelerometers, worn for seven days, were used to derive measures of average activity (counts/day) and sedentary behavior (<100 counts/min/day). EM were measured in 12-hour urine samples using liquid chromatography-tandem mass spectrometry. EM were analyzed individually, in metabolic pathways (C-2, -4, or -16), and as ratios relative to parent estrogens. Geometric means of EM by tertiles of accelerometer-measures, adjusted for age and body mass, were computed using linear models.
Results
High activity was associated with lower levels of estrone and estradiol (p-trend=0.01) while increased sedentary time was positively associated with these parent estrogens (p-trend=0.04). Inverse associations were observed between high activity and 2-methoxyestradiol, 4-methoxyestradiol, 17-epiestriol and 16-epiestriol (p-trend=0.03). Sedentary time was positively associated with methylated catechols in the 2- and 4-hydroxylation pathways (p-trend≤0.04). Women in the highest tertile of activity had increased hydroxylation at the C-2, -4, and -16 sites relative to parent estrogens (p-trend≤0.02) while increased sedentary time was associated with a lower 16-pathway:parent estrogen ratio (p-trend=0.01).
Conclusions
Higher activity was associated with lower urinary estrogens, possibly through increased estrogen hydroxylation and subsequent metabolism, while sedentary behavior may reduce metabolism.
Keywords: accelerometers, physical activity, sedentary, estrogen metabolites
Introduction
Prior epidemiological studies suggest that higher levels of physical activity may reduce the risk of breast cancer (13, 37) and other chronic diseases (20); however, the mechanisms that account for the protective effect of physical activity are not well understood. While it has been postulated that physical activity may reduce levels of the circulating parent estrogens, estradiol and estrone (32), few studies have considered the influence of physical activity on estrogen metabolism (2, 4, 26, 27, 35), particularly among postmenopausal women (1, 27).
Endogenous estrogen formation among postmenopausal women mainly occurs in the adipose tissue via aromatization of adrenal androgens to estrone, the main circulating estrogen, which is subsequently metabolized by enzymes within the cytochrome P450 family (31, 40). Irreversible hydroxylation at the C2, C4, or C16 positions of estrone yields at least 13 estrogen metabolites (Figure 1) including 2-hydroxyestrone (2-OHE1) and 16α-hydroxyestrone (16α-OHE1). These two metabolites have been the focus of prior epidemiological studies due to the availability of a commercially available enzyme-linked immunoassay (3) as well as potential differences in their affinity for estrogen receptor binding (40). However, technological advances (39) facilitate the evaluation of additional metabolites within the C2, C4, and C-16 pathways, which are suggested to have different mutagenic, genotoxic, and proliferative activities (5). More specifically, further oxidation of the catechol estrogens (2-hydroxyestrone, 2-hydroxyestradiol, 4-hydroxyestrone, Figure 1) can lead to mutagenic quinone estrogens, while the methylation of these catechol estrogens, catalyzed by catechol-O-methyltransferase (COMT), can prevent the formation of these potentially DNA damaging derivatives. Estrogen metabolites within these various hydroxylation pathways may have differential associations with breast cancer risk (7, 11, 16) and with physical activity behaviors.
Figure 1. Estrogen metabolism pathways.
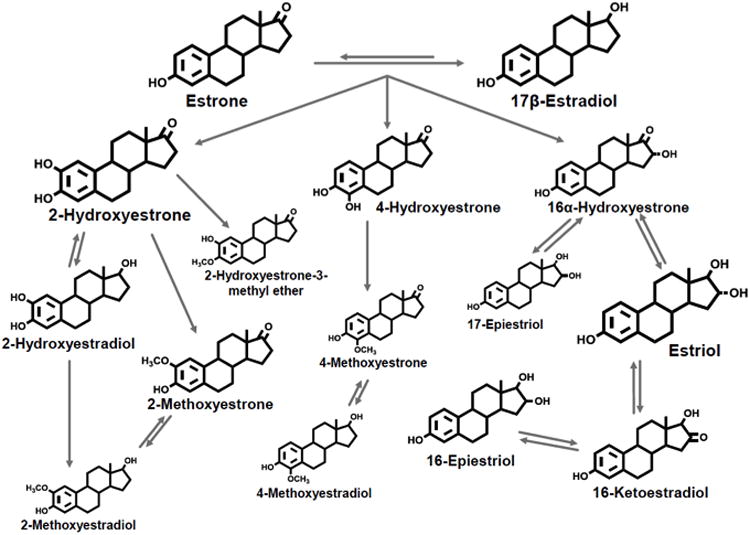
The size of the estrogen or estrogen metabolite represents their relative urinary concentration in postmenopausal women. Reproduced by kind permission from Cancer Epidemiology Biomarkers and Prevention from Fuhrman et al, 2012.
To date, only one cross-sectional study using self-reported measures of activity (27) and one prospective study of moderate intensity exercise (1) have examined the effects of activity on estrogen metabolism among postmenopausal women, with disparate results. Results from the cross-sectional analysis (27) suggest that physical activity may modify the adverse effect of adiposity on estrogen metabolism by increasing the 2-OHE1/16α-OHE1 ratio while the aerobic exercise intervention did not support changes in the levels of these specific estrogen metabolites (1). However, these studies were limited by small sample sizes, they only measured two metabolites, 2-OHE1 and 16α-OHE1, and relied on self-reported physical activity.
In addition to needing a more comprehensive understanding of the relation between activity and estrogen metabolism, the role of sedentary behavior on estrogen metabolism has yet to be determined. Emerging evidence suggests that increased time spent sedentary may lead to negative metabolic consequences (19), including increased central adiposity and higher endogenous estrogen levels (21). To our knowledge, no prior studies have assessed the relationship between sedentary behavior and estrogen metabolism among postmenopausal women. Here we present the first study to date to assess the role of accelerometer-measured physical activity and sedentary behavior on a comprehensive profile of 15 urinary estrogens and estrogen metabolites (EM) among postmenopausal women.
Materials and Methods
Study Design
Details of the NCI Polish Breast Cancer Case-Control Study have been described elsewhere (18). In brief, the NCI Polish Study is a population-based case-control study conducted among women 20-74 years of age, residing in Warsaw and Łódź, Poland from 2000 to 2003. The accelerometer component of the NCI Polish Study was restricted to the Warsaw site. Participants in this ancillary project included controls from the parent study, who were randomly selected from the Polish Electronic System, a database with demographic information from all Polish residents. Written informed consent was obtained from study participants. The study protocol was reviewed and approved by Institutional Review Boards at the U.S. National Cancer Institute (NCI) and the participating Polish institutions.
During home visits of all cases and controls, a trained interviewer obtained informed consent, administered a detailed questionnaire, obtained anthropometric measurements and collected a12-hour urine sample from participants. A wide range of factors was assessed, including demographic information, occupational history, medical and reproductive history, hormone use, and lifestyle factors. Women participating from the Warsaw site were also asked to wear an accelerometer on their waist for seven days and to complete a daily log to document monitor wear. Participants were instructed to wear the monitor during waking hours and to remove it while sleeping or engaging in activities such as bathing or swimming. Participants completed the 12-hour urine void within the same week as the monitor wear. Women were classified as postmenopausal if they reported no longer having menstrual periods at the time of the interview.
Eligibility criteria
Among controls from the Warsaw site (n=1588), 1089 were postmenopausal. Postmenopausal participants were considered eligible for this analysis if they provided consent to wear an accelerometer (n=921), had at least one valid day of monitor wear (i.e., 10 hours of wear) (n=788) and were not currently using exogenous hormones (n=662). Among women reporting former use of exogenous hormones, no one in our analytic sample reported any exogenous hormone use within the six months prior to urine collection. Women were excluded from the study based on the following criteria: no urine sample available (n=14), problems with the urine collection or processing (n=85) and more than seven days between the date of urine collection and the start of monitor wear (n=21). The final study population consisted of 542 postmenopausal women, ages 40 to 75 years.
Data Collection
Accelerometer Measures
The accelerometer (Actigraph 7164; Actigraph, LLC, Fort Walton Beach, Florida) measures bodily movement on a minute-by-minute basis storing this information as an “activity count” that reflects the duration and intensity of ambulatory activities (23). Average activity was summarized by dividing the daily total activity counts (ct) by the amount of monitor wear time each day and averaging the values of the valid days to estimate average activity as ct/min/day. This measure integrates both sedentary and physical activity and accounts for differences in wear time. Physical activity and sedentary behavior were summarized by the number of minutes per day spent sedentary (0-99 ct/min) or in light (100-759 ct/min) and moderate-to-vigorous (760+ ct/min) activity. These count cut-points were selected to capture the full-range of sedentary, light and moderate-vigorous behaviors based on prior studies (23, 25, 29, 38). All summary measures were averaged across valid days of wear. The average number of valid days was 5.5 (SD=1.3). It has been estimated that three to four valid days of monitor wear sufficiently reduce intra-individual variation in behavior and achieve relatively high intraclass correlations (i.e. r > 0.80) for average activity (24). The data reduction procedures and exclusions made during the processing and cleaning of the monitor data have been previously described (6).
Urine Collection
Participants provided an overnight 12-hour urine collection, which was picked up by the study nurse and transferred on ice to the laboratory within two hours for processing. Urine samples were shipped to the United States in liquid nitrogen containers and stored in 10 ml aliquots at -80 °C without ascorbic acid until the assays were performed in 2011. Stable EM levels have been reported in urine samples collected in this manner (17).
Laboratory Assays
Fifteen EM were measured in 500 ul of thawed urine using a liquid chromatography tandem mass spectrometry assay (LC-MS/MS) developed at the Laboratory of Proteomics and Analytical Chemistry (Frederick National Laboratory for Cancer Research, Frederick, MD) (39). The LC-MS/MS analysis was performed using an Agilent 1200 series nanoflow LC system (Agilent Technologies, Palo Alto, CA) coupled to a TSQ™ Quantum Ultra triple quadrupole mass spectrometer (Thermo Electron, San Jose, CA). The EM measured included the parent estrogens (estrone and 17β-estradiol) and estrogen metabolites in the 2-hydroxylation pathway (2-hydroxyestrone, 2-hydroxyestradiol, 2-hydroxyestrone-3-methyl ether, 2-methoxyestrone, and 2-methoxyestradiol), the 4-hydroxylation pathway (4-hydroxyestrone, 4-methoxyestrone, and 4-methoxyestradiol) and the 16-hydroxylation pathway (16α-hydroxyestrone, 17-epiestriol, estriol, 16-epiestriol, and 16-ketoestradiol). Details of the assay including sample preparation and reagents have been described previously (39). In brief, the stable isotope labeled estrogens (SI-EM) including deuterated 2-hydroxyestradiol, 2-methoxyestradiol, and estriol (C/D/N Isotopes, Inc.); deuterated 16-epiestriol (Medical Isotopes, Inc.); and 13C-labeled estrone and estradiol (Cambridge Isotope Laboratories, Inc.) were added to each thawed urine sample at the beginning of our assay. After enzymatic hydrolysis using β-glucuronidase/sulfatase from Helix pomatia, the EM were extracted with dichloromethane, derivatized with dansyl chloride, and quantitatively measured using LC-MS/MS.
Samples were randomized across fifteen batches; three blinded quality control (QC) samples were included within each batch, representing 8% of the samples. Coefficients of variation (CVs) for all EM were < 5%. Intraclass correlation coefficients (ICCs) were 99% for all EM with the exception of 2-methoxyestrone (83%) and 4-methoxyestrone (93%). The lower level of quantitation for the EM is 0.025 pg/0.5 ml urine sample (39). To adjust for variation in urine concentration, creatinine levels were measured in 500 ul of urine at Collaborative Laboratory Services, LLC (Ottumwa, IA) (CV <2%).
Statistical Analysis
Descriptive characteristics were compared across tertiles of overall activity by either analysis of variance (ANOVA) or Chi-Square tests, as appropriate. EM were log transformed and analyzed individually (pmol/mg creatinine), grouped metabolic pathways (C-2,-4, or -16), and as ratios. Grouped metabolic pathways represent the sum of individual metabolites within each pathway. Linear models, adjusted for continuous measures of age and body mass index (BMI, kg/m2) as continuous variables, were fit to the log-transformed hormone measures. Geometric means were calculated by tertiles of accelerometer measures for each of the EM based on these models. Tests for trend were conducted by modeling each categorical accelerometer measure as an ordinal variable, coded as 0,1,2 for the tertiles. Additional confounders were determined a priori based on the literature and included age at natural menopause (<45, 45-49, 50-54, 55+, unknown), age at first full term birth (nulliparous, <20, 20-24, 25-30, >30), number of full term births (nulliparous, 1, 2, 3+), smoking status (never, former, current), alcohol use (never, former, current, unknown), history of benign breast disease (no, yes, unknown), and family history of breast cancer (no, yes). However, additional adjustments did not alter age- and BMI-adjusted estimates after adjustment for age and BMI. Final models evaluating sedentary behavior were adjusted for light and moderate-vigorous activity and wear time. For the main analysis, wear time was included in the final model given its association with time spent in active and sedentary behaviors. However, in sensitivity analyses we also computed results without adjustment for wear time.
To assess potential effect modification by BMI, we fit interaction terms between BMI (continuous) with active or sedentary behavior (tertiles). To identify and account for the potential influence of outliers on our results, we conducted sensitivity analyses by fitting robust regression models to each log-transformed EM (33). In sensitivity analyses, we adjusted for an alternate measure of adiposity, waist circumference, which was strongly and positively correlated with BMI (r=0.89) and results were similar (data not shown). All p-values are two-sided with statistical significance defined as p <0 .05; p-values were not formally adjusted for multiple comparisons given the exploratory nature of these analyses. Analyses were conducted with SAS version 9.3 (SAS Institute, Cary, NC).
Results
Women with higher average activity, as defined by the highest tertile, were more likely to be younger (p<.0001) and less overweight (p=0.009); Table 1. Active women spent more time engaging in light and moderate-to-vigorous activity (p<.0001) and less time sedentary (p<.0001). No significant differences were observed across the tertiles of average activity when comparing urinary creatinine levels, education, age at menopause, and reproductive or other lifestyle factors such as smoking status and alcohol consumption (all p-values >0.05).
Table 1. Characteristics of postmenopausal women (N=542) at urine collection by average activity1.
| Characteristic | Average Activity (average counts/min/day) | P-value3 | ||
|---|---|---|---|---|
|
| ||||
| ≤ 244.61 (n=179) | 244.62-346.0 (n=178) | >346.0 (n=185) | ||
| Mean ± SD | ||||
|
| ||||
| Age (y) | 63.2 ± 7.5 | 60.3 ± 7.1 | 58.5 ± 6.7 | <.0001 |
| Body mass index (kg/m2) | 28.1 ± 5.2 | 26.6 ± 4.8 | 27.0 ± 4.3 | 0.009 |
| Creatinine (mg/dl) | 83.8 ± 40.8 | 87.5 ± 42.8 | 89.8 ± 43.2 | 0.41 |
| Accelerometer data (hours/day)2 | ||||
| Wear time | 13.4 ± 1.3 | 14.0 ± 1.6 | 13.8 ± 1.4 | 0.0004 |
| Light | 3.7 ± 1.11 | 4.6 ± 0.85 | 4.7 ± 0.9 | <.0001 |
| Moderate to vigorous | 0.75 ± 0.31 | 1.5 ± 0.34 | 2.5 ± 0.7 | <.0001 |
| Sedentary | 8.9 ± 1.3 | 8.0 ± 1.2 | 6.5 ± 1.3 | <.0001 |
|
| ||||
| N (%) | ||||
|
| ||||
| Education | ||||
| Less than high school | 59 (33.0) | 62 (34.8) | 74 (40.0) | 0.73 |
| High school | 75 (41.9) | 68 (38.2) | 69 (37.3) | |
| Some college/professional training | 14 (7.8) | 17 (9.6) | 18 (9.7) | |
| College graduate | 28 (15.6) | 30 (16.9) | 23 (12.4) | |
| Age at menopause (y) | ||||
| < 45 | 31 (17.3) | 20 (11.2) | 21 (11.4) | 0.33 |
| 45-49 | 50 (27.9) | 56 (31.5) | 58 (31.4) | |
| 50-54 | 67 (37.4) | 70 (39.9) | 82 (44.3) | |
| 55+ | 28 (15.6) | 25 (14.0) | 19 (10.3) | |
| Age at first full term birth (y) | ||||
| Nulliparous | 25 (14.0) | 14 (7.9) | 18 (9.7) | 0.39 |
| <20 | 29 (16.2) | 22 (12.3) | 18 (9.7) | |
| 20-24 | 74 (41.3) | 84 (47.2) | 84 (45.4) | |
| 25-30 | 35 (19.6) | 41 (23.0) | 44 (23.8) | |
| >30 | 16 (8.9) | 17 (9.6) | 21 (11.4) | |
| Number of full term births | ||||
| Nulliparous | 25 (14.0) | 14 (7.9) | 18 (9.7) | 0.61 |
| 1 | 50 (28.0) | 53 (29.8) | 54 (29.2) | |
| 2 | 76 (42.4) | 82 (46.0) | 78 (42.2) | |
| 3+ | 28 (15.6) | 29 (16.3) | 35 (18.9) | |
| Family history of breast cancer | 18 (10.1) | 11 (6.2) | 9 (4.9) | 0.13 |
| History of benign breast disease | 17 (9.5) | 8 (4.5) | 14 (7.6) | 0.19 |
| Current smoker | 44 (24.6) | 43 (24.2) | 37 (20.0) | 0.37 |
| Alcohol use | ||||
| Never | 113 (63.1) | 114 (64.0) | 116 (62.7) | 0.40 |
| Former | 51 (28.5) | 48 (27.0) | 60 (32.4) | |
| Current | 15 (8.4) | 16 (9.0) | 8 (4.3) | |
Note: Missing values included in the denominator for calculation of above percentages
Average activity defined by average counts per minute per day
Time spent sedentary or in light and moderate-to-vigorous activity calculated as the average hours per day across valid days of wear. Behavior defined by the following counts: sedentary (0-99 counts), light (100-759 counts), and moderate-to-vigorous (760+ counts)
P-values calculated using analysis of variance for continuous variables and X2 for categorical variable
Median urinary concentrations of EM along with the average percent contribution of the individual metabolites are summarized in Table 2. The EM with the highest yield in this population of postmenopausal women included: 2-hydroxyestrone (20.8%), estriol (19.9%), estrone (15.7%), 16-ketoestradiol (10.8%), and 16α-hydroxyestrone (8.1%).
Table 2. Median urinary concentrations of estrogens and estrogen metabolites (pmol/mg creatinine) among postmenopausal women (N=542).
| Estrogen Metabolite (EM) Measure | Interdecile Range | Average Percent Contribution | ||
|---|---|---|---|---|
| Median | 10th | 90th | ||
| Total EM | 30.8 | 12.4 | 100.6 | |
| Parent Estrogens | 5.3 | 1.7 | 26.4 | |
| Estrone | 4.2 | 1.2 | 20.7 | 15.7% |
| Estradiol | 1.1 | 0.3 | 6.2 | 4.7% |
| 2-Hydroxylation pathway | 10.1 | 4.3 | 28.3 | |
| 2-Pathway catechols | 8.0 | 3.3 | 23.0 | |
| 2-Hydroxyestrone | 6.4 | 2.4 | 19.1 | 20.8% |
| 2-Hydroxyestradiol | 1.5 | 0.7 | 4.4 | 5.2% |
| 2-Pathway methylated catechols | 2.0 | 0.9 | 4.8 | |
| 2-Methoxyestrone | 1.1 | 0.5 | 2.9 | 3.8% |
| 2-Methoxyestadiol | 0.4 | 0.2 | 1.1 | 1.5% |
| 2-Hydroxyestrone-3-methyl ether | 0.4 | 0.1 | 0.9 | 1.3% |
| 4-Hydroxylation pathway | 1.3 | 0.6 | 3.7 | |
| 4-Pathway catechol: 4-hydroxyestrone | 1.0 | 0.4 | 3.0 | 3.3% |
| 4-Pathway methylated catechols | 0.3 | 0.1 | 0.8 | |
| 4-Methoxyestrone | 0.2 | 0.1 | 0.5 | 0.7% |
| 4-Methoxyestradiol | 0.1 | 0.04 | 0.2 | 0.3% |
| 16-Hydroxylation pathway | 13.0 | 5.4 | 43.7 | |
| 16α-Hydroxyestrone | 2.5 | 1.0 | 8.2 | 8.1% |
| Estriol | 6.1 | 2.3 | 21.8 | 19.9% |
| 17-Epiestriol | 0.4 | 0.2 | 1.0 | 1.4% |
| 16-Ketoestradiol | 3.4 | 1.3 | 10.0 | 10.8% |
| 16-Epiestriol | 0.7 | 0.26 | 1.9 | 2.4% |
| Metabolic pathway ratios | ||||
| 2-pathway / parent estrogens | 1.7 | 0.9 | 2.4 | - |
| 2-pathway catechols / parent estrogens | 1.3 | 0.7 | 3.1 | - |
| 2-pathway methylated / parents estrogens | 0.3 | 0.1 | 0.7 | - |
| 2-pathway catechols / 2-pathway methylated | 1.3 | 0.7 | 3.1 | - |
| 2-pathway catechols / methylated | 4.2 | 2.3 | 8.0 | - |
| 4- pathway / parent estrogens | 0.2 | 0.1 | 0.5 | - |
| 4-pathway catechol / parent estrogens | 0.2 | 0.08 | 0.4 | - |
| 4-pathway methylated / parent estrogens | 0.05 | 0.02 | 0.12 | - |
| 4-pathway catechol / methylated | 3.2 | 1.7 | 7.3 | - |
| 16-pathway / parent estrogens | 2.1 | 1.3 | 4.5 | - |
| 2-pathway / 16-pathway | 0.77 | 0.57 | 0.99 | - |
| 2-hydroxyestrone / 16α-hydroxyestrone | 2.6 | 1.9 | 3.7 | - |
| 4-pathway / 2 pathway | 0.13 | 0.12 | 0.15 | - |
| 4-pathway / 16 pathway | 0.1 | 0.07 | 0.13 | - |
Table 3 presents results from the analysis of EM by average activity, after adjustment for age and BMI. Higher average activity was associated with lower urinary levels of parent estrogens, estrone and estradiol (p-trend=0.01 for each). When comparing the highest to lowest tertile of activity, the difference in the geometric means for estrone and estradiol was 32.1% and 29%, respectively. No statistically significant trends were observed when examining relationships between the grouped pathways (2, 4 and 16-hydroxylation) and average activity. With regard to the individual metabolites, higher activity was associated with lower levels of 2-methoxyestradiol, 4-methoxyestradiol, 17-epiestriol and 16-epiestrol (p=0.03 for each). No association was observed with either the ratio of 2-OHE1 / 16α-OHE1 or the 2-pathway / 16-pathway. However, higher average activity was associated with an elevated ratio of each hydroxylation pathway relative to the parent estrogens (2-pathway / parent estrogens, 4-pathway / parent estrogens and 16-pathway / parent estrogens, p-trend=0.01; Table 3). The percent difference from the lowest to highest tertile ranged from 15-17.4%, depending on the ratio. No statistically significant associations were observed when analyzing EM levels by either light or moderate-to-vigorous activity, after adjusting for sedentary behavior [see Tables, Supplemental Digital Content 1 and 2, Geometric means for urinary concentrations of estrogens and estrogen metabolites (picomoles per miligram creatinine)].
Table 3. Geometric means1 for urinary estrogens and estrogen metabolites (pmol/mg creatinine) by average activity2.
| Estrogen Metabolite (EM) Measure | Average Activity2 (average counts/min/day) | P-trend3 | ||
|---|---|---|---|---|
| ≤ 244.61 | 244.62-346.0 | >346.0 | ||
| Total EM | 35.89 | 35.59 | 29.75 | 0.05 |
| Parent estrogens | 7.15 | 6.62 | 5.19 | 0.01 |
| Estrone | 5.50 | 5.01 | 3.98 | 0.01 |
| Estradiol | 1.42 | 1.41 | 1.06 | 0.01 |
| 2-Hydroxylation pathway | 11.27 | 11.44 | 9.74 | 0.07 |
| 2-Pathway catechols | 9.01 | 9.07 | 7.74 | 0.09 |
| 2-Hydroxyestrone | 7.24 | 7.21 | 6.17 | 0.09 |
| 2-Hydroxyestradiol | 1.71 | 1.80 | 1.51 | 0.13 |
| 2-Pathway methylated catechols | 2.08 | 2.14 | 1.82 | 0.07 |
| 2-Methoxyestrone | 1.18 | 1.25 | 1.03 | 0.10 |
| 2-Methoxyestradiol | 0.46 | 0.45 | 0.39 | 0.03 |
| 2-Hydroxyestrone-3-methyl-ether | 0.38 | 0.38 | 0.33 | 0.10 |
| 4-Hydroxylation pathway | 1.51 | 1.51 | 1.31 | 0.07 |
| 4-Pathway catechol: 4-hydroxyestrone | 1.14 | 1.14 | 0.98 | 0.08 |
| 4-Pathway methylated catechols | 0.33 | 0.33 | 0.29 | 0.08 |
| 4-Methoxyestrone | 0.22 | 0.23 | 0.20 | 0.14 |
| 4-Methoxyestradiol | 0.10 | 0.10 | 0.09 | 0.03 |
| 16-Hydroxylation pathway | 15.03 | 15.00 | 12.68 | 0.07 |
| 16α-Hydroxyestrone | 2.78 | 2.77 | 2.36 | 0.08 |
| Estriol | 7.00 | 7.08 | 5.81 | 0.06 |
| 17-Epiestriol | 0.43 | 0.43 | 0.36 | 0.03 |
| 16-Ketoestradiol | 3.65 | 3.64 | 3.25 | 0.20 |
| 16-Epiestriol | 0.79 | 0.75 | 0.65 | 0.03 |
| Metabolic pathway ratios | ||||
| 2-pathway / parent estrogens | 1.58 | 1.73 | 1.88 | 0.01 |
| 2-pathway catechols / parent estrogens | 1.26 | 1.37 | 1.49 | 0.01 |
| 2-pathway methylated / parent estrogens | 0.29 | 0.32 | 0.35 | 0.01 |
| 4-pathway catechol / parent estrogens | 0.16 | 0.17 | 0.19 | 0.02 |
| 4-pathway methylated / parent estrogens | 0.05 | 0.05 | 0.06 | 0.02 |
| 4-pathway / parent estrogens | 0.21 | 0.23 | 0.25 | 0.01 |
| 16-pathway / parent estrogens | 2.10 | 2.26 | 2.44 | 0.01 |
| 2-pathway / 16-pathway | 0.75 | 0.76 | 0.77 | 0.32 |
| 2-hydroxyestrone / 16α-hydroxyestrone | 2.60 | 2.60 | 2.61 | 0.89 |
| 4-pathway / 2-pathway | 0.13 | 0.13 | 0.13 | 0.86 |
| 4-pathway / 16-pathway | 0.10 | 0.10 | 0.10 | 0.40 |
| 4-pathway catechol / 4-pathway methylated | 3.43 | 3.46 | 3.33 | 0.61 |
| 2-pathway catechol / 2-pathway methylated | 4.33 | 4.24 | 4.27 | 0.79 |
Geometric means adjusted for age and BMI
Average activity defined as average counts per minute per day
P-trend <0.05 are bolded
Associations between sedentary behavior and EM, accounting for time spent in light and moderate-to-vigorous activity, age, BMI, and wear time, were also assessed (Table 4). While sedentary behavior was not significantly associated with total EM, greater amounts of sedentary time were significantly associated with higher levels of estrone and estradiol in the top tertile (p-trend=0.04 for each), suggesting a threshold effect. The percent difference in the geometric means of either estrone or estradiol for the lowest and highest tertile of sedentary behavior reflects a 42.9% and 40.6% increase, respectively. Overall, the grouped 2-, 4- or 16-hydroxylation pathways were not significantly associated with sedentary behavior. Sedentary behavior was associated with greater excretion of methylated 2- and 4-pathway catechols. Significant positive associations were observed in the 2-pathway with 2-methoxyestrone (p-trend=0.03) and 2-methoxyestradiol (p-trend=0.002), and in the 4-pathway with 4-methoxyestrone (p-trend=0.04) and 4-methoxyestradiol (p-trend=0.01). No significant associations were observed with the other catechol estrogens or metabolites in the 16-pathway and sedentary behavior. Results from analysis of EM and sedentary behavior without adjustment for wear time are shown in Supplemental Digital Content 3 [see Table, Supplemental Digital Content 3, Geometric means for urinary concentrations of estrogens and estrogen metabolites (picomoles per miligram creatinine) by sedentary behavior]. Overall, the patterns of geometric means were similar with and without adjustment for wear time.
Table 4. Geometric means for urinary estrogens and estrogen metabolites (pmol/mg creatinine) by sedentary behavior, adjusted for light and moderate-to-vigorous activity.
| Estrogen Metabolite (EM) Measure | Sedentary Behavior2 (average min/day) | P-trend3 | ||
|---|---|---|---|---|
| ≤ 423.0 | 424.5-505.5 | >505.57 | ||
| Total EM | 30.61 | 31.22 | 39.27 | 0.11 |
| Parent estrogens | 5.33 | 5.52 | 8.19 | 0.04 |
| Estrone | 4.06 | 4.22 | 6.28 | 0.04 |
| Estradiol | 1.12 | 1.10 | 1.69 | 0.04 |
| 2-Hydroxylation pathway | 9.80 | 10.18 | 12.44 | 0.09 |
| 2-Pathway catechols | 7.88 | 8.05 | 9.88 | 0.13 |
| 2-Hydroxyestrone | 6.27 | 6.43 | 7.90 | 0.14 |
| 2-Hydroxyestradiol | 1.55 | 1.55 | 1.90 | 0.12 |
| 2-Pathway methylated catechols | 1.76 | 1.94 | 2.34 | 0.02 |
| 2-Methoxyestrone | 1.02 | 1.11 | 1.34 | 0.03 |
| 2-Methoxyestradiol | 0.36 | 0.43 | 0.53 | 0.002 |
| 2-Hydroxyestrone-3-methyl-ether | 0.33 | 0.35 | 0.42 | 0.06 |
| 4-Hydroxylation pathway | 1.30 | 1.37 | 1.66 | 0.07 |
| 4-Pathway catechol: 4-hydroxyestrone | 0.98 | 1.02 | 1.25 | 0.11 |
| 4-Pathway methylated catechols | 0.28 | 0.31 | 0.37 | 0.02 |
| 4-Methoxyestrone | 0.19 | 0.21 | 0.25 | 0.04 |
| 4-Methoxyestradiol | 0.08 | 0.09 | 0.11 | 0.01 |
| 16-Hydroxylation pathway | 13.40 | 13.29 | 15.90 | 0.25 |
| 16α-Hydroxyestrone | 2.53 | 2.47 | 2.88 | 0.40 |
| Estriol | 6.23 | 6.14 | 7.45 | 0.25 |
| 17-Epiestriol | 0.38 | 0.39 | 0.45 | 0.28 |
| 16-Ketoestradiol | 3.27 | 3.28 | 3.97 | 0.18 |
| 16-Epiestriol | 0.66 | 0.72 | 0.81 | 0.13 |
| Metabolic pathway ratios | ||||
| 2-pathway / parent estrogens | 1.84 | 1.84 | 1.52 | 0.07 |
| 2-pathway catechols / parent estrogens | 1.48 | 1.46 | 1.21 | 0.06 |
| 2-pathway methylated / parent estrogens | 0.33 | 0.35 | 0.29 | 0.28 |
| 4-pathway catechol / parent estrogens | 0.18 | 0.19 | 0.15 | 0.09 |
| 4-pathway methylated / parent estrogens | 0.05 | 0.06 | 0.04 | 0.27 |
| 4-pathway / parent estrogens | 0.24 | 0.25 | 0.20 | 0.10 |
| 16-pathway / parent estrogens | 2.51 | 2.41 | 1.94 | 0.01 |
| 2-pathway / 16-pathway | 0.73 | 0.77 | 0.78 | 0.11 |
| 2-hydroxyestrone / 16α-hydroxyestrone | 2.48 | 2.60 | 2.74 | 0.04 |
| 4-pathway / 2-pathway | 0.13 | 0.13 | 0.13 | 0.62 |
| 4-pathway / 16-pathway | 0.10 | 0.10 | 0.10 | 0.10 |
| 4-pathway catechol / 4-pathway methylated | 3.52 | 3.29 | 3.41 | 0.70 |
| 2-pathway catechol / 2-pathway methylated | 4.47 | 4.16 | 4.22 | 0.43 |
Adjusted for age, BMI, light and moderate-to-vigorous activity and wear time
Sedentary behavior (counts <100)
P-trend <0.05 are bolded
Unlike patterns for active behavior, no significant trends were observed for sedentary behavior with the ratio of 2-pathway to parents or 4-pathway to parents (Table 4), although levels declined with increasing sedentary behavior and a lower ratio of the 16-pathway relative to the parent estrogens was observed with increasing time spent sedentary (p-trend=0.01). Although the ratio of 2-pathway / 16-pathway was not significantly associated with sedentary behavior, a significant positive trend was observed with the 2-OHE1 / 16α-OHE1 (p-trend=0.04). No statistically significant trends were observed with the other metabolic ratios examined.
No significant effect modification by BMI was observed (data not shown). In sensitivity analyses in which robust regression was performed to account for potential outliers, we observed similar patterns as those summarized in Tables 3 and 4 (data not shown).
Discussion
To our knowledge, this is the first epidemiological study of postmenopausal women to evaluate associations between objectively measured physical activity and sedentary behavior in relation to estrogen metabolites in all three metabolic pathways (2-, 4- and 16-hydroxylation). Using a comprehensive, sensitive, and highly reliable LC-MS/MS assay and accelerometer measures, we observed that higher average activity was significantly associated with lower urinary levels of estrogens and select estrogen metabolites. Conversely, increased time spent sedentary was significantly associated with higher levels of parent estrogens and methylated catechols in the 2- and 4-pathways.
Our findings with accelerometer-measured physical activity are consistent with prior intervention trials reporting a reduction in estradiol and estrone levels with higher activity among postmenopausal women (14, 30). Few studies have evaluated associations between physical activity and estrogen metabolism, focusing on the hypothesis that increased physical activity was associated with a higher ratio of 2-OHE1 / 16-OHE1 (1, 27). In our analysis, higher activity was not associated with changes in either the ratio of 2-OHE1 / 16-OHE1 or 2-pathway / 16-pathway. However, higher average activity was associated with a higher urinary ratio of the 2, 4, and 16-pathway metabolites relative to parent estrogens. These findings suggest that physical activity may induce changes in estrogen metabolism possibly through more extensive hydroxylation of parent estrogens, leading to increased excretion. Given the exploratory nature of this study, findings should be interpreted cautiously and replicated in other populations, particularly with measures of estrogen metabolites pre- and post-activity.
In addition to our findings with the ratio measures, we observed significant inverse associations of physical activity with some individual metabolites, including methylated catechols in the 2-pathway. Methylation of catechol estrogens prevents the formation of potentially DNA damaging quinone products (40) and earlier studies among premenopausal women have suggested higher circulating levels of methylated catechols with exhaustive exercise (8, 9). Explanations for these discrepancies are unclear but may, in part, be explained by potential differences in COMT enzymatic activity or genetic polymorphisms (36), differences in the amount, type, and intensity of physical activity, or differences between circulating and urinary measures of estrogen metabolites. As levels of urinary estrogens and metabolites may reflect elimination, studies comparing circulating and urinary EM profiles in the same women are needed. To our knowledge, no prior studies have evaluated relationships between methylated catechols and physical activity or exercise among postmenopausal women. Further research is needed to better understand whether physical activity can directly modulate COMT, and other enzymatic activity, involved in estrogen metabolism, as well as to identify the type of activity that may be necessary to elicit such alterations.
Sedentary behavior has emerged as a chronic disease risk factor, independent of time spent engaging in moderate-vigorous physical activities (34), and has been adversely associated with various biomarkers of cardiovascular disease (19) and breast cancer risk (22) including HDL cholesterol, C-reactive protein and insulin. As hypothesized, increasing sedentary time in our study was associated with increasing levels of urinary estrone and estradiol, after adjustment for BMI, and light and moderate-to-vigorous activity. Sedentary time was inversely associated with the ratio of the 16-pathway to parents and although not statistically significant, a similar inverse pattern between sedentary behavior and the ratio of 2-pathway and 4-pathway metabolites to the parent estrogens was suggested. These observations suggest that sedentary behavior may be associated with reduced estrogen metabolism, particularly in the 16-pathway, independent of time spent in active pursuits. However, further research is needed to better understand relationships between excreted estrogens and metabolites, as noted above. In addition, increased sedentary behavior was positively associated with the methylated catechol estrogens in the C2 and C4 pathways. These findings, along with the inverse associations observed between the methylated catechols and average activity, were somewhat surprising given that methylated catechols are hypothesized to confer a protective effect for breast cancer risk. Possible explanations for these observed findings are described above; however, one cannot dismiss the possibility of chance findings.
Potential biological mechanisms for our findings with sedentary behavior are unclear but may include changes in activity of cytochrome P450 enzymes that regulate hydroxylation to the 16 pathway (40), either directly or through behaviors associated with sedentary time. Mechanisms related to central adiposity and other metabolic consequences such as increasing lipid profiles may also contribute to our understanding of the observed associations between sedentary behavior and estrogens. Overall, the mechanisms that account for the protective effect of physical activity on chronic diseases, such as breast cancer, are unresolved but it has been proposed that physical activity may reduce levels of endogenous factors that drive cell division and other carcinogenic processes, including sex steroid hormones. Previous laboratory studies suggest that estrogen metabolites may be differentially related to DNA damage, cell division and growth but relationships between estrogen metabolites and lifestyle factors, such as physical activity and sedentary behavior, remain unclear. Further research is needed to confirm our findings and to better understand biological associations with active and sedentary behavior.
Strengths of our analysis include the large sample of postmenopausal women and the measurement of EM in three hydroxylation pathways (2-, 4-, and 16-), which extends our understanding of estrogen metabolism beyond the 2-OHE1 and 16α-OHE1 metabolites. Furthermore, the LC-MS/MS assay can measure EM with greater sensitivity and specificity than previous immunoassays (12), which is important in studies of postmenopausal women who generally have lower endogenous estrogen levels. The use of accelerometers provided an objective measure of physical activity and sedentary behavior.
Given the cross-sectional nature of our design we are unable to assess casual relationships between the accelerometer measures and urinary estrogen metabolism profiles or to determine temporality. As this study was the first analysis of accelerometer measures and estrogen metabolism, we did not adjust for multiple comparisons. It is possible that some of our findings may be due to chance and thus require confirmation in other study populations. An additional limitation includes the measurement of estrogens at one point in time whereby we were unable to account for potential intra-individual variation. Recent data from the Nurses' Health Study suggests that among premenopausal women, within-woman reproducibility of urinary EM during a 2-3 year period is high as measured by ICCs ranging from 0.5-0.7 for the various pathways and individual metabolites in the 2-pathway; ICCs were lower for parent estrogens and individual EM in the 4-pathway (10). We recognize that the intra-individual variation over time may differ by menopausal status, particularly given differences in the primary source and overall levels of estrogen; however, there is limited data on the intra-individual reproducibility of the urinary estrogen metabolites (measured by LC-MS/MS) among postmenopausal women (12), particularly over multiple time points. Additionally, while the stability of estrogen metabolites measured in urine collected without ascorbic acid has been reported for short periods of time (17), it is possible that some degree of degradation may have occurred during the approximate 10 year storage period. However, as all urine samples were collected and stored in the same manner, any measurement error would be uniform across all study samples. Furthermore, to our knowledge, only Fuhrman et al. (15) has reported on urinary EM levels among postmenopausal women using the same LC-MS/MS method. Although median (10th, 90th) levels of total EM were lower in our study population, (i.e. 30.8 (12.4, 100.6) as compared with 54.3 (32.0, 93.1) pmol/mg creatinine in the study by Fuhrman et al. (15)), the total EM ranges were overlapping. It is important to note that the mean (SD) age of women in our study population was also higher, 63.2 (7.5) as compared with 58 (6) years (15), which may, in part, explain the lower estrogen levels in the present analysis. Urinary EM in both the present study and that by Fuhrman et al. were adjusted for creatinine levels to account for variations in urine concentrations; however, creatinine concentrations may also vary by muscle mass. While we cannot dismiss the possible influence of muscle mass on creatinine concentrations in our study, we evaluated body mass index as both a confounder and effect modifier of the relationships between accelerometer measures and creatinine-adjusted estrogen metabolites.
Our measures of physical activity and sedentary behavior were estimated from one week of measurement, and it is possible this sampling approach may not fully represent the true long-term average patterns of behavior in this population. However, seasonal variation in behavior tends to be modest in developed countries (28) and three to four replicate days of monitor wear has been found to significantly reduce intra-individual variation in behavior, resulting in relatively high ICCs (i.e., > 0.80) for average activity (24). We therefore believe that the monitor data are likely to be useful estimates of long-term patterns of behavior, but we cannot rule out the possibility that intra-individual variation from week to week or season to season influenced our results.
In summary, findings from this analysis extend our understanding of the associations between active and sedentary behaviors and urinary estrogen metabolism among postmenopausal women. While our results suggest potential explanations for the interrelationships between estrogen, active and sedentary behavior, and chronic disease, this was the first study to examine such associations with accelerometer measures. Our findings require confirmation, ideally within prospective and intervention studies. Understanding relationships between physical activity, sedentary behavior and estrogen levels is critical for elucidating the mechanisms that mediate effects of these exposures, thereby providing information that may aid in the development of preventive approaches.
Supplementary Material
Supplemental Digital Content 1.xls: Geometric means for urinary concentrations of estrogens and estrogen metabolites (picomoles per miligram creatinine) by moderate-to-vigorous activity adjusted for age, BMI, light activity, sedentary behavior and wear time (N=542 postmenopausal women)
Supplemental Digital Content 2.xls: Geometric means for urinary concentrations of estrogens and estrogen metabolites (picomoles per miligram creatinine) by light activity adjusted for age, BMI, moderate-to-vigorous activity, sedentary behavior and wear time (N=542 postmenopausal women)
Supplemental Digital Content 3.xls: Geometric means for urinary concentrations of estrogens and estrogen metabolites (picomoles per miligram creatinine) by sedentary behavior adjusted for age, BMI, moderate-to-vigorous and light activity (N=542 postmenopausal women)
Acknowledgments
The Polish Breast Cancer Study was supported by the Intramural Research Program of the National Cancer Institute, Department of Health and Human Services, USA. Dr. Cher Dallal was supported by the Cancer Prevention Fellowship Program, Division of Cancer Prevention, National Cancer Institute. This ancillary project was supported through supplemental funding awarded by the National Cancer Institute Office of Science Planning and Assessment and the National Institutes of Health Office of Research on Women's Health
We thank Dr. Jonine Figueroa for her oversight and leadership of the NCI Polish Breast Cancer Study. We thank Michael Stagner for his work on study and data management (IMS, Silver Spring, MD) and physicians, pathologists, nurses, and interviewers from participating centers in Poland for their efforts in the field. We also thank the participants for their contributions to this study.
Participating centers in Poland Cancer Center and M. Skodowska-Curie Institute of Oncology in Warsaw: Departments of Epidemiology (Coordinating center: Dr Jolanta Lissowska, Mrs Alicja Bardin-Mikolajczak, Dr Witold Zatonski), Breast Cancer Treatment and Reconstruction (Drs Edward Towpik and Jerzy Giermek), Departments of Surgical Oncology (Dr Pawel Kukawski), Pathology (Drs Grzegorz Rymkiewicz, Marcin Ligaj, Joanna Baran'ska, Agnieszka Turowicz, Włodzimierz Olszewski).
Polish Oncological Foundation in Warsaw: Pathology (Drs Dorota Mazepa-Sikora, Włodzimierz Olszewski).
Nofer Institute of Occupational Medicine in Łódz': Drs Neonila Szeszenia-D˛browska, Beata Peplonska.
Medical University in Łódz': Oncology Clinic (Drs Arkadiusz Jeziorski, Janusz Piekarski), and Pathology Department (Drs Radzislaw Kordek, Grazyna Pasz-Walczak, Robert Kubiak, Dorota Kupnicka, Boguslaw Olborski).
Community Copernicus Hospital in Łódz': Department of Surgical Oncology (Drs Zbigniew Morawiec and Mariusz Pawlak).
Polish Mother's Health Memorial Hospital in Łódz': Departments Surgical Oncology and Breast Diseases (Drs Marcin Faflik, Magdalena Baklinska, Marek Zadrozny, Boguslaw Westfal) and Clinical Pathomorphology (Drs Stanislaw Lukaszek, Andrzej Kulig).
Footnotes
Conflict of Interest: The authors disclose no potential conflicts of interest. The results of the present study do not represent endorsement by ACSM.
References
- 1.Atkinson C, Lampe JW, Tworoger SS, et al. Effects of a moderate intensity exercise intervention on estrogen metabolism in postmenopausal women. Cancer Epidemiol Biomarkers Prev. 2004;13(5):868–74. [PubMed] [Google Scholar]
- 2.Bentz AT, Schneider CM, Westerlind KC. The relationship between physical activity and 2-hydroxyestrone, 16alpha-hydroxyestrone, and the 2/16 ratio in premenopausal women (United States) Cancer Causes Control. 2005;16(4):455–61. doi: 10.1007/s10552-004-6256-6. [DOI] [PubMed] [Google Scholar]
- 3.Bradlow HL, Sepkovic DW, Klug T, Osborne MP. Application of an improved ELISA assay to the analysis of urinary estrogen metabolites. Steroids. 1998;63(7-8):406–13. doi: 10.1016/s0039-128x(98)00041-5. [DOI] [PubMed] [Google Scholar]
- 4.Campbell KL, Westerlind KC, Harber VJ, Bell GJ, Mackey JR, Courneya KS. Effects of aerobic exercise training on estrogen metabolism in premenopausal women: a randomized controlled trial. Cancer Epidemiol Biomarkers Prev. 2007;16(4):731–9. doi: 10.1158/1055-9965.EPI-06-0784. [DOI] [PubMed] [Google Scholar]
- 5.Cavalieri E, Chakravarti D, Guttenplan J, et al. Catechol estrogen quinones as initiators of breast and other human cancers: implications for biomarkers of susceptibility and cancer prevention. Biochim Biophys Acta. 2006;1766(1):63–78. doi: 10.1016/j.bbcan.2006.03.001. [DOI] [PubMed] [Google Scholar]
- 6.Dallal CM, Brinton LA, Matthews CE, et al. Accelerometer-based measures of active and sedentary behavior in relation to breast cancer risk. Breast Cancer Res Treat. 2012;134(3):1279–90. doi: 10.1007/s10549-012-2129-y. [DOI] [PMC free article] [PubMed] [Google Scholar]
- 7.Dallal CM, Tice JA, Buist DS, et al. Estrogen metabolism and breast cancer risk among postmenopausal women: a case-cohort study within B∼FIT. Carcinogenesis. 2014;35(2):346–55. doi: 10.1093/carcin/bgt367. [DOI] [PMC free article] [PubMed] [Google Scholar]
- 8.De Cree C, Ball P, Seidlitz B, Van Kranenburg G, Geurten P, Keizer HA. Responses of catecholestrogen metabolism to acute graded exercise in normal menstruating women before and after training. J Clin Endocrinol Metab. 1997;82(10):3342–8. doi: 10.1210/jcem.82.10.4303. [DOI] [PubMed] [Google Scholar]
- 9.De Cree C, Van Kranenburg G, Geurten P, Fujimori Y, Keizer HA. 4-Hydroxycatecholestrogen metabolism responses to exercise and training: possible implications for menstrual cycle irregularities and breast cancer. Fertil Steril. 1997;67(3):505–16. doi: 10.1016/s0015-0282(97)80078-7. [DOI] [PubMed] [Google Scholar]
- 10.Eliassen AH, Ziegler RG, Rosner B, et al. Reproducibility of fifteen urinary estrogens and estrogen metabolites over a 2- to 3-year period in premenopausal women. Cancer Epidemiol Biomarkers Prev. 2009;18(11):2860–8. doi: 10.1158/1055-9965.EPI-09-0591. [DOI] [PMC free article] [PubMed] [Google Scholar]
- 11.Falk RT, Brinton LA, Dorgan JF, et al. Relationship of serum estrogens and estrogen metabolites to postmenopausal breast cancer risk: a nested case-control study. Breast Cancer Res. 2013;15(2):R34. doi: 10.1186/bcr3416. [DOI] [PMC free article] [PubMed] [Google Scholar]
- 12.Falk RT, Xu X, Keefer L, Veenstra TD, Ziegler RG. A liquid chromatography-mass spectrometry method for the simultaneous measurement of 15 urinary estrogens and estrogen metabolites: assay reproducibility and interindividual variability. Cancer Epidemiol Biomarkers Prev. 2008;17(12):3411–8. doi: 10.1158/1055-9965.EPI-08-0355. [DOI] [PMC free article] [PubMed] [Google Scholar]
- 13.Friedenreich CM. The role of physical activity in breast cancer etiology. Semin Oncol. 2010;37(3):297–302. doi: 10.1053/j.seminoncol.2010.05.008. [DOI] [PubMed] [Google Scholar]
- 14.Friedenreich CM, Woolcott CG, McTiernan A, et al. Alberta physical activity and breast cancer prevention trial: sex hormone changes in a year-long exercise intervention among postmenopausal women. J Clin Oncol. 2010;28(9):1458–66. doi: 10.1200/JCO.2009.24.9557. [DOI] [PMC free article] [PubMed] [Google Scholar]
- 15.Fuhrman BJ, Brinton LA, Pfeiffer RM, et al. Estrogen metabolism and mammographic density in postmenopausal women: a cross-sectional study. Cancer Epidemiol Biomarkers Prev. 2012;21(9):1582–91. doi: 10.1158/1055-9965.EPI-12-0247. [DOI] [PMC free article] [PubMed] [Google Scholar]
- 16.Fuhrman BJ, Schairer C, Gail MH, et al. Estrogen metabolism and risk of breast cancer in postmenopausal women. J Natl Cancer Inst. 2012;104(4):326–39. doi: 10.1093/jnci/djr531. [DOI] [PMC free article] [PubMed] [Google Scholar]
- 17.Fuhrman BJ, Xu X, Falk RT, et al. Stability of 15 estrogens and estrogen metabolites in urine samples under processing and storage conditions typically used in epidemiologic studies. Int J Biol Markers. 2010;25(4):185–94. [PMC free article] [PubMed] [Google Scholar]
- 18.Garcia-Closas M, Brinton LA, Lissowska J, et al. Established breast cancer risk factors by clinically important tumour characteristics. Br J Cancer. 2006;95(1):123–9. doi: 10.1038/sj.bjc.6603207. [DOI] [PMC free article] [PubMed] [Google Scholar]
- 19.Healy GN, Matthews CE, Dunstan DW, Winkler EA, Owen N. Sedentary time and cardio-metabolic biomarkers in US adults: NHANES 2003-06. Eur Heart J. 2011;32(5):590–7. doi: 10.1093/eurheartj/ehq451. [DOI] [PMC free article] [PubMed] [Google Scholar]
- 20.Lee IM, Shiroma EJ, Lobelo F, et al. Effect of physical inactivity on major non-communicable diseases worldwide: an analysis of burden of disease and life expectancy. Lancet. 2012;380(9838):219–29. doi: 10.1016/S0140-6736(12)61031-9. [DOI] [PMC free article] [PubMed] [Google Scholar]
- 21.Lynch BM. Sedentary behavior and cancer: a systematic review of the literature and proposed biological mechanisms. Cancer Epidemiol Biomarkers Prev. 2010;19(11):2691–709. doi: 10.1158/1055-9965.EPI-10-0815. [DOI] [PubMed] [Google Scholar]
- 22.Lynch BM, Friedenreich CM, Winkler EA, et al. Associations of objectively assessed physical activity and sedentary time with biomarkers of breast cancer risk in postmenopausal women: findings from NHANES (2003-2006) Breast Cancer Res Treat. 2011;130(1):183–94. doi: 10.1007/s10549-011-1559-2. [DOI] [PubMed] [Google Scholar]
- 23.Matthews CE. Calibration of Accelerometer Output for Adults. Medicine & Science in Sports & Exercise. 2005;37(11):S512–S22. doi: 10.1249/01.mss.0000185659.11982.3d. [DOI] [PubMed] [Google Scholar]
- 24.Matthews CE, Ainsworth BE, Thompson RW, Bassett DR., Jr Sources of variance in daily physical activity levels as measured by an accelerometer. Med Sci Sports Exerc. 2002;34(8):1376–81. doi: 10.1097/00005768-200208000-00021. [DOI] [PubMed] [Google Scholar]
- 25.Matthews CE, Chen KY, Freedson PS, et al. Amount of time spent in sedentary behaviors in the United States, 2003-2004. Am J Epidemiol. 2008;167(7):875–81. doi: 10.1093/aje/kwm390. [DOI] [PMC free article] [PubMed] [Google Scholar]
- 26.Matthews CE, Fortner RT, Xu X, Hankinson SE, Eliassen AH, Ziegler RG. Association between physical activity and urinary estrogens and estrogen metabolites in premenopausal women. J Clin Endocrinol Metab. 2012;97(10):3724–33. doi: 10.1210/jc.2012-1732. [DOI] [PMC free article] [PubMed] [Google Scholar]
- 27.Matthews CE, Fowke JH, Dai Q, et al. Physical activity, body size, and estrogen metabolism in women. Cancer Causes Control. 2004;15(5):473–81. doi: 10.1023/B:CACO.0000036445.04238.87. [DOI] [PubMed] [Google Scholar]
- 28.Matthews CE, Freedson PS, Hebert JR, et al. Seasonal variation in household, occupational, and leisure time physical activity: longitudinal analyses from the seasonal variation of blood cholesterol study. Am J Epidemiol. 2001;153(2):172–83. doi: 10.1093/aje/153.2.172. [DOI] [PubMed] [Google Scholar]
- 29.Matthews CE, Keadle SK, Sampson J, et al. Validation of a previous-day recall measure of active and sedentary behaviors. Med Sci Sports Exerc. 2013;45(8):1629–38. doi: 10.1249/MSS.0b013e3182897690. [DOI] [PMC free article] [PubMed] [Google Scholar]
- 30.McTiernan A, Tworoger SS, Ulrich CM, et al. Effect of exercise on serum estrogens in postmenopausal women: a 12-month randomized clinical trial. Cancer Res. 2004;64(8):2923–8. doi: 10.1158/0008-5472.can-03-3393. [DOI] [PubMed] [Google Scholar]
- 31.Mueck AO, Seeger H, Lippert TH. Estradiol metabolism and malignant disease. Maturitas. 2002;43(1):1–10. doi: 10.1016/s0378-5122(02)00141-x. [DOI] [PubMed] [Google Scholar]
- 32.Neilson HK, Friedenreich CM, Brockton NT, Millikan RC. Physical activity and postmenopausal breast cancer: proposed biologic mechanisms and areas for future research. Cancer Epidemiol Biomarkers Prev. 2009;18(1):11–27. doi: 10.1158/1055-9965.EPI-08-0756. [DOI] [PubMed] [Google Scholar]
- 33.Ortiz MC, Sarabia LA, Herrero A. Robust regression techniques A useful alternative for the detection of outlier data in chemical analysis. Talanta. 2006;70(3):499–512. doi: 10.1016/j.talanta.2005.12.058. [DOI] [PubMed] [Google Scholar]
- 34.Owen N, Sparling PB, Healy GN, Dunstan DW, Matthews CE. Sedentary behavior: emerging evidence for a new health risk. Mayo Clinic proceedings Mayo Clinic. 2010;85(12):1138–41. doi: 10.4065/mcp.2010.0444. [DOI] [PMC free article] [PubMed] [Google Scholar]
- 35.Smith AJ, Phipps WR, Thomas W, Schmitz KH, Kurzer MS. The effects of aerobic exercise on estrogen metabolism in healthy premenopausal women. Cancer Epidemiol Biomarkers Prev. 2013;22(5):756–64. doi: 10.1158/1055-9965.EPI-12-1325. [DOI] [PMC free article] [PubMed] [Google Scholar]
- 36.Thompson PA, Ambrosone C. Molecular epidemiology of genetic polymorphisms in estrogen metabolizing enzymes in human breast cancer. J Natl Cancer Inst Monogr. 2000;(27):125–34. doi: 10.1093/oxfordjournals.jncimonographs.a024235. [DOI] [PubMed] [Google Scholar]
- 37.Vainio H, Kaaks R, Bianchini F. Weight control and physical activity in cancer prevention: international evaluation of the evidence. Eur J Cancer Prev. 2002;11(Suppl 2):S94–100. [PubMed] [Google Scholar]
- 38.Welk GJ, McClain JJ, Eisenmann JC, Wickel EE. Field validation of the MTI Actigraph and BodyMedia armband monitor using the IDEEA monitor. Obesity (Silver Spring) 2007;15(4):918–28. doi: 10.1038/oby.2007.624. [DOI] [PubMed] [Google Scholar]
- 39.Xu X, Keefer LK, Ziegler RG, Veenstra TD. A liquid chromatography-mass spectrometry method for the quantitative analysis of urinary endogenous estrogen metabolites. Nat Protoc. 2007;2(6):1350–5. doi: 10.1038/nprot.2007.176. [DOI] [PubMed] [Google Scholar]
- 40.Zhu BT, Conney AH. Functional role of estrogen metabolism in target cells: review and perspectives. Carcinogenesis. 1998;19(1):1–27. doi: 10.1093/carcin/19.1.1. [DOI] [PubMed] [Google Scholar]
Associated Data
This section collects any data citations, data availability statements, or supplementary materials included in this article.
Supplementary Materials
Supplemental Digital Content 1.xls: Geometric means for urinary concentrations of estrogens and estrogen metabolites (picomoles per miligram creatinine) by moderate-to-vigorous activity adjusted for age, BMI, light activity, sedentary behavior and wear time (N=542 postmenopausal women)
Supplemental Digital Content 2.xls: Geometric means for urinary concentrations of estrogens and estrogen metabolites (picomoles per miligram creatinine) by light activity adjusted for age, BMI, moderate-to-vigorous activity, sedentary behavior and wear time (N=542 postmenopausal women)
Supplemental Digital Content 3.xls: Geometric means for urinary concentrations of estrogens and estrogen metabolites (picomoles per miligram creatinine) by sedentary behavior adjusted for age, BMI, moderate-to-vigorous and light activity (N=542 postmenopausal women)