

Abstract
Intestinal M (microfold) cells are specialized epithelial cells overlying lymphoid tissues in the small intestine. Unlike common enterocytes, M cells lack an organized apical brush border, and are able to transcytose microparticles across the mucosal barrier to underlying antigen-presenting cells. We found that in both the dextran sodium sulfate and Citrobacter rodentium models of colitis, significantly increased numbers of Peyer's patch (PP) phenotype M cells were induced at the peak of inflammation in colonic epithelium, often accompanied by loosely organized lamina propria infiltrates. PP type M cells are thought to be dependent on cytokines, including tumor necrosis factor (TNF)-α and receptor activator of nuclear factor kappa-B ligand; these cytokines were also found to be induced in the inflamed tissues. The induction of M cells was abrogated by anti–TNF-α blockade, suggesting that anti–TNF-α therapies may have similar effects in clinical settings, although the functional consequences are not clear. Our results suggest that inflammatory cytokine-induced PP type M cells may be a useful correlate of chronic intestinal inflammation.
M cells are a specialized subset of epithelial cells that play a central role in mucosal immune surveillance, by actively capturing and transporting luminal microbial particulates to underlying immune cells, where mucosal-mediated immunity is generated.1 M cells are distinct from surrounding enterocytes, in that they lack an organized apical microvilli brush border, a feature that has been inversely correlated with their efficiency in luminal microparticle binding.2 Most M cells [Peyer's patch (PP) type M cells] are found in the follicle-associated epithelium overlying organized lymphoid follicles, such as PP in the small intestine and nasopharynx-associated lymphoid tissue; a distinct M cell phenotype is the inducible villous M cell in the small intestine.3, 4 In contrast to villous M cells, the PP type M cells are associated with organized lymphoid follicles with an established stromal cell network.5, 6 During organogenesis, proinflammatory cytokines, such as tumor necrosis factor (TNF)-α and lymphotoxin-β, induce NF-κB stromal cell expression of a series of chemokines, including chemokine (C-C motif) ligands 19 and 21 and CXCL13, which facilitate the accumulation/maintenance of the lymphoid follicle.6 The cytokine receptor activator of nuclear factor kappa-B ligand (RANKL) has also been implicated in M cell development, because blockade of this ligand decreases PP M cell numbers.7, 8
The M cell differentiation program is driven by cytokines provided by the underlying immune lymphoid cells within the follicle, directly influencing the adjacent crypt stem cells.8, 9, 10 Consistent with this notion, our studies found that treatment of the intestinal epithelial cell line with TNF-α and lymphotoxin-βR agonist resulted in the induction of M cell–associated genes.11 Because these cytokines are also found in inflammatory settings, inflammatory signals may be sufficient to induce M cell development. Interestingly, villous M cells, although not associated with follicle-associated epithelium, are also induced by inflammatory stressors, like cholera toxin.3, 12, 13 Thus, M cell development and function, regardless of phenotypic subset, seems to be intimately tied to local production of inflammatory cytokines.
Intestinal inflammation, as with inflammatory bowel disease (IBD), which includes Crohn's disease (CD) and ulcerative colitis (UC), is predictably associated with production of inflammatory cytokines. UC and CD appear to have differing etiologies; UC is characterized by colonic inflammation driven, in part, by type 2 T helper cell (Th2) cytokines, whereas CD inflammation extends into the small intestine and is driven by Th1 cytokines.14, 15 Both conditions are characterized by elevated TNF-α levels16, 17; accordingly, the current standard clinical treatment for both UC and CD is anti–TNF-α blockade.18, 19 Anti–TNF-α therapies have not been universally effective; it remains unclear how efficacious they are for prolonged periods and whether they are more beneficial for the treatment of CD versus UC.20, 21, 22
Because similar cytokines may drive both inflammation and M cell development, we tested whether M cells would be induced in colonic epithelium during inflammation and whether this is related to increased TNF-α production. We made use of a reporter mouse in which the promoter for the gene encoding peptidoglycan recognition protein-short (PGRP-S; official gene name PGLYRP1) drives expression of dsRed in both neutrophils and M cells.12, 23 Previous studies from our laboratory found that PGRP-S expression was restricted to follicle-associated M cells (ie, PP-M cells) and not villous M cells, which are a result of transdifferentiation.12 In two models of colonic inflammation, we found significant induction of PP-type M cells in the large intestine, and in one model, M cell induction was abrogated by treatment with anti–TNF-α blockade. Although it is not yet clear what role the induced colonic M cells play in pathogenesis or immune regulation, these results may have relevance to the use of anti–TNF-α blockade in clinical settings.
Materials and Methods
Mice
Wild-type C57BL/6, CX3CR1-enhanced green fluorescent protein (EGFP) knock-in (CX3CR1tm1Litt/J), and B-cell–deficient IgH-6 (IgH6tm1cgn or Ighmtm1Cgn) mice were purchased from The Jackson Laboratory (Bar Harbor, ME). PGRP-S–dsRed (referred to as PGRP-S+) mice were generated as previously described.12 PGRP-S+ were crossed with CX3CR1-EGFP24 and, where indicated, PGRP-S–dsRed+× CX3CR1-EGFPHet (referred to as PGRP-S+CX3CR1Het) were used. PGRP-S mice were backcrossed for 12 generations with IgH-6 BALB/c mice (referred to as PGRP-S+IgH6KO). All mice used were <4 months old and were bred in the University of California, Riverside, vivarium under specific pathogen-free conditions and were handled in accordance with Institutional Animal Care and Use Committee and NIH (Bethesda, MD) guidelines.
DSS
Dextran sodium sulfate (DSS; mol. wt. 36,000 to 50,000; MP Biomedicals, Solon, OH) was added to the drinking water at 5% (w/v) during the course of the experiment. The mice were monitored daily for signs of morbidity (piloerection and lethargy), weight loss, and rectal bleeding.25, 26 Age-matched mice administered normal drinking water were used as controls.
Citrobacter rodentium Infection Model
Mice were infected by oral gavage with a 0.2-mL culture containing approximately 2.6 × 10⁸ GFP reporter Citrobacter rodentium (containing a chloramphenicol resistance gene) in Luria broth.27 To enumerate the bacteria, fecal pellets were weighed and homogenized in phosphate-buffered saline (PBS); serial dilutions were plated onto MacConkey agar plates (Sigma-Aldrich, St. Louis, MO) and incubated overnight at 37°C. Bacterial colonies were counted the next day.
Anti–TNF-α Blockade
Mice were given either DSS in their drinking water or control water. Mice were then given three i.p. injections containing 100 μg of a functional-grade anti-mouse TNF-α (eBioscience, San Diego, CA) at days D 0, 3, and 5 of DSS treatment. These mice were also assessed daily for signs of colonic distress.
Tissue Pathology and Histological Analysis
Mice were sacrificed, and colons were excised and split via a longitudinal incision. Colons were rinsed with PBS, rolled distal to proximal, and transected with a 27-gauge needle. Tissue was then placed into a specimen cup containing Bouin's fixative (Sigma-Aldrich) and allowed to fix for 3 hours. The samples were then washed several times using 70% ethanol to remove excess fixative. These samples were then processed for hematoxylin and eosin staining. Finally, blinded clinical scoring was performed according to the following criteria: crypt hyperplasia,1, 2, 3, 4, 5 inflammation,1, 2, 3 and ulceration.1, 2, 3
Immunohistochemistry
Colons were excised and rolled. Tissue was placed in 4% paraformaldehyde (PFA; Electron Microscopy Sciences, Hatfield, PA) and 30% sucrose (Thermo Fisher Scientific, Waltham, MA)-PBS solution for 2 hours. Cryostat sections were treated with 0.5% Tween-20 in PBS (Thermo Fisher Scientific), washed 3× in 0.1%Tween/PBS and then blocked using 0.1% Tween-20 in casein solution (Thermo Fisher Scientific). Primary antibodies, goat anti-mouse CXCL13 (R&D Systems Minneapolis, MN), rat anti-mouse ER-TR7 (AbD Serotec, Raleigh, NC), rat anti-mouse GP2 (MBL, Woburn, MA), and biotin-conjugated Ly6G and B220 (eBioscience) were then added diluted in blocking solution, and samples were again washed. Secondary antibodies were Alexa Fluor 488 (donkey anti-rat; Life Technologies, Carlsbad, CA), Alexa Fluor 647 (donkey anti-goat A21447 and chicken anti-rat; Life Technologies), and streptavidin Alexa Fluor 647 (Life Technologies). Tissue was again washed, post-fixed with 4% PFA in PBS, and mounted with Prolong Gold antifade reagent (Life Technologies) containing DAPI, which was used as a nuclear counterstain. Images were obtained by using a BD CarvII spinning-disk confocal imager (BD Biosystems, San Jose, CA) attached to a Zeiss Axio Observer inverted microscope (Carl Zeiss, Thornwood, NY). Hardware, including the confocal microscope and digital camera (Qimaging Rolera EMC2, Surrey, BC, Canada), was controlled by Metamorph imaging software version 7.7.9.0 (Molecular Devices, Sunnyvale, CA). Images were further optimized by using Volocity deconvolution software version 6.1 (PerkinElmer, Waltham, MA).
Whole Mount Tissue Preparation and M Cell Counts
Colons were opened longitudinally, laid out flat, and placed into a petri dish containing 4% PFA and 30% sucrose-PBS solution for 2 hours on ice. The samples were washed and placed into a solution containing 150 mmol/L Tris-HCl, pH 8 (Thermo Fisher Scientific), 2 mmol/L dithiothreitol (Life Technologies), and 20% ethanol for 45 minutes. Samples were again washed and cut into 0.5-cm pieces, and placed onto a glass slide, where a gasket was generated using two binder reinforcements placed on top of one another. The samples were mounted with Prolong Gold antifade reagent (Life Technologies), and a coverslip was held in place by putty. Tissues were allowed to cure overnight and imaged. The number of M cells was quantified by setting limits on both size and intensity using Volocity software. Each group contained three mice; four to six 0.5-cm pieces of tissue were used per mouse, and three to five randomly chosen frames were taken per piece of tissue. Images were taken at ×40 magnification with an x and y dimension of 100 μm (tissue surface area per image was 10,000 μm2). The number of M cells per image was quantified by setting limits on both size and intensity using Volocity software to exclude neutrophils and image noise, and visually confirmed by eye. Objects <115 μm3 were excluded to prevent counting dsRed+ neutrophils, objects >2500 μm3 were excluded, so closely associated M cells were not counted together, and objects crossing Z-stack image boundaries were excluded as not whole cells. Data points recorded in the figures were the number of M cells per 10,000 μm2 randomly sampled image.
Scanning Electron Microscopy Fixation and Viewing
Colons were fixed with 2.5% glutaraldehyde solution (Ted Pella, Redding, CA) for 2 hours. Samples were then washed in double-distilled water, and 4% osmium tetroxide (Ted Pella) was added for 30 minutes. Samples were then gradually dehydrated in 25%, 50%, 75%, 90%, and 100% ethanol for 5 minute intervals. Dehydrated samples remained immersed in 100% ethanol. Critical-point drying was performed by using a Balzar critical-point dryer. Samples were then mounted onto pin stub mounts (Ted Pella) with carbon-coated conductive tape and finally sputter coated with platinum/palladium for 60 seconds (Cressington 108 Auto sputter coater). The samples were viewed by XL-30 Field Emission Gun scanning electron microscope at 10 kV. Electron microscopy of the cross section of an M cell was performed using the 3D-EM Zeiss Sigma VP scanning electron microscope (Carl Zeiss), on mouse PP tissue (Renovo Neural, Inc., Cleveland, OH).
Whole Intestine Imaging
Mice were euthanized and colonic tissue was excised and opened longitudinally. The tissues were imaged on the Texas Red channel using the iBox Explorer imaging microscope (UVP, Inc., Upland, CA). Images were then pseudocolored to show dsRed fluorescence signal. Tissues from treated and control animals were imaged side by side and thus treated the same.
Quantitatve PCR
A 1-cm piece taken from both the distal and proximal colon was flash frozen in liquid nitrogen and stored at −20°C until used. Colonic tissue RNA was isolated by Trizol (Invitrogen, Carlsbad, CA) in accordance with the manufacturer's instructions. RNA from DSS-treated animals was further processed after initial Trizol precipitation on the basis of an earlier described method.28 Briefly, the precipitated RNA was suspended in RNAase-free water and then incubated with 0.1 volume of 8 mol/L lithium chloride (Sigma-Aldrich) for 2 hours on ice, then centrifuged for 30 minutes at 14,000 × g, then suspended in RNAase-free water; this was repeated once more. The RNA was precipitated at −20°C for 30 minutes, in 0.1 volume of 3 mol/L sodium acetate (pH 5.2) and two volumes of 100% absolute ethanol. RNA was again centrifuged and washed once with 70% ethanol and finally dissolved in 50 μL of RNAse-free water. RNA was reversed transcribed into cDNA using Super Script III First Strand synthesis kit (Invitrogen) in accordance with the manufacturer's protocol. cDNA was analyzed by real-time PCR using SYBR Green technology (Applied Biosystems, Foster City, CA).
Primers used were as follows: TNF-α, 5′-ACGTCGTAGCAAACCACCAA-3′ (forward) and 5′-ATAGCAAATCGGCTGACGGT-3′ (reverse); dsRed, 5′-AACGGCCACGAGTTCGAGAT-3′ (forward) and 5′-CACTTGAAGCCCTCGGGGAA-3′ (reverse); lacto 5′-TCCGCCAGTCACAGGAGAAGT-3′ (forward) and 5′-CACCATGTGACCCGGGCCTT-3′ (reverse); and gp2 5′-CACTGGGCAGGGAGGAAGGAT-3′ (forward) and 5′-TTCCTGGGCCTCCCATAACCTTG-3′ (reverse).
The hypoxanthine guanine phosphoribosyltransferase primer was used as the reference housekeeping gene, as reported.11 The ΔΔCT method was used to determine the fold induction for each gene.
For quantitative PCR (qPCR) of RANKL transcripts, colonic RNA was resuspended in RNAase-free water, incubated with 0.3 volume of 8 mol/L lithium chloride (Sigma-Aldrich) for 2 hours at −20°C, and centrifuged for 30 minutes at 16,000 × g. The RNA pellet was dissolved in RNAase-free water, and the lithium chloride precipitation was repeated. Then, the RNA was precipitated with 0.1 volume of 3 mol/L sodium acetate (pH 5.2) and three volumes of 100% absolute ethanol for 2 hours at −80°C. The RNA was centrifuged, the pellet was washed twice with 70% and 75% ethanol, and finally dissolved in 30 μL of RNAse-free water.
RNA was reversed transcribed using the Verso cDNA Kit (Thermo Fisher Scientific) in accordance with the manufacturer's protocol.
Primers used were as follows: RANKL, 5′-AGCATCCCATCGGGTTCCCA-3′ (forward) and 5′-GCCCGACCAGTTTTTCGTGCT-3′ (reverse); and hypoxanthine guanine phosphoribosyltransferase, 5′-CCCTCTGGTAGATTGTCGCTTA-3′ (forward) and 5′-AGATGCTGTTACTGATAGGAAATCGA-3′ (reverse).
Quantitative Cytokine Enzyme-Linked Immunosorbent Assays
At necropsy, 1 cm distal colonic tissue was excised, flash frozen in liquid nitrogen, and stored at −20°C until used. Tissue was mechanically homogenized in a solution containing 0.05% sodium azide, 0.5% Triton-X 100 (Sigma-Aldrich), 1× protease inhibitor cocktail, and 1 mmol/L phenylmethylsulfonyl fluoride. TNF-α, IL-1β, IL-6, and IL-10 ready-set-go enzyme-linked immunosorbent assay kits (eBioscience) were used to quantify the level of each cytokine in accordance with the manufacturer's instructions.
Mice were anesthetized by i.p. injection of avertin (tribromoethanol in tert-amyl alcohol). Once the mouse was unconscious, a small 1-cm incision at the xiphoid process was made, using dull forceps, and the cecum was exposed. A total of 5 × 10⁸ bacteria were injected just below the cecum and allowed to incubate for 30 minutes, and the bacteria used were Yersinia enterocolitica (kindly provided by Joan Mecsas at Tufts University, Boston, MA). Mice were then sacrificed, and colons were excised and rolled. The tissue was fixed with 4% PFA and 30% sucrose in PBS solution for 2 hours and frozen in OCT (TissueTek; Thermo Fisher Scientific). Samples were cryosectioned and imaged using a confocal microscope, as mentioned previously. An image was taken every time dsRed+ M cells were seen, maintaining spatial locations, to minimize double counting. Bacteria were enumerated for every red M cell region using Volocity software, and size and intensity limits were set.
Statistical Analysis
Results represent the means ± SEM of individual animals or replicate wells. Normality of the data values was checked, and the unpaired t-test was used to compare two groups. For qPCR, a one-tailed Mann-Whitney test was used to compare fold-increased values of DSS-treated versus water control. All graphs and statistical calculations were performed by using GraphPad Prism version 5.04 (GraphPad Software, La Jolla, CA). P < 0.05 was considered statistically significant.
Results
Epithelial Cell Changes in the Colon during DSS-Induced Inflammation
The main question addressed in this study is the possibility of M cell induction in the inflamed colon. We first studied the DSS model of colitis,25, 26 which mimics some of the clinical and histological features of human IBD. During the 7-day course of DSS treatment, mice showed consistent weight loss and colonic inflammation associated with histological changes and shortening of the colon (Figure 1, A–D).
Figure 1.

Disease course with dextran sodium sulfate (DSS) colitis. A: DSS treatment protocol: 5% DSS w/v was given to peptidoglycan recognition protein-short (PGRP-S)–dsRed transgenic mice ad libitum for 7 days. B: Transgenic mice treated with DSS show a significant weight loss compared with control (Ctrl) animals. Data assessed by unpaired t-test. C: DSS-treated mice show significant reduction in colon length, with data assessed by unpaired t-test. D: Hematoxylin and eosin staining indicating inflammation, ulceration, and loss of crypt architecture (arrows) in DSS-treated mice. Blinded pathology scoring (M.G.N.) indicates increased pathology in DSS-treated animals; data assessed by unpaired t-test. Data represent means ± SEM (B–D). n = 3 mice per group (B); n = 5 mice per group (C); n = 3 to 4 mice per group (D). ∗P ≤ 0.05, ∗∗P ≤ 0.01, and ∗∗∗P ≤ 0.001.
To develop an objective method to assess mucosal epithelium changes during inflammation, we performed surface area scans of colonic epithelium using scanning electron microscopy. The dominant identifiable cells in the epithelium are enterocytes, with scattered goblet cells and M cells. These latter two cells are morphologically distinct from the smooth background of enterocytes, and stand out as isolated cells breaking the smooth pattern of the background microvilli brush border. Our identification of M cells versus goblet cells was dependent on surface features and correlates with known transmission electron microscopy–based characteristics. Thus, in addition to the absence of a compact apical brush border, goblet cells have recognizable surface bumps from the apical mucus granules, whereas M cells have either a smooth surface or disorganized thick microvilli (Figure 2, A and B). Under normal conditions, M cells in the colon are limited to colonic patches29, 30, 31; unlike the much larger PPs in the small intestine, they are found densely arranged over small follicles lying deep in folds of colonic tissue (Figure 2, C and D).
Figure 2.
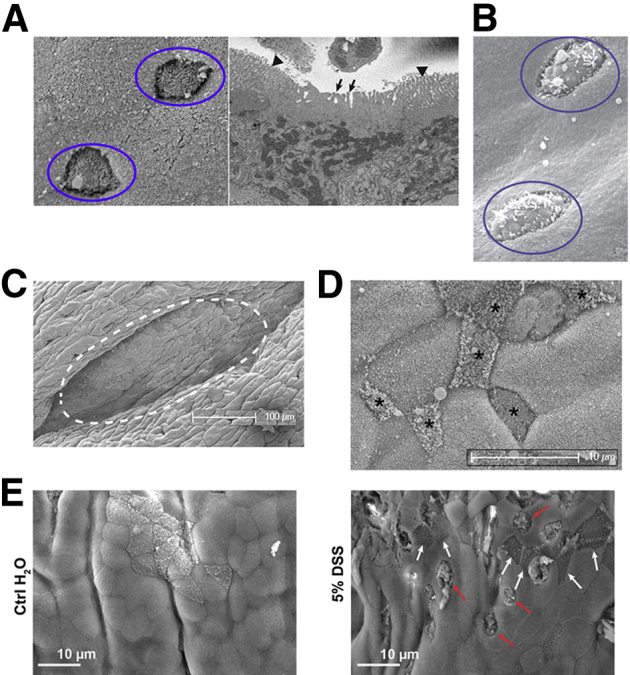
Scanning electron microscopy scans of colonic epithelium. A: Typical surface morphology of M cells (circles in left panel) against a background of uniform enterocytes, corroborated by an image from three-dimensional electron microscopy (right panel), showing an apical surface with thick disorganized projections characterized as fat microvilli (arrows in right panel) distinguished from neighboring compact brush border (arrowheads), which can also merge into a smooth apical surface. B: Morphology of goblet cells (circles), showing surface bumps from apical mucus granules. C: Lower magnification of typical colonic patch (dotted line), found deep within a fold in the colonic surface. D: Higher magnification showing dense arrangement of colonic patch M cells with varying morphologies (asterisks). E: Goblet cells (red arrows) and M cells (white arrows) across the surface of control and dextran sodium sulfate (DSS)–induced colonic epithelium.
On the basis of random electron microscopy scans of colon, DSS treatment induced an apparent increase in M cells, although often they were isolated cells not associated with identifiable colonic patches (Figure 2E). Therefore, to assess the overall induction of M cells, blinded observers (including K.M.B. and M.G.N.) were asked to assay the density of M cells and goblet cells in control and DSS-treated mice from electron microscopy scans of control and DSS-treated colon. For consistency, the distal colon was used for these assays, in part because colonic patches were already present for comparison in control colonic tissue. Observers were able to characterize many of these cells as M cells versus goblet cells, but unfortunately many cells could not confidently be placed in either category and so were placed in intermediate undefined categories. Table 1 shows representative data (from one observer), showing that despite the undefined categories, there was a highly significant increase in the density of goblet cells in DSS-treated mice. There was a slight increase in clearly identifiable M cells in DSS-treated mice, but the increase was not statistically significant, perhaps in part because overall numbers were so much lower than both goblet cells and undefined cells. Thus, although DSS appeared to induce a strong increase in goblet cell density, it could not be unequivocally established whether M cell numbers were increased. This might be compounded by the inability of scanning electron microscopy to visualize cells deep in the folds of the tissue, possibly missing induced colonic patches.
Table 1.
Scanning Electron Microscopy Scans of Colon
| Variable | M cell | M cell | Goblet | Goblet | Uncertain | Uncertain |
|---|---|---|---|---|---|---|
| Microvilli morphology | 1: Bare and smooth | 2: Fat microvilli and smooth surface | 3: Bare and bumpy | 4: Fat microvilli and bumpy | 5: Fat microvilli and organized | 6: Fat microvilli and disorganized |
| DSS treated (scanning electron microscopy) | 4.06 (1.6) | 9.61 (2.8) | 22.3 (4.3) | 63.7 (7.2) | 18.4 (5.1) | 24.2 (6.3) |
| Water control (SEM) | 2.83 (1.3) | 6.47 (1.8) | 7.24 (2.8) | 36.1 (6.4) | 24.0 (6.9) | 12.8 (4.4) |
| P value | 0.56 | 0.35 | 0.0057∗ | 0.0075∗ | 0.52 | 0.15 |
Data presented as cells per 20,000 mm2. Blinded scanning electron microscopic images (six images from each of the three mice per treatment group) were scored by one observer into six morphological categories. DSS treatment is 5% for 7 days. Counts indicate increases in goblet cells and slightly increased M cell–like cells but also uncertain types.
DSS, dextran sodium sulfate.
P < 0.05.
The identification of M cells in mucosal epithelium is limited to only a few methods, including transmission electron microscopy,29, 32 which is not quantifiable in whole tissue, and scanning electron microscopy, as shown herein. In the mouse, identification of M cells can rely on detection of a fucose moiety (eg, lectin UEA-1 binding) on the surface of both PP and villous M cells.33 However, because terminal fucose can also be a feature of immature glycoproteins and mucus in goblet cells, this can be an unreliable marker, especially in the colon. Moreover, there are no other lectins that can identify more than only a subset of M cells in the colon.33, 34, 35
A few genes have also been identified as specific for expression in M cells, including the genes gp236 and PGRP-S.37 Unfortunately, antibody staining for the gp2 protein has, in our hands, been of limited use in quantitative analysis to its variable staining of intracellular granules.12 Therefore, we have instead used a transgene reporter with the PGRP-S promoter driving expression of the dsRed coding sequence (PGRP-S–dsRed transgenic mice12); this transgene is expressed in mouse M cells (and in neutrophils), and in the nasopharynx-associated lymphoid tissue and PP epithelium showed nearly 100% coincidence with UEA-1 lectin binding. Expression of the PGRP-S–dsRed transgene therefore appears to provide a reasonable M cell marker in the colon as well; we found it was expressed strongly specifically in a subset of colonic patch epithelium (Figure 3A) similar to expression in follicle epithelium of small intestine PPs (Figure 3B).
Figure 3.

Colonic patch and dextran sodium sulfate (DSS)–induced M cell expression of peptidoglycan recognition protein-short–dsRed transgene reporter. A: dsRed+ epithelial cells overlying normal colonic patches, stained for GP2 (green). B: dsRed+ epithelium in Peyer's patches in the small intestine of DSS-treated mice, stained for GP2 (green). C: Whole tissue false-color fluorescence images of colon in DSS-treated mice showing induction of dsRed reporter. D: Confocal image of lamina propria showing infiltrating dsRed+ neutrophils (inset) that are also Ly6G+ (orange), whereas dsRed+ epithelial cells are Ly6G negative. E: Most epithelial dsRed+ cells are positive for gp2 (green), confirming their identity as M cells. Dotted lines in B, D, and E indicate the epithelial basement membrane.
We surveyed the induction of dsRed+ epithelial M cells in the small intestine and colon of control and DSS-treated mice, and found significant increases in M cell numbers. We used several different methods to quantify M cell induction. Histologically, we used whole mounts of colonic tissue to survey the surface of the epithelium and count M cells over a specific area, and in separate studies we took cross sections of tissue to count the numbers of M cells per length of the cross-sectional epithelium. In the DSS-treated colon, whole tissue imaging showed significant increases in the expression of dsRed (Figure 3C), which includes the dsRed in infiltrating neutrophils expressing Ly6G in the lamina propria (Figure 3D), but also epithelial M cell induction (Figure 3E). These epithelial dsRed+ cells also stained positive for the M cell protein gp2, and negative for the neutrophil marker Ly6G (Figure 3D).
Assays for gene expression in the colon showed the induction of inflammatory cytokines and genes associated with neutrophil infiltration and M cell induction (Figure 4). qPCR assays showed expression of the neutrophil-associated gene lactoferrin, the M cell protein gp2, and the transgene reporter dsRed. In addition, the cytokine TNF-α and RANKL were also increased in the colonic tissue. In sum, histological surveys, transgene reporter expression, and gene transcript data altogether confirm that M cells are induced in the colon of DSS-treated mice.
Figure 4.

Quantitative PCR (qPCR) assays for tissue expression of cytokine and cell-specific gene transcripts in dextran sodium sulfate (DSS) colitis. A: qPCR was used to detect M cell–associated genes expressed during colonic inflammation. DSS-treated animals show up-regulation of tumor necrosis factor (TNF)-α, dsRed, lactoferrin, and GP2 compared with control (Ctrl). All DSS-treated values are significantly increased relative to water control (P < 0.05) by one-tailed Mann-Whitney test. B: qPCR assay for tissue expression of RANKL also shows induction by DSS treatment of both BALB/c and peptidoglycan recognition protein-short (PGRP-S)–dsRed transgenic mice; both are significantly increased relative to water control (P < 0.05) by one-tailed Mann-Whitney test. Data represent means ± SEM (A). n = 3 mice per group (A). RANKL, receptor activator of nuclear factor kappa-B ligand.
Induced Colonic M Cells and Relationship to Organized Lymphoid Tissue
Conventional small-intestinal M cells are found overlying organized lymphoid tissues, such as PP and isolated lymphoid follicles (ILF); upper airway M cells are similarly associated with nasopharynx-associated lymphoid tissue. By contrast, villous M cells are not obviously associated with any lymphocyte aggregates and can be found as clusters at the tips of intestinal villi or as isolated sporadic cells. In the colon, DSS-induced inflammation is far less organized with both neutrophil and lymphocytic infiltrates. The distribution of induced dsRed+ M cells includes both sporadic isolated cells and small clusters, so we looked for organized lymphoid tissues that may resemble PP of ILF.
Organized lymphoid tissues are characterized by the presence of densely packed B cell follicles around CXCL13+ stromal cells and a network of ER-TR7+ reticular fibroblasts providing a scaffold for the lymphoid cells (Figure 5A). Colonic infiltrates in DSS-treated mice had far fewer B220+ B cells (Figure 5B). In the colon of DSS-treated mice, some expression of CXCL13 and ER-TR7 was detectable (Figure 5C), though not with the compact organization nor intensity seen in conventional PP and ILF. These results suggest that induction of M cells may be because of a direct influence of infiltrating cells on colonic crypt stem cells, even in the absence of well-organized lymphoid follicles.
Figure 5.

Colonic M cells associated with poorly organized follicles. A: CXCL13 expression in small intestine Peyer's patch (PP) and colon infiltrates. Images show CXCL13 staining of PP in control (Ctrl; left panels) and dextran sodium sulfate (DSS)–treated (middle panels) animals, respectively. CXCL13 staining is strong in Peyer's patch of control and DSS-treated animals. Right panels: Colonic infiltrates below induced M cells are essentially devoid of CXCL13. B: Staining of colon infiltrates shows relative paucity of B220+ B cells underlying induced dsRed+ M cells, consistent with low CXCL13 expression. C: ER-TR7 is a marker of reticular fibroblasts associated with the Peyer's patch stromal network. Left and middle panels: ER-TR7 staining of Peyer's patch in water and DSS-treated animals, respectively. Right panels: ER-TR7 identifies a few cells among colonic infiltrates of DSS-treated mice. Dotted lines indicate basement membrane to show relationship between epithelium and underlying infiltrates.
Anti–TNF-α Abrogates M Cell Induction
Our previous studies showed that treatment of the colonic carcinoma cell line Caco-2BBe with inflammatory cytokines (TNF-α plus lymphotoxin-βR agonist) induced some M cell–associated gene transcripts,11 so it was possible that DSS-induced M cells were also dependent, in part, on TNF-α. This is of particular interest because clinical therapy of IBD often involves TNF-α blockade. DSS-treated mice showed increased levels of TNF-α by qPCR (Figure 4). Injections of anti–TNF-α antibody on days 0, 3, and 5 of DSS treatment were effective in reducing detectable tissue TNF-α levels (Figure 6, A and B).
Figure 6.

Anti–tumor necrosis factor (TNF)-α abrogates M cell induction during dextran sodium sulfate (DSS) treatment. A: Schematic representation of the dual treatment of DSS and anti–TNF-α in this study. B: Reduction of TNF-α in anti–TNF-α–treated animals is confirmed using enzyme-linked immunosorbent assay. DSS-treated animals show increased TNF-α levels in the colon compared with controls; mice given anti–TNF-α during DSS show undetectable levels of TNF-α. Data assessed by unpaired t-test. C: M cell induction is abrogated by anti–TNF-α on the basis of counts of confocal imaging of epithelial dsRed+ cells: DSS induces significant numbers of M cells compared with control (Ctrl), whereas anti–TNF-α–treated animals show reduced M cell induction, not significantly different from control. Counts were from individual confocal micrographs. Statistics were determined by unpaired t-test. Data are given as means ± SEM (B and C). n = 4 to 6 mice per group (B). ∗∗P ≤ 0.01, ∗∗∗P ≤ 0.001, and ∗∗∗∗P ≤ 0.0001. ND, not detectable; PGRP-S, peptidoglycan recognition protein-short.
Using quantitative histological assays, we found that the anti–TNF-α antibody treatment also effectively blocked the induction of dsRed+ M cells in the colon (Figure 6C). Thus, although parallel requirements for other cytokines (eg, RANKL or lymphotoxin) may also be present, M cell induction in the colon appears to be, in large part, dependent on the presence of TNF-α. Interestingly, at least in this version of the DSS colitis model (a relatively high dose), anti–TNF-α antibody treatment had minimal effects on the clinical and histopathological development of disease (Figure 7, A–D). This suggests that at this DSS dose, the clinical effects were not solely dependent on TNF-α; in contrast, the tissue responses leading to M cell induction are apparently more closely tied to the cytokines in the tissue environment, especially TNF-α.
Figure 7.

Despite reduced M cell induction, clinical course of disease is not reduced by anti–tumor necrosis factor-α (TNF-α) treatment. A: Under the shown conditions, weight loss is not abrogated by treatment. B: Whole tissue imaging of colon shows persistence of dsRed signal despite anti–TNF-α treatment, probably because of persistent dsRed+ neutrophil infiltration. C: Histopathology is not significantly affected by anti–TNF-α treatment. Hematoxylin and eosin staining shows inflammation, ulceration, and loss of crypt architecture (arrows) in dextran sodium sulfate (DSS)–treated mice. D: Blinded pathology scoring indicates severe pathology in anti–TNF-α–treated animals compared with control. Data were assessed by unpaired t-test. Data represent the means ± SEM (D). n = 3 mice per group (D). ∗P ≤ 0.05, ∗∗P ≤ 0.01, and ∗∗∗P ≤ 0.001. Ctrl, control.
Infectious Colitis Caused by C. rodentium Also Induces Colonic M Cells
Although the exact mechanism of IBD pathology remains elusive, evidence suggests that intestinal inflammation is driven by dysregulated immune responses directed against the microbiota.38 So, to test whether the induction of M cells is a general phenomenon of intestinal inflammation, we also used C. rodentium, an infectious model of colonic inflammation. Citrobacter rodentium belongs to the group of attaching and effacing bacteria and is a murine homolog of enterohemorrhagic Escherichia coli and enteropathogenic E. coli, which are major causative agents of diarrheal diseases.39 Moreover, C. rodentium inflammation is driven by both robust Th1 and Th17 responses.27, 39, 40, 41 We wanted to determine whether M cells were also induced in the colon at the peak of C. rodentium infection (days 6 and 10). Mice infected with C. rodentium (Figure 8A) exhibited high bacterial burdens at days 6 and 10 after infection. At day 6 and day 10 after infection, mice had the expected severe crypt hyperplasia, and moderate reduction in colon length compared with naïve animals.
Figure 8.

Intestinal inflammation caused by Citrobacter rodentium induces colonic M cells. A: Schematic depiction of C. rodentium infection used in this study. B: Representative scanning electron micrograph further confirming the induction of colonic M cells in C. rodentium–infected mice at day (D) 6 and D10 after infection. Arrows indicate M cells. C: Representative confocal micrographs indicate the presence of dsRed+ M cells in the colonic epithelium of C. rodentium–infected mice at D6 and D10 after infection. Dotted lines indicate the epithelial basement membrane. D: M cell numbers quantified using whole mount tissue imaging. Graph shows M cell numbers increase at D6 and D10 after infection compared with naïve mice. Data are assessed by unpaired t-test. Data represent the means ± SEM (D). n = 3 mice per group (D). ∗∗P ≤ 0.01. PGRP-S, peptidoglycan recognition protein-short.
Infected mice at both day 6 and day 10 after infection showed the presence of dsRed+ M cells within the colonic epithelium, evidenced by scanning electron microscopy (Figure 8B) and confirmed by confocal microscopy (Figure 8C). Quantification of M cell induction at day 6 and day 10 after infection using whole mount tissue imaging revealed increased M cells numbers compared with their naïve controls (Figure 8D).
To further study the parallels between DSS and C. rodentium models of colonic inflammation in the context of M cell induction, we studied the regulation of M cell and neutrophil related genes. Consistent with M cell induction, we again saw up-regulation of the M cell–specific transcripts for gp2 at both day 6 and day 10 (Figure 9A). Similar to the DSS model, we saw up-regulation of transcripts encoding TNF-α, dsRed, and lactoferrin, at both days 6 and 10 in both the proximal and distal colon (Figure 9B). As with the DSS model, the M cells were associated with poorly organized mononuclear infiltrates. At days 6 and 10, these aggregates had essentially no CXCL13 staining (data not shown), but stained weakly positive for ER-TR7 (Figure 9C). Taken together, both the DSS and C. rodentium data suggest a role for PP-type M cells during colonic inflammation, and their presence may be an important correlate for human disease.
Figure 9.

Detection of cytokine and cell-specific genes in Citrobacter colitis. A: Colonic epithelium showing induction of both dsRed and M cell–specific marker GP2. B: Quantitative PCR was used to identify M cell genes induced during intestinal inflammation. Day (D) 6 and D10 infected animals show up-regulation of tumor necrosis factor (TNF)-α, dsRed, lactoferrin, and GP2 compared with naïve animals, comparable to those seen in dextran sodium sulfate–treated animals. C: Induced M cells in C. rodentium infected mice are associated with poorly organized infiltrates compared with Peyer's patches (PP); in D6 and D10 infected mice colonic follicles stained weakly positive for ER-TR7. Dotted lines indicate basement membrane to show relationship between epithelium and underlying infiltrates. Data represent the means ± SEM (B). n = 4 mice per group (B). eGFP, enhanced green fluorescent protein.
Induced M Cells and Transcytosis
The induction of significantly increased numbers of M cells in the colon would also imply increased access of luminal bacteria to the colonic lamina propria. To confirm that these induced M cells have transcytosis function, Y. enterocolitica was used in uptake studies; it binds to β1-integrin on the apical surface of M cells to enable endocytosis.42 Suspensions of Y. enterocolitica (GFP) were injected at the proximal colon of anesthetized DSS-treated animals. As a control, the PRGP-S–dsRed transgene was also backcrossed to the B cell–deficient IgH6 knockout strain. The absence of B cells results in deficient M cell–dependent transcytosis, even though M cell lineage commitment from crypt stem cells is normal.43, 44 Regions of dsRed+ M cells were identified, and transcytosis was quantified (Figure 10, A and B). The induction of clinical disease and M cell numbers was similar in both strains, but the uptake of bacteria below the induced M cells was significantly lower in the B cell–deficient mice. These data show that the induced colonic M cells are not simply a phenotypic marker of inflammation because they can provide active transcytosis of luminal microbes.
Figure 10.

Induced M cells are capable of transcytosis. A: Dextran sodium sulfate (DSS) peptidoglycan recognition protein-short (PGRP-S)+IgH6KO treated mice show similar clinical induction of colitis and induction of M cells. Left panel: Representative M cell–dependent (red) uptake of Yersinia enterocolitica (green) in DSS-treated PGRP-S–dsRed mice. Right panel: Induction of M cells (red) and uptake by DSS-treated PGRP-S+IgH6KO. B: Quantification of Y. enterocolitica uptake; DSS PGRP-S+ treated animals show higher Y. enterocolitica uptake compared with PGRP-S+IgH6KO consistent with the known effect of B-cell deficiency on M-cell function. Data represent the means ± SEM (B). n = 3 mice per group (B). ∗∗∗P ≤ 0.001 (t-test).
Discussion
M cells play an important role in the immune surveillance of mucosal tissues, leading to both cellular immune responses and the production of secretory IgA. Yet, the role of M cells in chronic inflammation in the colon and the potential relevance to clinical IBD has largely been overlooked. It may be that the difficulty in reliably identifying M cells in the colon has contributed to this oversight. Our present studies have now provided support for the notion that inflammatory cytokines, such as TNF-α, contribute to the induction of M cells in the colon, with consequent effects on the access of luminal microbes to the intestinal lamina propria. Whether the effect of TNF-α is directly on the epithelial cells, underlying stromal cells, or other tissue inducers is not known, although we suspect that at least part of the effector function is directly on the epithelial M cell precursors in the crypt, on the basis of our in vitro studies on Caco-2BBe cells.11
The reduction in M cell induction by anti–TNF-α blockade suggests that the proinflammatory cytokines have a parallel role in promoting tissue development in much the same way that proinflammatory cytokines promote tertiary lymphoid tissue development in other chronic inflammatory settings, such as autoimmune thyroiditis and autoimmune diabetes.45 In the central nervous system, TNF-α also appears to be important in mediating tissue recovery from demyelination by promoting oligodendrocyte proliferation.46 Interestingly, anti–TNF-α blockade has actually been reported to worsen multiple sclerosis symptoms in clinical trials.47, 48, 49 In this context, the induction of M cells in the presence of colonic inflammation might be viewed as a protective or restorative function, although at this stage a specific mechanism is not clear. For example, is the potential for increased access of luminal microbes to the lamina propria helpful in some way, such as promoting the development of immune regulation? There are few studies on restorative mechanisms in models of IBD, so the role of M cells in these mechanisms will require further study. In the meantime, it is worth asking whether medical treatment with anti–TNF-α blockade has a secondary consequence apart from the reduction in the proinflammatory cytokine effects, and whether this effect may, in fact, reduce the tissue capacity to restore tissue homeostasis.
Finally, the association between M cell induction and colonic inflammation, whether by infectious causes or autoimmune dysregulation, may provide a potentially useful clinical diagnostic. That is, once more reliable tests for M cell induction are developed for human tissues, biopsy specimens of colonic tissue might be surveyed for M cell induction as evidence of chronic inflammation.
Acknowledgments
We thank Kathy Vu, Joseph Pham, Juliane Lieu, and Olivia Sakhon for technical assistance; Joan Mecsas for the Yersinia enterocolitica isolates; and Mathias Rommelfanger for assistance with the scanning electron microscopy and critical-point drying.
All authors have approved the final version of the manuscript. D.D.L. is the guarantor of this work and, as such, had full access to the data in the study and takes responsibility for the integrity of the data and accuracy of the data analysis.
Footnotes
Supported by NIH grants AI063426 and AI098973 (D.D.L.) and AI091759 (M.G.N.) and the University of California, Riverside, National Science Foundation Graduate Research Fellowship Program and Dissertation Year Fellowship. S.P. was supported by award T34GM062756 from the National Institute of General Medical Sciences.
Disclosures: None declared.
References
- 1.Kraehenbuhl J.P., Neutra M.R. Epithelial M cells: differentiation and function. Annu Rev Cell Dev Biol. 2000;16:301–332. doi: 10.1146/annurev.cellbio.16.1.301. [DOI] [PubMed] [Google Scholar]
- 2.Bennett K.M., Walker S.L., Lo D.D. Epithelial microvilli establish an electrostatic barrier to microbial adhesion. Infect Immun. 2014;82:2860–2871. doi: 10.1128/IAI.01681-14. [DOI] [PMC free article] [PubMed] [Google Scholar]
- 3.Jang M.H., Kweon M.-N., Iwatani K., Yamamoto M., Terahara K., Sasakawa C., Suzuki T., Nochi T., Yokota Y., Rennert P.D., Hiroi T., Tamagawa H., Iijima H., Kunisawa J., Yuki Y., Kiyono H. Intestinal villous M cells: an antigen entry site in the mucosal epithelium. Proc Natl Acad Sci U S A. 2004;101:6110–6115. doi: 10.1073/pnas.0400969101. [DOI] [PMC free article] [PubMed] [Google Scholar]
- 4.Vondenhoff M.F.R., Kraal G., Mebius R.E. Lymphoid organogenesis in brief. Eur J Immunol. 2007;37 Suppl 1:S46–S52. doi: 10.1002/eji.200737528. [DOI] [PubMed] [Google Scholar]
- 5.Mueller S.N., Germain R.N. Stromal cell contributions to the homeostasis and functionality of the immune system. Nat Rev Immunol. 2009;9:618–629. doi: 10.1038/nri2588. [DOI] [PMC free article] [PubMed] [Google Scholar]
- 6.Nishikawa S.-I., Honda K., Vieira P., Yoshida H. Organogenesis of peripheral lymphoid organs. Immunol Rev. 2003;195:72–80. doi: 10.1034/j.1600-065x.2003.00063.x. [DOI] [PubMed] [Google Scholar]
- 7.Knoop K.A., Kumar N., Butler B.R., Sakthivel S.K., Taylor R.T., Nochi T., Akiba H., Yagita H., Kiyono H., Williams I.R. RANKL is necessary and sufficient to initiate development of antigen-sampling M cells in the intestinal epithelium. J Immunol. 2009;183:5738–5747. doi: 10.4049/jimmunol.0901563. [DOI] [PMC free article] [PubMed] [Google Scholar]
- 8.de Lau W., Kujala P., Schneeberger K., Middendorp S., Li V.S.W., Barker N., Martens A., Hofhuis F., DeKoter R.P., Peters P.J., Niewenhuis E., Clevers H. Peyer's patch M cells derived from Lgr5(+) stem cells require SpiB and are induced by RankL in cultured “miniguts.”. Mol Cell Biol. 2012;32:3639–3647. doi: 10.1128/MCB.00434-12. [DOI] [PMC free article] [PubMed] [Google Scholar]
- 9.Spits H., Artis D., Colonna M., Diefenbach A., Di Santo J.P., Eberl G., Koyasu S., Locksley R.M., McKenzie A., Mebius R.E., Powrie F., Vivier E. Innate lymphoid cells: a proposal for uniform nomenclature. Nat Rev Immunol. 2013;13:145–149. doi: 10.1038/nri3365. [DOI] [PubMed] [Google Scholar]
- 10.Gebert A., Fassbender S., Werner K., Weissferdt A. The development of M cells in Peyer's patches is restricted to specialized dome-associated crypts. Am J Pathol. 1999;154:1573–1582. doi: 10.1016/S0002-9440(10)65410-7. [DOI] [PMC free article] [PubMed] [Google Scholar]
- 11.Wang J., Lopez-Fraga M., Rynko A., Lo D.D. TNFR and LTbetaR agonists induce follicle-associated epithelium and M cell specific genes in rat and human intestinal epithelial cells. Cytokine. 2009;47:69–76. doi: 10.1016/j.cyto.2009.05.001. [DOI] [PMC free article] [PubMed] [Google Scholar]
- 12.Wang J., Gusti V., Saraswati A., Lo D.D. Convergent and divergent development among M cell lineages in mouse mucosal epithelium. J Immunol. 2011;187:5277–5285. doi: 10.4049/jimmunol.1102077. [DOI] [PMC free article] [PubMed] [Google Scholar]
- 13.Terahara K., Yoshida M., Igarashi O., Nochi T., Pontes G.S., Hase K., Ohno H., Kurokawa S., Mejima M., Takayama N., Yuki Y., Lowe A.W., Kyono H. Comprehensive gene expression profiling of Peyer's patch M cells, villous M-like cells, and intestinal epithelial cells. J Immunol. 2008;180:7840–7846. doi: 10.4049/jimmunol.180.12.7840. [DOI] [PubMed] [Google Scholar]
- 14.Fuss I.J., Neurath M., Boirivant M., Klein J.S., de la Motte C., Strong S.A., Fiocchi C., Strober W. Disparate CD4+ lamina propria (LP) lymphokine secretion profiles in inflammatory bowel disease. Crohn's disease LP cells manifest increased secretion of IFN-gamma, whereas ulcerative colitis LP cells manifest increased secretion of IL-5. J Immunol. 1996;157:1261–1270. [PubMed] [Google Scholar]
- 15.Sartor R.B. Mechanisms of disease: pathogenesis of Crohn's disease and ulcerative colitis. Nat Clin Pract Gastroenterol Hepatol. 2006;3:390–407. doi: 10.1038/ncpgasthep0528. [DOI] [PubMed] [Google Scholar]
- 16.Maeda M., Watanabe N., Neda H., Yamauchi N., Okamoto T., Sasaki H., Tsuji Y., Akiyama S., Tsuji N., Niitsu Y. Serum tumor necrosis factor activity in inflammatory bowel disease. Immunopharmacol Immunotoxicol. 1992;14:451–461. doi: 10.3109/08923979209005404. [DOI] [PubMed] [Google Scholar]
- 17.Breese E.J., Michie C.A., Nicholls S.W., Murch S.H., Williams C.B., Domizio P., Walker-Smith J.A., MacDonald T.T. Tumor necrosis factor alpha-producing cells in the intestinal mucosa of children with inflammatory bowel disease. Gastroenterology. 1994;106:1455–1466. doi: 10.1016/0016-5085(94)90398-0. [DOI] [PubMed] [Google Scholar]
- 18.Colombel J.F., Sandborn W.J., Reinisch W., Mantzaris G.J., Kornbluth A., Rachmilewitz D., Lichtiger S., D'Haens G., Diamond R.H., Broussard D.L., Tang K.L., van der Woude C.J., Rutgeerts P., SONIC Study Group Infliximab, azathioprine, or combination therapy for Crohn's disease. N Engl J Med. 2010;362:1383–1395. doi: 10.1056/NEJMoa0904492. [DOI] [PubMed] [Google Scholar]
- 19.Sandborn W.J., Gasink C., Gao L.-L., Blank M.A., Johanns J., Guzzo C., Sands B.E., Hanauer S.B., Targan S., Rutgeerts P., Ghosh S., deVilliers W.J.S., Panaccione R., Greenberg G., Schreiber S., Lichtiger S., Feagan B.G., CERTIFI Study Group Ustekinumab induction and maintenance therapy in refractory Crohn's disease. N Engl J Med. 2012;367:1519–1528. doi: 10.1056/NEJMoa1203572. [DOI] [PubMed] [Google Scholar]
- 20.Dubé P.E., Punit S., Polk D.B. Redeeming an old foe: protective as well as pathophysiological roles for tumor necrosis factor in inflammatory bowel disease. Am J Physiol Gastrointest Liver Physiol. 2015;308:G161–G170. doi: 10.1152/ajpgi.00142.2014. [DOI] [PMC free article] [PubMed] [Google Scholar]
- 21.Arijs I., Quintens R., Van Lommel L., Van Steen K., De Hertogh G., Lemaire K., Schraenen A., Perrier C., Van Assche G., Vermeire S., Geboes K., Schuit F., Rutgeerts P. Predictive value of epithelial gene expression profiles for response to infliximab in Crohn's disease. Inflamm Bowel Dis. 2010;16:2090–2098. doi: 10.1002/ibd.21301. [DOI] [PubMed] [Google Scholar]
- 22.Walters T.D., Kim M.-O., Denson L.A., Griffiths A.M., Dubinsky M., Markowitz J., Baldassano R., Crandall W., Rosh J., Pfefferkorn M., Otley A., Heyman M.B., LeLeiko N., Baker S., Guthery S.L., Evans J., Ziring D., Kellermayer R., Stephens M., Mack D., Oliva-Hemker M., Patel A.S., Kirschner B., Moulton D., Cohen S., Kim S., Liu C., Essers J., Kugathasan S., Hyams J.S., PRO-KIDS Research Group Increased effectiveness of early therapy with anti-tumor necrosis factor-α vs an immunomodulator in children with Crohn's disease. Gastroenterology. 2014;146:383–391. doi: 10.1053/j.gastro.2013.10.027. [DOI] [PubMed] [Google Scholar]
- 23.Dziarski R., Platt K.A., Gelius E., Steiner H., Gupta D. Defect in neutrophil killing and increased susceptibility to infection with nonpathogenic gram-positive bacteria in peptidoglycan recognition protein-S (PGRP-S)-deficient mice. Blood. 2003;102:689–697. doi: 10.1182/blood-2002-12-3853. [DOI] [PubMed] [Google Scholar]
- 24.Jung S., Aliberti J., Graemmel P., Sunshine M.J., Kreutzberg G.W., Sher A., Littman D.R. Analysis of fractalkine receptor CX(3)CR1 function by targeted deletion and green fluorescent protein reporter gene insertion. Mol Cell Biol. 2000;20:4106–4114. doi: 10.1128/mcb.20.11.4106-4114.2000. [DOI] [PMC free article] [PubMed] [Google Scholar]
- 25.Okayasu I., Hatakeyama S., Yamada M., Ohkusa T., Inagaki Y., Nakaya R. A novel method in the induction of reliable experimental acute and chronic ulcerative colitis in mice. Gastroenterology. 1990;98:694–702. doi: 10.1016/0016-5085(90)90290-h. [DOI] [PubMed] [Google Scholar]
- 26.Whittem C.G., Williams A.D., Williams C.S. Murine colitis modeling using dextran sulfate sodium (DSS) J Vis Exp. 2010 doi: 10.3791/1652. (35):pii:1652. [DOI] [PMC free article] [PubMed] [Google Scholar]
- 27.Osborne L.C., Joyce K.L., Alenghat T., Sonnenberg G.F., Giacomin P.R., Du Y., Bergstrom K.S., Vallance B.A., Nair M.G. Resistin-like molecule α promotes pathogenic Th17 cell responses and bacterial-induced intestinal inflammation. J Immunol. 2013;190:2292–2300. doi: 10.4049/jimmunol.1200706. [DOI] [PMC free article] [PubMed] [Google Scholar]
- 28.Viennois E., Chen F., Laroui H., Baker M.T., Merlin D. Dextran sodium sulfate inhibits the activities of both polymerase and reverse transcriptase: lithium chloride purification, a rapid and efficient technique to purify RNA. BMC Res Notes. 2013;6:360. doi: 10.1186/1756-0500-6-360. [DOI] [PMC free article] [PubMed] [Google Scholar]
- 29.Owen R.L., Piazza A.J., Ermak T.H. Ultrastructural and cytoarchitectural features of lymphoreticular organs in the colon and rectum of adult BALB/c mice. Am J Anat. 1991;190:10–18. doi: 10.1002/aja.1001900103. [DOI] [PubMed] [Google Scholar]
- 30.Lochner M. Tertiary lymphoid tissues in the colon: friend and foe. Gut Microbes. 2011;2:193–197. doi: 10.4161/gmic.2.3.16732. [DOI] [PubMed] [Google Scholar]
- 31.Baptista A.P., Olivier B.J., Goverse G., Greuter M., Knippenberg M., Kusser K., Domingues R.G., Veiga-Fernandes H., Luster A.D., Lugering A., Randall T.D., Cupedo T., Mebius R.E. Colonic patch and colonic SILT development are independent and differentially regulated events. Mucosal Immunol. 2013;6:511–521. doi: 10.1038/mi.2012.90. [DOI] [PMC free article] [PubMed] [Google Scholar]
- 32.Owen R.L., Jones A.L. Epithelial cell specialization within human Peyer's patches: an ultrastructural study of intestinal lymphoid follicles. Gastroenterology. 1974;66:189–203. [PubMed] [Google Scholar]
- 33.Giannasca P.J., Giannasca K.T., Falk P., Gordon J.I., Neutra M.R. Regional differences in glycoconjugates of intestinal M cells in mice: potential targets for mucosal vaccines. Am J Physiol. 1994;267(6 Pt 1):G1108–G1121. doi: 10.1152/ajpgi.1994.267.6.G1108. [DOI] [PubMed] [Google Scholar]
- 34.Giannasca P.J., Giannasca K.T., Leichtner A.M., Neutra M.R. Human intestinal M cells display the sialyl Lewis A antigen. Infect Immun. 1999;67:946–953. doi: 10.1128/iai.67.2.946-953.1999. [DOI] [PMC free article] [PubMed] [Google Scholar]
- 35.Pappo J. Generation and characterization of monoclonal antibodies recognizing follicle epithelial M cells in rabbit gut-associated lymphoid tissues. Cell Immunol. 1989;120:31–41. doi: 10.1016/0008-8749(89)90172-x. [DOI] [PubMed] [Google Scholar]
- 36.Yu S., Lowe A.W. The pancreatic zymogen granule membrane protein, GP2, binds Escherichia coli Type 1 fimbriae. BMC Gastroenterol. 2009;9:58. doi: 10.1186/1471-230X-9-58. [DOI] [PMC free article] [PubMed] [Google Scholar]
- 37.Lo D., Tynan W., Dickerson J., Mendy J., Chang H.-W., Scharf M., Byrne D., Brayden D., Higgins L., Evans C., O'Mahony D.J. Peptidoglycan recognition protein expression in mouse Peyer's Patch follicle associated epithelium suggests functional specialization. Cell Immunol. 2003;224:8–16. doi: 10.1016/s0008-8749(03)00155-2. [DOI] [PubMed] [Google Scholar]
- 38.Jostins L., Ripke S., Weersma R.K., Duerr R.H., McGovern D.P., Hui K.Y. Host-microbe interactions have shaped the genetic architecture of inflammatory bowel disease. Nature. 2012;491:119–124. doi: 10.1038/nature11582. [DOI] [PMC free article] [PubMed] [Google Scholar]
- 39.Kaper J.B., Nataro J.P., Mobley H.L. Pathogenic Escherichia coli. Nat Rev Microbiol. 2004;2:123–140. doi: 10.1038/nrmicro818. [DOI] [PubMed] [Google Scholar]
- 40.Geddes K., Rubino S.J., Magalhaes J.G., Streutker C., Le Bourhis L., Cho J.H., Robertson S.J., Kim C.J., Kaul R., Philpott D.J., Girardin S.E. Identification of an innate T helper type 17 response to intestinal bacterial pathogens. Nat Med. 2011;17:837–844. doi: 10.1038/nm.2391. [DOI] [PubMed] [Google Scholar]
- 41.Collins J.W., Chervaux C., Raymond B., Derrien M., Brazeilles R., Kosta A., Chambaud I., Crepin V.F., Frankel G. Fermented dairy products modulate Citrobacter rodentium-induced colonic hyperplasia. J Infect Dis. 2014;210:1029–1041. doi: 10.1093/infdis/jiu205. [DOI] [PMC free article] [PubMed] [Google Scholar]
- 42.Clark M.A., Hirst B.H., Jepson M.A. M-cell surface beta1 integrin expression and invasin-mediated targeting of Yersinia pseudotuberculosis to mouse Peyer's patch M cells. Infect Immun. 1998;66:1237–1243. doi: 10.1128/iai.66.3.1237-1243.1998. [DOI] [PMC free article] [PubMed] [Google Scholar]
- 43.Golovkina T.V., Shlomchik M., Hannum L., Chervonsky A. Organogenic role of B lymphocytes in mucosal immunity. Science. 1999;286:1965–1968. doi: 10.1126/science.286.5446.1965. [DOI] [PubMed] [Google Scholar]
- 44.Hsieh E.H., Fernandez X., Wang J., Hamer M., Calvillo S., Croft M., Kwon B.S., Lo D.D. CD137 is required for M cell functional maturation but not lineage commitment. Am J Pathol. 2010;177:666–676. doi: 10.2353/ajpath.2010.090811. [DOI] [PMC free article] [PubMed] [Google Scholar]
- 45.Kratz A., Campos-Neto A., Hanson M.S., Ruddle N.H. Chronic inflammation caused by lymphotoxin is lymphoid neogenesis. J Exp Med. 1996;183:1461–1472. doi: 10.1084/jem.183.4.1461. [DOI] [PMC free article] [PubMed] [Google Scholar]
- 46.Arnett H.A., Mason J., Marino M., Suzuki K., Matsushima G.K., Ting J.P. TNF alpha promotes proliferation of oligodendrocyte progenitors and remyelination. Nat Neurosci. 2001;4:1116–1122. doi: 10.1038/nn738. [DOI] [PubMed] [Google Scholar]
- 47.The Lenercept Multiple Sclerosis Study Group and The University of British Columbia MS/MRI Analysis Group: TNF neutralization in MS: results of a randomized, placebo-controlled multicenter study. Neurology. 1999;53:457–465. [PubMed] [Google Scholar]
- 48.van Oosten B.W., Barkhof F., Truyen L., Boringa J.B., Bertelsmann F.W., von Blomberg B.M., Woody J.N., Hartung H.P., Polman C.H. Increased MRI activity and immune activation in two multiple sclerosis patients treated with the monoclonal anti-tumor necrosis factor antibody cA2. Neurology. 1996;47:1531–1534. doi: 10.1212/wnl.47.6.1531. [DOI] [PubMed] [Google Scholar]
- 49.Gregory A.P., Dendrou C.A., Attfield K.E., Haghikia A., Xifara D.K., Butter F., Poschmann G., Kaur G., Lambert L., Leach O.A., Promel S., Punwani D., Felce J.H., Davis S.J., Gold R., Nielsen F.C., Siegel R.M., Mann M., Bell J.I., McVean G., Fugger L. TNF receptor 1 genetic risk mirrors outcome of anti-TNF therapy in multiple sclerosis. Nature. 2012;488:508–511. doi: 10.1038/nature11307. [DOI] [PMC free article] [PubMed] [Google Scholar]