

Abstract
This study investigated for the first time the genomewide DNA methylation changes of noncoding RNA genes in the temporal cortex samples from individuals with Alzheimer's disease (AD). The methylome of 10 AD individuals and 10 age-matched controls were obtained using Illumina 450 K methylation array. A total of 2,095 among the 15,258 interrogated noncoding RNA CpG sites presented differential methylation, 161 of which were associated with miRNA genes. In particular, 10 miRNA CpG sites that were found to be hypermethylated in AD compared to control brains represent transcripts that have been previously associated with the disease. This miRNA set is predicted to target 33 coding genes from the neuregulin receptor complex (ErbB) signaling pathway, which is required for the neurons myelination process. For 6 of these miRNA genes (MIR9-1, MIR9-3, MIR181C, MIR124-1, MIR146B, and MIR451), the hypermethylation pattern is in agreement with previous results from literature that shows downregulation of miR-9, miR-181c, miR-124, miR-146b, and miR-451 in the AD brain. Our data implicate dysregulation of miRNA methylation as contributor to the pathogenesis of AD.
1. Introduction
Increasing evidence indicates that epigenetic mechanisms may contribute to the pathogenesis of Alzheimer's disease (AD) [1, 2]. DNA methylation, the addition of methyl group to the 5′-position cytosine of CpG dinucleotides, is an important epigenetic mark involved in the control of gene expression. Usually, when located in the promoter region, DNA methylation is associated with gene silencing, either inhibiting binding of transcription factors, or through the recruitment of methyl-binding proteins and their associated chromatin remodeling factors [3]. It is estimated that ~70% of the CpGs are methylated in the human genome; however, the distribution of CpGs is not uniform and certain regions are referred as CpG islands, due to a higher than expected frequency of CpG dinucleotides [4]. In contrast to the general pattern, CpG islands are normally unmethylated or present low levels of methylation. Although DNA methylation was previously thought to be a static process after cellular differentiation, now it is known to be highly dynamic not only in early developmental phase, but also in adult human brain in response to neural activity [5].
Most recently, genomewide DNA methylation changes have been reported in AD brains [6]. Jager et al. demonstrated in AD prefrontal cortex that a subset of 71 CpG sites was differentially methylated and transcriptionally altered, affecting genes connected to a well-known AD susceptibility network. Also, the authors pointed out that these epigenetic changes might have occurred early in the pathological process, possibly contributing to extracellular β amyloid plaques accumulation. Although most AD methylation studies focus on protein coding genes, dysregulation of noncoding RNAs has become increasingly an important field of investigation.
MicroRNAs (miRNAs), a class of small noncoding RNAs that act as posttranscriptional regulators of gene expression, are the best characterized and most extensively studied class of noncoding RNAs [7]. Data from literature have shown that the expression of miRNAs is widely altered in AD brains [8]. Abnormal expression profile of a specific group of miRNAs in AD brains (let-7i, miR-9, miR-15, miR-146b, miR-181c, miR-210, miR-338, and miR-451) has been reported by different studies, but the mechanisms underlying such dysregulation still remain poorly understood [9, 10]. However, it is known that transcription silencing due to promoter CpG island hypermethylation is one of the most common mechanisms by which several tumor suppressor and miRNA genes are inactivated during tumorigenesis [11]. Considering that cancer and neurodegenerative disorders share common mechanisms of genetic and molecular alterations, the involvement of DNA methylation in the dysregulation of miRNA expression in AD brains is a reasonable supposition.
Here, we analyzed genomewide DNA methylation changes of noncoding RNAs, with particular interest on miRNAs, in postmortem temporal cortex samples from individuals with AD.
2. Casuistic and Methods
2.1. Postmortem Human Brain Samples
Postmortem human temporal cortex samples from 10 AD individuals with severe stage of the disease and their 10 age-matched controls were provided by the Brain Bank of the Brazilian Aging Brain Study Group (BBBABSG) [12]. Table 1 presents the characterization of the individuals included in this study. An independent sample set with the same clinical-pathological profile that the cohort used for methylation study (9 AD individuals and 10 controls, Supplementary Table 1 available online at http://dx.doi.org/10.1155/2016/2584940) was used for gene expression analysis. As a standard protocol for AD neuropathological diagnosis, the brain was examined macroscopically and 15 neurodegenerative disease-related structures were sampled for microscopic evaluation. Neuropathological examinations were carried out using immunohistochemistry following internationally accepted guidelines. CERAD (Consortium to Establish a Registry for Alzheimer's Disease) criteria were used to classify the β-amyloid neuritic plaque burden and the distribution of neurofibrillary tangles was classified according to the H. Braak and E. Braak staging system [13]. The neuropathological diagnosis of AD was made in those cases that showed at least Braak stage III and CERAD moderate. The usual neuropathological guidelines were used for other dementias and for Parkinson's disease [12]. The subject's clinical and functional statuses were assessed through a knowledgeable informant based on a validated clinical protocol that also includes cognitive evaluation by the Clinical Dementia Rating Scale (CDR) [14]. This protocol included a series of semistructured scales and questionnaires that cover major functional abilities and were validated for assessment with an informant. BBBABSG's procedures were approved by the ethical board of University of São Paulo Medical School and by the Brazilian Federal Health Department, which are based on international standards such as The Belmont Report [15] and The Helsinki Declaration [16]; also an informed written consent was obtained by the next-of kin [12]. Importantly, based on the informed consent provided by the BBBABSG's, there is no information whether the individuals were treated with drugs that could influence DNA methylation patterns.
Table 1.
Clinical data of control and Alzheimer's disease individuals investigated in the methylation study.
| Age at death (years) | Gender | CDR | Stages of senile changes | Cause of death | |||
|---|---|---|---|---|---|---|---|
| Braak | CERAD | LB | |||||
| Controls | |||||||
| 1 | 81 | F | 0 | 0 | 0 | — | Pulmonary edema |
| 2 | 97 | F | 0 | 0 | 0 | — | Pulmonary embolism |
| 3 | 85 | M | 0 | 0 | 0 | — | Acute myocardial infarction |
| 4 | 83 | M | 0 | 0 | 0 | — | Pulmonary edema |
| 5 | 83 | M | 0 | 0 | 0 | — | Pulmonary edema |
| 6 | 81 | F | 0 | 0 | 0 | — | Acute myocardial infarction |
| 7 | 85 | M | 0 | 0 | 0 | — | Pulmonary edema |
| 8 | 83 | M | 0 | 0 | 0 | — | Ischemic myocardial disease |
| 9 | 77 | F | 0 | 0 | 0 | — | Acute myocardial infarction |
| 10 | 81 | F | 0 | 0 | 0 | — | Acute myocardial infarction |
| Alzheimer's disease | |||||||
| 1 | 84 | F | 3 | 6 | C | — | Pulmonary edema |
| 2 | 82 | M | 3 | 6 | C | — | Ischemic myocardial disease |
| 3 | 80 | M | 3 | 5 | C | — | Pulmonary edema |
| 4 | 83 | F | 3 | 6 | C | — | Pulmonary embolism |
| 5 | 79 | F | 3 | 6 | C | — | Pneumonia |
| 6 | 86 | F | 3 | 5 | C | — | Pneumonia |
| 7 | 94 | F | 3 | 6 | C | — | Pulmonary edema |
| 8 | 83 | F | 3 | 6 | C | — | Pulmonary embolism |
| 9 | 80 | F | 3 | 5 | C | — | Pulmonary edema |
| 10 | 83 | F | 3 | 6 | C | — | Pneumonia |
Braak stage = neurofibrillary tangle; CERAD (Consortium to Establish a Registry for Alzheimer's Disease) = neuritic plaques; LB = Lewy body; CDR = Clinical Dementia Rate.
2.2. Genomewide DNA Methylation Analysis
Genomic DNA was isolated from each postmortem temporal cortex sample of AD and control individuals using a standard phenol-chloroform extraction method. Next, bisulfite conversion of 500 ng of each DNA sample was performed using EZ DNA methylation kit according to the manufacturer's instructions (Zymo Research, Irvine, California, USA). Four μL of bisulfite-converted DNA was used for hybridization on Infinium Human Methylation 450 K BeadChip, following the Illumina Infinium HD Methylation Protocol (Illumina, San Diego, California, USA). Analysis of differential methylation was conducted using the RnBeads package [17]. Among the 485,577 probes present in 450 K, we selected only those associated with noncoding RNA genes according to UCSC Genome Browser classification, resulting in a total of 15,258 CpG sites that were processed. DNA methylation of genomic regions includes promoter (TSS1500, TSS200, 1st Exon and 5′UTR), body, 3′UTR, and intergenic regions as well as CpG islands, shores (2 kb regions upstream or downstream of the CpG islands), shelves (2 kb regions upstream or downstream of the CpG island shores), and “open sea” (regions outside the CpG island context). Methylation score for each CpG site is represented as a beta value, which ranges from 0 (no methylated) to 1 (completed methylated). We removed one control sample from our analysis because it presented a low call rate. Normalization and probe type bias adjustment were applied using BMIQ method [18]. We removed probes that (1) lacked beta values, (2) targeted single-nucleotide polymorphisms (SNPs) in the last three bases, (3) mapped at sexual chromosomes, (4) had detection p values >0.05, or (5) overlapped repetitive sequences. As a result, 14,468 noncoding RNA probes fulfilled our selection criteria. Differential methylation p value for each probe was obtained from Welch t-test or, alternatively, from linear models employed in the limma package after conversion of beta values into M-values (M = log2(Beta/1 − Beta)) [17]. Each p value was then corrected for multiple tests by using the method of Benjamini and Hochberg [19]. The adjusted p values resulted in no differentially methylated CpG sites, but Welch t-test showed significance, revealing that the average of methylation from CpG sites differs between the two compared groups. DNA methylation differences between groups were tested for significance using Mann-Whitney test. All statistical analyses were performed using GraphPad PRISM software v6.0 (GraphPad Software Inc., La Jolla, California, USA). Beta values are presented as mean ± standard error of the mean (SEM). Delta beta is referred to as the average of DNA methylation difference between the two compared groups.
2.3. Gene Expression Analysis
Total RNA was isolated using the RNeasy Mini kit (Qiagen, Hilden, Germany) according to the manufacturer's instructions. cDNA amplification, labeling, and hybridization were performed as previously described [20]. RNA expression experiments were performed using a customized cDNA platform containing 4,608 ORESTES representing human genes [21]. Hybridized arrays were scanned on the ScanArrayTM Express (Packard BioScience Biochip Technologies, Billerica, MA, USA) and Cy5/Cy3 signals were quantified using the histogram method, which is part of the ScanArray Express software (Perkin-Elmer Life Sciences, Boston, MA, USA). After normalization, data for each gene was reported as the logarithm of the expression ratio. Raw data was deposited at the Gene Expression Omnibus under accession number GSE13214. For analysis of differentially expressed genes, AD individuals were compared to controls by performing a Student's t-test (p ≤ 0.05) with 1000 permutations using MEV (MultiExperiment Viewer, Boston, MA, USA) software [22].
3. Results
A total of 2,095 out of 14,468 noncoding RNA CpG sites presented differential methylation p value (p < 0.05; Welch's t-test, Supplementary Table 2) in the temporal cortex samples of AD individuals compared to controls. Among them, 161 were associated with miRNA genes (p < 0.05; Welch's t-test, Supplementary Table 3). Figure 1 shows DNA methylation differences of the probes associated with miRNA genes and reveals that the large majority of the 161 differentially methylated miRNA CpG sites found in our casuistic were hypermethylated in the AD group. Notably, 10 CpG sites, highlighted in Figure 1, overlapped miRNA genes whose transcripts had been previously reported as dysregulated in AD brains (MIR34B/C, MIR9-1, MIR34A, MIR125B1, MIR146B, MIR124-1, MIR181C/D, MIR451, and MIR9-3). Table 2 presents the methylation status of these 10 CpG sites (all hypermethylated) and the statistical data comparing the AD group with controls. The average of methylation differences (delta beta) between the compared groups range from 0.9 to 5.6%. Except for MIR125B1, all miRNA genes presented methylation differences in probes mapped in promoter regions. MIR9-1, MIR9-3, and MIR124-1 showed differential methylation in CpG islands within the promoters, while the other miRNA genes presented differential methylation either in shores, shelves, or outside the CpG island context “open sea”. Figure 2 shows the box plot of differential methylation of all miRNA genes presented in Table 2. Using the DNA Intelligent Analysis- (DIANA-) miRPath v2.0 (http://www.microrna.gr/miRPathv2) [23], we retrieved the predicted target pathways of this 10 miRNA and found enrichment for the neuregulin receptor complex (ErbB) signaling pathway (Figure 3); 33 coding genes involved in this pathway are predicted targets of most of the investigated miRNA sets (Supplementary Table 4). To explore the expression of the predicted coding genes targeted by these 10 hypermethylated miRNA, a ~5 k microarray platform was used. Out of the 33 predicted genes, 10 were represented in this platform, three of which were overexpressed in AD individuals compared to controls (Table 3).
Figure 1.
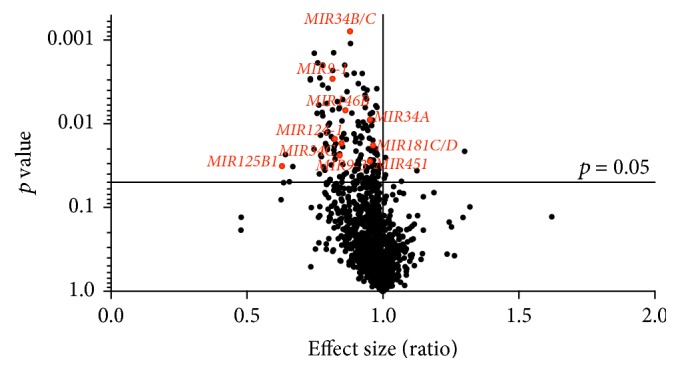
Volcano plot of methylation differences of all the CpG sites associated with microRNA genes. In total, 161 CpG sites were found to be differentially methylated (p < 0.05) in Alzheimer's disease (AD) group compared to controls, most of them hypermethylated; the 10 miRNA CpG sites highlighted in red map to transcripts previously reported as dysregulated in AD brains.
Table 2.
MicroRNAs CpG sites differentially methylated in Alzheimer's disease.
| CpG probe ID | Chr: Start site | Associated gene | UCSC_RefGene_Group | Relation_to_CpG_Island | Enhancer | Control | AD | Delta beta | p value |
|---|---|---|---|---|---|---|---|---|---|
| cg22806002 | 11: 111383083 | BTG4; MIR34C; MIR34B | TSS200; TSS1500; TSS1500 | N_Shore | — | 0.314 ± 0.005 | 0.358 ± 0.008 | 0.044 (4.4%) | 0.0015 |
| cg13149127 | 1: 156390835 | C1orf61; MIR9-1 | 5′UTR; TSS1500 | Island | TRUE | 0.045 ± 0.001 | 0.055 ± 0.002 | 0.010 (1%) | 0.0015 |
| cg09994773 | 1: 9212514 | MIR34A | TSS1500 | “open sea” | — | 0.826 ± 0.008 | 0.867 ± 0.011 | 0.041 (4.1%) | 0.0057 |
| cg16865908 | 11: 121970496 | LOC399959; MIR125B1 | Body; Body | “open sea” | TRUE | 0.068 ± 0.007 | 0.109 ± 0.015 | 0.040 (4.0%) | 0.0101 |
| cg25851152 | 10: 10419537 | MIR146B | TSS1500 | S_Shelf | TRUE | 0.072 ± 0.002 | 0.084 ± 0.002 | 0.011 (1.1%) | 0.0101 |
| cg09148270 | 11: 111384223 | BTG4; C11orf88; MIR34C | TSS1500; TSS1500; Body | N_Shore | — | 0.315 ± 0.010 | 0.372 ± 0.018 | 0.056 (5.6%) | 0.0172 |
| cg14278808 | 8: 9761141 | LOC157627; MIR124-1 | TSS1500; TSS200 | Island | — | 0.042 ± 0.002 | 0.051 ± 0.002 | 0.009 (0.9%) | 0.0220 |
| cg10822545 | 19: 13985513 | MIR181D; MIR181C | TSS200; Body | S_Shore | — | 0.833 ± 0.009 | 0.864 ± 0.007 | 0.031 (3.1%) | 0.0220 |
| cg02315626 | 17: 27188560 | MIR451; MIR144 | TSS200; Body | “open sea” | — | 0.802 ± 0.011 | 0.841 ± 0.011 | 0.038 (3.8%) | 0.0220 |
| cg12530503 | 15: 89911148 | MIR9-3 | TSS200 | Island | TRUE | 0.129 ± 0.005 | 0.153 ± 0.007 | 0.024 (2.4%) | 0.0349 |
AD = Alzheimer's disease; beta values are presented as means ± SEM; delta beta is the average of DNA methylation difference between the two compared groups; Mann-Whitney test, p values refer to the statistical analysis of the means of methylation levels from the two compared groups.
Figure 2.

Box plots of DNA methylation level of microRNA genes found to be hypermethylated in Alzheimer's disease brains. The 10 hypermethylated CpG sites encompassing microRNA genes are presented (a–j). Mann-Whitney test, ∗∗ p < 0.01, ∗ p < 0.05. Beta values are displayed as means ± SEM.
Figure 3.

Heat map of hypermethylated microRNAs versus predicted target pathways. The figure illustrates hierarchical clustering results for miRNAs (y-axis) and pathways (x-axis). The neuregulin receptor complex (ErbB) signaling pathway is clearly targeted by most investigated miRNAs. Image derived from DNA Intelligent Analysis- (DIANA-) miRPath using microT-CDS as the target prediction algorithm.
Table 3.
Genes of ErbB signaling pathway analyzed in the cDNA microarray.
| Gene symbol | fold_change (AD vs. Control) | p value |
|---|---|---|
| MYC | 1.397076772 | 0.022∗ |
| MAP2K1 | 1.324156793 | 0.029∗ |
| ABL2 | 1.200432189 | 0.046∗ |
| AREG | 1.162855371 | |
| BRAF | 1.156142719 | |
| MTOR | 1.022415444 | |
| GAB1 | 1.000617085 | |
| EGFR | −1.008044545 | |
| PIK3CB | −1.198562637 | |
| PIK3R3 | −1.405367210 |
∗Differentially expressed genes between AD and controls (p ≤ 0.05, Student's t-test). AD = Alzheimer's disease.
4. Discussion
So far, approximately 30 miRNAs have been implicated in the AD pathogenesis for presenting altered expression [8–10]; however, the mechanisms underlying such dysregulation remain unknown, neither miRNAs silenced by DNA methylation nor genomewide methylation changes of noncoding RNA genes have been described in AD brains. The present study is the first genomewide methylation analysis of noncoding RNA genes in AD brains. Among the 161 differentially methylated miRNA CpGs, we identified 10 miRNAs genes, all of them harboring hypermethylated CpG sites, whose transcripts are among those previously reported as dysregulated in AD brains. Interestingly, the hypermethylation in the promoter region of 6 of these miRNA genes (MIR9-1, MIR9-3, MIR181C, MIR124-1, MIR146B, and MIR451) is in agreement with previous data from literature that shows downregulation in AD brains of their corresponding transcripts (miR-9, miR-181c, miR-124, miR-146b, and miR-451).
It has been demonstrated that miR-9, which is encoded by 3 different genes (MIR9-1, MIR9-2, and MIR9-3), may be relevant in AD pathogenesis since it targets two of the most important proteins involved in the disease pathology: amyloid-β precursor protein (AβPP), which carries the amyloid-β peptide (Aβ) that precipitates in the amyloid plaques, and BACE1 that cleaves APP to originate Aβ [24]. Also, miR-9 is differentially expressed in cerebral regions that are significantly associated with disease progression [25, 26]. Downregulation of miR-9 may increase both APP and BACE1 in AD brains suggesting a posttranscriptional regulation of these two proteins under pathological conditions [27]. As observed with miR-9, downregulation of miR-181c in AD brains also correlates with increase of amyloid-β peptide levels [27–29]. Moreover, miR-181 is known to act as an additional repressor of SIRT1 expression, which via its histone deacetylase activity provides a feedback to the level of epigenetic control [28]; Donmez and colleagues revealed that overexpression of SIRT1 prevents Aβ production by deacetylating the retinoic acid receptor β, promoting nonamyloidogenic cleavage of APP through an upregulation of ADAM10, a major component of α-secretase [30]. It is worth to mention though that downregulation of miR-9 and miR-181c is not restricted to AD, as these miRNAs are also diminished in others neurodegenerative disorders [10]. It is reasonable to assume that aberrant profiles of neural miRNA expression shared by several neurodegenerative disorders may give rise to common patterns of cellular dysfunction in these conditions.
miR-124 has been found to be the most abundant microRNA expressed in the adult human brain. Three genes (MIR124-1, MIR124-2, and MIR124-3) at 3 independent loci in the human genome encode the same mature miR-124 [31]. An investigation using cellular AD models and cultured hippocampal neurons revealed that dysregulation of miR-124 is associated with AD pathology via its target, BACE1 [32]. The authors demonstrated that suppression or overexpression of miR-124 causes respectively an up and downregulation of BACE1 expression, and is well correlated with cell death induced by Aβ neurotoxicity. Ultimately, miR-146b and miR-451 are reported to be downregulated in cerebrospinal fluid from patients with AD, and both miRNAs are involved in multiple inflammatory pathways [27]. Notably, miR-146b is described to be consistently downregulated at different areas within AD brains [27]. Analysis of miR-146b expression in human monocytes revealed that its activation occurs in response to a variety of microbial components and proinflammatory cytokines [33]; it controls toll-like receptor (TLR) and cytokine signaling through a negative feedback loop that involves downregulation of IL-1 receptor-associated kinase 1 and TNF receptor-associated factor 6 protein levels [34]. It has been proposed that downregulation of miR-146b in AD brains releases translational repression of TLR signaling and exacerbates the innate immunity response, which in turn contributes to neurodegeneration [9, 27]. In fact, studies have demonstrated that Aβ can activate TLR signaling. This TLR signaling activation may lead to an increase of innate immune response from the brain due to microglia recruitment; therefore, downregulation of miR-146b on AD brain also lends support to the inflammation hypothesis of AD pathogenesis [9].
The hypermethylated miRNA set is predicted to target, among others, 33 coding genes from the neuregulin receptor complex (ErbB) signaling pathway, which is required for the neurons myelination process [35, 36]. Three genes of the (ErbB) signaling pathway (MYC, MAP2K1, and ABL2) were found to be overexpressed in AD brains, as expected for targets of hypermethylated miRNAs. The magnitude of gene expression changes observed was modest, but studies have demonstrated that miRNAs regulate gene expression in a subtle manner and the magnitude of repression is rarely higher than 2-fold [37]. MYC and MAP2K1 are known to be involved in many cellular processes including cell cycle progression, apoptosis, and differentiation, transcription regulation and ABL2 plays a role in cytoskeletal rearrangements through its microtubule-binding sequences. Interestingly, all of them were already shown to be overexpressed in AD brain [38–40]. MYC, which presented the greatest fold change expression in our casuistic is reported to be overexpressed in degenerating neurons, and its expression in transgenic mice induces neuronal-specific cell cycle re-entry, neurodegeneration, and, importantly, significant cognitive deficits [39].
The other differentially hypermethylated miRNA genes (MIR34B/C, MIR125B1, and MIR181D) found in our casuistic cannot be directly related to the already described upregulation pattern of expression of these transcripts in AD brains [9, 10]; thus further investigation is required to clarify the role of DNA methylation in the transcriptional regulation of these miRNA species. Of note, even though our work has focused mainly on miRNA genes, we also investigated whether some of the long noncoding RNAs already described as dysregulated in AD brains presented altered methylation (reviewed by [41]). No long noncoding RNA genes pointed out by the authors were found to be differentially methylated.
Differences in miRNA expression between male and female mice brains have been reported mainly associated with gonadal steroid regulation and sex chromosome bias [42]. In the present study, sex chromosome probes were removed and the analytical procedure used accounts for eventual bias introduced by gender, batch, and so forth [17]. However, albeit remote, we cannot exclude the possibility that the uneven number of male/females may have had some influence in the results. Even though the modest differences in methylation observed in our study are in agreement with previous genomewide and candidate gene reports that describe methylation differences below 10% in AD brains [6, 43, 44], the evidence presented here should be validated in larger cohorts. But together these findings support the involvement of DNA methylation in the disease, but the individual effects at each CpG site indeed seems to be subtle. Heterogeneity of population cells in the brain is one aspect that could contribute to make methylation changes less apparent. The human brain being composed by many different cell types, each one having distinct roles on AD progression, certainly adds considerable complexity into methylation analysis. AD brains have an active changing cell population including neuronal loss and glial activation that may in part be responsible for the observed results. However, due to technological limitations it is still not possible to distinguish cell type specific methylation changes. Additionally, likewise many other epigenomic studies in human brains, determining whether epigenomic changes are cause or consequence of the disease is a difficult challenge. Unless epigenomic studies are performed in a noninvasive manner or using small tissue biopsies, it will remain especially arduous to establish causality for neurodegenerative disorders.
5. Conclusion
In summary, our results suggest that DNA methylation is likely involved in the dysregulation of miRNA expression in the human brain and may therefore contribute to impact the pathogenesis of AD.
Supplementary Material
Supplementary Table 1 describes the clinical and pathological data of individuals used in gene expression analysis. Supplementary Table 2 presents 2,095 differentially methylated noncoding RNA CpG sites in the temporal cortex of AD subjects compared to controls. Supplementary Table 3 presents 161 differentially methylated CpG sites associated with miRNA genes. Supplementary Table 4 presents the predicted targets of the investigated miRNAs.
We added this paragraph in the Casuistic and Methods section of the manuscript.
Acknowledgments
This work was supported by FAPESP grants (2009/00898-1; 2010/15503-0; 2013/08028-1). The authors thank the Brazilian Aging Brain Study Group for providing postmortem human brain samples.
Competing Interests
The authors have no competing interests to declare.
References
- 1.Lee J., Ryu H. Epigenetic modification is linked to Alzheimer's disease: is it a maker or a marker? BMB Reports. 2010;43(10):649–655. doi: 10.3858/bmbrep.2010.43.10.649. [DOI] [PubMed] [Google Scholar]
- 2.Iraola-Guzmán S., Estivill X., Rabionet R. DNA methylation in neurodegenerative disorders: a missing link between genome and environment? Clinical Genetics. 2011;80(1):1–14. doi: 10.1111/j.1399-0004.2011.01673.x. [DOI] [PubMed] [Google Scholar]
- 3.Newell-Price J., Clark A. J. L., King P. DNA methylation and silencing of gene expression. Trends in Endocrinology and Metabolism. 2000;11(4):142–148. doi: 10.1016/S1043-2760(00)00248-4. [DOI] [PubMed] [Google Scholar]
- 4.Gibney E. R., Nolan C. M. Epigenetics and gene expression. Heredity. 2010;105(1):4–13. doi: 10.1038/hdy.2010.54. [DOI] [PubMed] [Google Scholar]
- 5.Robertson K. D. DNA methylation and human disease. Nature Reviews Genetics. 2005;6(8):597–610. doi: 10.1038/nrg1655. [DOI] [PubMed] [Google Scholar]
- 6.De Jager P. L., Srivastava G., Lunnon K., et al. Alzheimer's disease: early alterations in brain DNA methylation at ANK1, BIN1, RHBDF2 and other loci. Nature Neuroscience. 2014;17:1156–1163. doi: 10.1038/nn.3786. [DOI] [PMC free article] [PubMed] [Google Scholar]
- 7.Flynt A. S., Lai E. C. Biological principles of microRNA-mediated regulation: shared themes amid diversity. Nature Reviews Genetics. 2008;9(11):831–842. doi: 10.1038/nrg2455. [DOI] [PMC free article] [PubMed] [Google Scholar]
- 8.Femminella G. D., Ferrara N., Rengo G. The emerging role of microRNAs in Alzheimer's disease. Frontiers in Physiology. 2015;6, article 40 doi: 10.3389/fphys.2015.00040. [DOI] [PMC free article] [PubMed] [Google Scholar]
- 9.Maes O. C., Chertkow H. M., Wang E., Schipper H. M. MicroRNA: implications for Alzheimer disease and other human CNS disorders. Current Genomics. 2009;10(3):154–168. doi: 10.2174/138920209788185252. [DOI] [PMC free article] [PubMed] [Google Scholar]
- 10.Van den Hove D. L., Kompotis K., Lardenoije R., et al. Epigenetically regulated microRNAs in Alzheimer's disease. Neurobiology of Aging. 2014;35(4):731–745. doi: 10.1016/j.neurobiolaging.2013.10.082. [DOI] [PubMed] [Google Scholar]
- 11.Suzuki H., Maruyama R., Yamamoto E., Kai M. DNA methylation and microRNA dysregulation in cancer. Molecular Oncology. 2012;6(6):567–578. doi: 10.1016/j.molonc.2012.07.007. [DOI] [PMC free article] [PubMed] [Google Scholar]
- 12.Grinberg L. T., Lucena Ferretti R. E., Farfel J. M., et al. Brain bank of the Brazilian aging brain study group—a milestone reached and more than 1,600 collected brains. Cell and Tissue Banking. 2007;8(2):151–162. doi: 10.1007/s10561-006-9022-z. [DOI] [PubMed] [Google Scholar]
- 13.Braak H., Braak E. Neuropathological stageing of Alzheimer-related changes. Acta Neuropathologica. 1991;82(4):239–259. doi: 10.1007/BF00308809. [DOI] [PubMed] [Google Scholar]
- 14.Morris J. C. The Clinical Dementia Rating (CDR): current version and scoring rules. Neurology. 1993;43(11):2412–2414. doi: 10.1212/wnl.43.11.2412-a. [DOI] [PubMed] [Google Scholar]
- 15.National Commission for the Protection of Human Subjects of Biomedical and Behavioral Research. The Belmont Report: Ethical Principles and Guidelines for the Protection of Human Subjects of Research. II. Washington, DC, USA: U.S. Government Printing Office; 1978. [PubMed] [Google Scholar]
- 16.World medical association declaration of helsinki: ethical principles for medical research involving human subjects. Journal of Obstetrics and Gynaecology Research. 2001;27(2):13–15. doi: 10.1111/j.1447-0756.2001.tb01222.x. [DOI] [Google Scholar]
- 17.Assenov Y., Müller F., Lutsik P., Walter J., Lengauer T., Bock C. Comprehensive analysis of DNA methylation data with RnBeads. Nature Methods. 2014;11(11):1138–1140. doi: 10.1038/nmeth.3115. [DOI] [PMC free article] [PubMed] [Google Scholar]
- 18.Teschendorff A. E., Marabita F., Lechner M., et al. A beta-mixture quantile normalization method for correcting probe design bias in Illumina Infinium 450 k DNA methylation data. Bioinformatics. 2013;29(2):189–196. doi: 10.1093/bioinformatics/bts680. [DOI] [PMC free article] [PubMed] [Google Scholar]
- 19.Benjamini Y., Hochberg Y. Controlling the false discovery rate: a practical and powerful approach to multiple testing. Journal of the Royal Statistical Society. Series B. 1995;57(1):289–300. [Google Scholar]
- 20.Silva A. R. T., Grinberg L. T., Farfel J. M., et al. Transcriptional alterations related to neuropathology and clinical manifestation of Alzheimer's disease. PLoS ONE. 2012;7(11) doi: 10.1371/journal.pone.0048751.e48751 [DOI] [PMC free article] [PubMed] [Google Scholar]
- 21.Neto E. D., Correa R. G., Verjovski-Almeida S., et al. Shotgun sequencing of the human transcriptome with ORF expressed sequence tags. Proceedings of the National Academy of Sciences of the United States of America. 2000;97(7):3491–3496. doi: 10.1073/pnas.97.7.3491. [DOI] [PMC free article] [PubMed] [Google Scholar]
- 22.Saeed A. I., Sharov V., White J., et al. TM4: a free, open-source system for microarray data management and analysis. BioTechniques. 2003;34(2):374–378. doi: 10.2144/03342mt01. [DOI] [PubMed] [Google Scholar]
- 23.Vlachos I. S., Kostoulas N., Vergoulis T., et al. DIANA miRPath v.2.0: investigating the combinatorial effect of microRNAs in pathways. Nucleic Acids Research. 2012;40(1):W498–W504. doi: 10.1093/nar/gks494. [DOI] [PMC free article] [PubMed] [Google Scholar]
- 24.Hébert S. S., Horré K., Nicolaï L., et al. Loss of microRNA cluster miR-29a/b-1 in sporadic Alzheimer's disease correlates with increased BACE1/β-secretase expression. Proceedings of the National Academy of Sciences of the United States of America. 2008;105(17):6415–6420. doi: 10.1073/pnas.0710263105. [DOI] [PMC free article] [PubMed] [Google Scholar]
- 25.Schonrock N., Ke Y. D., Humphreys D., et al. Neuronal microrna deregulation in response to Alzheimer's disease amyloid-β . PLoS ONE. 2010;5(6) doi: 10.1371/journal.pone.0011070.e11070 [DOI] [PMC free article] [PubMed] [Google Scholar]
- 26.Krichevsky A. M., King K. S., Donahue C. P., Khrapko K., Kosik K. S. A microRNA array reveals extensive regulation of microRNAs during brain development. RNA. 2003;9:1274–1281. doi: 10.1261/rna.5980303. [DOI] [PMC free article] [PubMed] [Google Scholar]
- 27.Cogswell J. P., Ward J., Taylor I. A., et al. Identification of miRNA changes in Alzheimer's disease brain and CSF yields putative biomarkers and insights into disease pathways. Journal of Alzheimer's Disease. 2008;14(1):27–41. doi: 10.3233/jad-2008-14103. [DOI] [PubMed] [Google Scholar]
- 28.Schonrock N., Humphreys D. T., Preiss T., Götz J. Target gene repression mediated by miRNAs miR-181c and miR-9 both of which are down-regulated by amyloid-β . Journal of Molecular Neuroscience. 2012;46(2):324–335. doi: 10.1007/s12031-011-9587-2. [DOI] [PubMed] [Google Scholar]
- 29.Schonrock N., Matamales M., Ittner L. M., Götz J. MicroRNA networks surrounding APP and amyloid-β metabolism—implications for Alzheimer's disease. Experimental Neurology. 2012;235(2):447–454. doi: 10.1016/j.expneurol.2011.11.013. [DOI] [PubMed] [Google Scholar]
- 30.Donmez G., Wang D., Cohen D. E., Guarente L. SIRT1 suppresses beta-amyloid production by activating the alpha-secretase gene ADAM10. Cell. 2010;142:320–332. doi: 10.1016/j.cell.2010.06.020. [DOI] [PMC free article] [PubMed] [Google Scholar] [Retracted]
- 31.Visvanathan J., Lee S., Lee B., Lee J. W., Lee S.-K. The microRNA miR-124 antagonizes the anti-neural REST/SCP1 pathway during embryonic CNS development. Genes and Development. 2007;21(7):744–749. doi: 10.1101/gad.1519107. [DOI] [PMC free article] [PubMed] [Google Scholar]
- 32.Fang M., Wang J., Zhang X., et al. The miR-124 regulates the expression of BACE1/β-secretase correlated with cell death in Alzheimer's disease. Toxicology Letters. 2012;209(1):94–105. doi: 10.1016/j.toxlet.2011.11.032. [DOI] [PubMed] [Google Scholar]
- 33.Moschos S. A., Williams A. E., Perry M. M., Birrell M. A., Belvisi M. G., Lindsay M. A. Expression profiling in vivo demonstrates rapid changes in lung microRNA levels following lipopolysaccharide-induced inflammation but not in the anti-inflammatory action of glucocorticoids. BMC Genomics. 2007;8, article 240 doi: 10.1186/1471-2164-8-240. [DOI] [PMC free article] [PubMed] [Google Scholar]
- 34.Taganov K. D., Boldin M. P., Chang K.-J., Baltimore D. NF-κB-dependent induction of microRNA miR-146, an inhibitor targeted to signaling proteins of innate immune responses. Proceedings of the National Academy of Sciences of the United States of America. 2006;103(33):12481–12486. doi: 10.1073/pnas.0605298103. [DOI] [PMC free article] [PubMed] [Google Scholar]
- 35.Chen S., Velardez M. O., Warot X., et al. Neuregulin 1-erbB signaling is necessary for normal myelination and sensory function. The Journal of Neuroscience. 2006;26(12):3079–3086. doi: 10.1523/jneurosci.3785-05.2006. [DOI] [PMC free article] [PubMed] [Google Scholar]
- 36.Lemke G. Neuregulin-1 and myelination. Science's STKE. 2006;2006(325, article pe11) doi: 10.1126/stke.3252006pe11. [DOI] [PubMed] [Google Scholar]
- 37.Hausser J., Zavolan M. Identification and consequences of miRNA-target interactions—beyond repression of gene expression. Nature Reviews Genetics. 2014;15(9):599–612. doi: 10.1038/nrg3765. [DOI] [PubMed] [Google Scholar]
- 38.Hallock P., Thomas M. A. Integrating the Alzheimer's disease proteome and transcriptome: a comprehensive network model of a complex disease. OMICS: A Journal of Integrative Biology. 2012;16(1-2):37–49. doi: 10.1089/omi.2011.0054. [DOI] [PMC free article] [PubMed] [Google Scholar]
- 39.Lee H.-G., Casadesus G., Nunomura A., et al. The neuronal expression of MYC causes a neurodegenerative phenotype in a novel transgenic mouse. The American Journal of Pathology. 2009;174(3):891–897. doi: 10.2353/ajpath.2009.080583. [DOI] [PMC free article] [PubMed] [Google Scholar]
- 40.Tremblay M. A., Acker C. M., Davies P. Tau phosphorylated at tyrosine 394 is found in Alzheimer's disease tangles and can be a product of the abl-related kinase, Arg. Journal of Alzheimer's Disease. 2010;19(2):721–733. doi: 10.3233/JAD-2010-1271. [DOI] [PMC free article] [PubMed] [Google Scholar]
- 41.Wu P., Zuo X., Deng H., Liu X., Liu L., Ji A. Roles of long noncoding RNAs in brain development, functional diversification and neurodegenerative diseases. Brain Research Bulletin. 2013;97:69–80. doi: 10.1016/j.brainresbull.2013.06.001. [DOI] [PubMed] [Google Scholar]
- 42.McCarthy M. M., Nugent B. M. At the frontier of epigenetics of brain sex differences. Frontiers in Behavioral Neuroscience. 2015;9, article 221 doi: 10.3389/fnbeh.2015.00221. [DOI] [PMC free article] [PubMed] [Google Scholar]
- 43.Bakulski K. M., Dolinoy D. C., Sartor M. A., et al. Genome-wide DNA methylation differences between late-onset alzheimer's disease and cognitively normal controls in human frontal cortex. Journal of Alzheimer's Disease. 2012;29(3):571–588. doi: 10.3233/JAD-2012-111223. [DOI] [PMC free article] [PubMed] [Google Scholar]
- 44.Wang S.-C., Oeize B., Schumacher A. Age-specific epigenetic drift in late-onset Alzheimer's disease. PLoS ONE. 2008;3(7) doi: 10.1371/journal.pone.0002698.e2698 [DOI] [PMC free article] [PubMed] [Google Scholar]
Associated Data
This section collects any data citations, data availability statements, or supplementary materials included in this article.
Supplementary Materials
Supplementary Table 1 describes the clinical and pathological data of individuals used in gene expression analysis. Supplementary Table 2 presents 2,095 differentially methylated noncoding RNA CpG sites in the temporal cortex of AD subjects compared to controls. Supplementary Table 3 presents 161 differentially methylated CpG sites associated with miRNA genes. Supplementary Table 4 presents the predicted targets of the investigated miRNAs.
We added this paragraph in the Casuistic and Methods section of the manuscript.