

Summary
Optogenetic approaches have proven powerful for examining the role of neural circuits in generating behaviors, especially in systems where electrophysiological manipulation is not possible. Here we describe a method for optogenetically manipulating single pharyngeal neurons in intact C. elegans while monitoring pharyngeal behavior. This approach provides bidirectional and dynamic control of pharyngeal neural activity simultaneously with a behavioral readout, and has allowed us to test hypotheses about the roles of individual pharyngeal neurons in regulating feeding behavior.
Keywords: optogenetics, feeding behavior, small circuits, pharynx, in vivo optogenetics, C. elegans
Introduction
The nematode C. elegans is a powerful tool for studying the function of neural circuits, in large part due to its genetic tractability and known synaptic connectivity [1, 2]. Since it is not currently possible to electrophysiologically manipulate the activity of the C. elegans nervous system in intact animals [3], the primary method for studying the roles of specific neurons in behavior has been ablation of these neurons in young larvae using a laser beam, and observation of behavior in adults [4, 5]. However, laser ablation is a permanent, unidirectional manipulation of a neural circuit that does not easily allow the assessment of functional redundancy or developmental compensation [6]. It is therefore suboptimal for understanding dynamic phenomena like neural activity.
Optogenetic techniques, which involve using light-sensitive ion channels to manipulate neural activity and behavior, are ideal for precise temporal control of neural activity in behaving animals, as they afford bidirectional and dynamic manipulation [7]. To date, most optogenetic experiments in C. elegans have been performed by illuminating the entire worm after expressing light-sensitive proteins in a desired subset of neurons [8]. However, the cellular specificity of this approach – and therefore its utility for functionally dissecting neural circuits – has been limited by the difficulty of finding a promoter that drives gene expression only in the desired neurons. Genetic intersection approaches have been used [9-12], but even these are not guaranteed to provide the desired overlap. Furthermore, when using promoters with high cellular specificity a different strain is required to study each subset of neurons, making it impossible to study the functions of multiple neurons in a single worm. To solve this problem, multiple groups have developed different methods for using patterned light to illuminate arbitrary parts of the worm corresponding to neurons of interest. The first of these studies was done using immobilized worms and optically monitoring calcium levels in neurons of interest [13]. More recent work has used locomotion as a behavioral readout of circuit function [14-16].
Here, we describe a method for using spatially restricted optogenetic illumination to investigate the behavioral effects of manipulating individual neurons in the pharynx (feeding organ). The pharyngeal neural circuit is one of the simplest in the worm, containing 20 neurons of 14 classes. However, experiments in which each of the 14 classes of pharyngeal neurons were ablated found only 3 classes for which ablation caused a clearly identifiable deficit in feeding behavior [17], perhaps due to circuit redundancy. Using an optogenetic approach, we uncovered genetic and neural degeneracy in the circuit for excitation of pharyngeal pumping [18].
We use a digital micromirror device (DMD) to focus light in defined patterns on worms that express light sensitive excitatory (e.g. blue-light-sensitive ion channel Channelrhodopsin-2 (ChR2)) [19] or inhibitory microbial opsins (e.g. blue-light-powered proton pump (Mac) from Leptosphaeria maculans) [20-22]. To stimulate single neurons, we take advantage of the fact that pharynx is internal and use polystyrene beads to immobilize worms [23]. This affords submicron spatial resolution without pharmacological manipulation. We use particle image velocimetry to automatically track movement of pharyngeal muscles during optogenetic manipulations. This approach improves on both the lack of specificity present in typical optogenetic experiments and the lack of sensitivity and intra-observer variability inherent in manual observation [24].
Materials
Optical table (at least 1.5 m × 1.2 m surface)
473 nm laser (e.g. Shanghai Laser and Optics Century model BL473T3-150)
Leica DMI3000B inverted microscope and associated filter cubes
Leica Plan Apo 63X oil immersion objective lens with N.A.= 1.4
Photometrics DV2 multichannel imaging system
Cooled CCD camera with software capable of 30 frames per second (e.g. Andor iXon 885 and Andor SOLIS software)
1024 by 768 pixel digital micromirror device (DMD) with Discovery 4100 Explorer software (Discovery 4100 DLP, Texas Instruments/Digital Light Innovations)
Power meter (e.g. Coherent FieldMate)
MATLAB software
Aluminum mounting box for DMD control board (approx. 15 cm × 20 cm)
6.24 mm focal length aspheric lens (e.g. Thorlabs C110TME-A)
75 mm focal length planoconvex lens (e.g. Thorlabs LA1608-A)
100 mm focal length, 2-inch diameter achromatic lens (e.g. Thorlabs AC508-100-A)
2 200 mm focal length, 2-inch diameter achromatic lenses (e.g. Thorlabs AC508-200-A)
∼7 mirrors (e.g. Thorlabs PF20-03-P01 and PF10-03-P01)
2 irises (e.g. Thorlabs ID15)
Longpass dichroic filter (e.g. Thorlabs DMLP490R)
-
Hardware for mounting each optic
Post holders (e.g. Thorlabs UPH3)
Posts (e.g. Thorlabs TR3)
Lens and mirror mounts (e.g. Thorlabs LMR1, LMR2, KM100, KM200)
Post clamps (e.g. Thorlabs RA45)
1/4″-20 cap screws (e.g. Thorlabs HW-KIT2)
8-32 cap screws (e.g. Thorlabs HW-KIT3)
Sodium fluorescein
NGM buffer (NGM from [25] but without agar, cholesterol, or peptone)
Agarose
Serotonin HCl
Slides and coverslips
0.5 mm thick plastic shim stock (Ardus Yellow 0.020 Inches)
250 mL beaker
50 mL centrifuge tube
Disposable spatulas (e.g. VWR International 80081-188)
2.5% (v/v) suspension of 50 nm diameter polystyrene beads (Polysciences 08691-10)
Nematode strains expressing opsins in neurons of interest
Methods
The methods will be described in 5 sections: A: Building the rig; B: Constructing the worm strains; C: Immobilizing the worms; D: Performing the experiments; and E: Analyzing the data.
A. Building the rig
In the optical setup, a laser beam is first expanded in diameter by about 10 times by a telescope consisting of two lenses (Figure 1). This laser beam is routed via mirrors to the DMD, which restricts the beam to a set of a pixels selected by computer. Next, the image on the DMD is relayed to an intermediate image plane of the microscope with 2X magnification using lenses with focal lengths 100 mm and 200 mm. Finally the image is relayed again to the worm via a relay lens system composed of a 200 mm focal length lens and the objective lens. The steps for constructing this setup are described below, and a schematic is depicted in Figure 1.
Figure 1. Setup for single neuron stimulation of pharyngeal neurons.
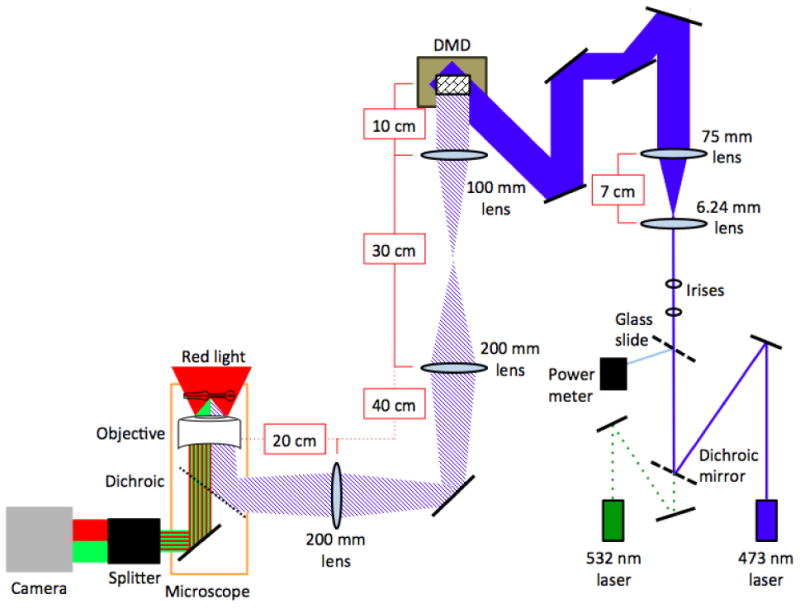
Light leaves the blue laser and is reflected off a mirror (black line) and dichroic beam splitter. A small percentage of the light is then reflected to a power meter to monitor laser output. The light then passes through two irises before being expanded through a telescope composed of two lenses. The beam is then, through a series of mirrors, reflected onto the DMD (brown box) such that it covers the entire grid of mirrors. This beam then passes through a series of lenses along the light path. It then enters the microscope through an auxiliary port, where it is reflected by a dichroic on a custom filter cube into the back of the objective. The stage of the microscope is illuminated with red light. This red light and the green light emitted by fluorescent proteins then passes through a DV2 beam splitter, which separates the red and green channels, which are then recorded by a camera.
Before starting work, obtain the appropriate laser protection eyewear, light curtains, and other safety equipment. Consult your laser safety protection officer to determine what is needed.
Place the microscope and laser on an optical table and secure them so that they will not inadvertently move in relationship to the rest of the table. (see Note 1)
Mount each mirror or lens in an appropriate mount, and attach each mount to a post and post holder. Fasten post holders to the table in an out of the way location so that they are secure while you are performing the other steps.
Mount the DMD by attaching the DMD to a KM200 mirror mount and attaching the control board to the mounting case using screws and board standoffs. Ensure that the DMD power cable can be plugged in to the control board after mounting.
Place two irises in the path of the laser, and adjust them and the laser so that the laser beam is perfectly horizontal and passes directly through the center of the irises.
Place the 6.24 mm focal length lens and the 75 mm focal length lens so they are 81.24 mm apart (the sum of the focal lengths), beyond the irises. The lenses should be oriented according to their design specifications, with the sides designed for short conjugate distance facing each other.
Align these lenses so the beam passes through the center of the lenses and is collimated (i.e. neither converging nor diverging) after exiting the 75 mm focal length lens. (see Note 2)
Install a filter cube and dichroic filter that reflects light from the desired port through the back of the objective. For GFP optics, use a longpass dichroic filter that reflects wavelengths shorter than 500 nm and transmits wavelengths longer than 500 nm. (see Note 3)
Place one of the 200 mm lenses 200 mm away from the back of the objective, along the light path, with the rounded side facing the microscope. (see Note 4)
Place the other 200 mm lens 400 mm beyond the first 200 mm lens, along the light path. The curved side should face away from the microscope. (see Note 5).
Place the 100 mm lens 300 mm beyond the furthest 200 mm lens. The curved side should face the 200 mm lens.
Place the DMD 100 mm beyond the 100 mm lens. Screw down loosely, as the position will likely need to be adjusted later. (see Note 6)
Plug in the DMD and use the Discovery 4100 Explorer software to set it so that all the mirrors are in the ON position.
Use mirrors as necessary to project the laser beam onto the DMD. (see Note 7)
Adjust the angle of the DMD so that with the mirrors in the ON position, the laser beam is reflected along the optical path of the microscope, through the center of the 100 and 200 mm lenses. (see Note 8)
Place a glass slide at an angle in the light path shortly after the beam leaves the laser by taping the slide to an optical post. (see Note 9)
Set up the power meter so the light reflected off the glass slide hits the center of the sensor.
Place a red filter in the transillumination light path to enable behavioral observation during the optogenetics experiments without off-target stimulation effects.
To allow independent analysis of the green (GFP/targeting) and red (brightfield/behavior) signals, attach the DV2 and camera to the imaging port of the microscope.
Align the DV2 according to the instructions that come with the device. (see Note 10)
Register the DMD coordinates to the field of view of the camera. Create a series of images that contain a square moving in a matrix across the DMD. (see Note 11)
Prepare a slide with a thin layer of 1 M sodium fluorescein in water or glycerol between two shims under a coverslip and place it on the microscope stage.
Pass the series of images to the DMD (step 20) and record where (if at all) a fluorescent spot appears on the camera.
Compute the correspondence matrix of the coordinates passed to the DMD and coordinates where fluorescence was detected.
Use this matrix to define an image transformation between the DMD and the camera.
B. Creating worm strains
In general, the same strains that are used for whole worm optogenetics can be used for this method. (see Note 12)
These worms should be grown in the dark following standard procedures. Where needed, add 2 μL of 100 mM all-trans retinal (ATR) in ethanol to the bacterial suspension immediately before seeding. (see Note 13)
Laser ablations, if desired, can be performed as previously described [4, 5].
C. Preparing agarose pads
Prepare 6 slides by placing 0.5 mm thick shims, approximately 1 cm by 2 cm, on each end of each slide.
Prepare agarose pads by mixing 0.20 g agarose and 4 mg 5-HT into 2 mL of NGM (10% agarose, 10 mM 5-HT) in a 50 mL centrifuge tube. (see Note 14)
Swirl the mixture gently so that the agarose is evenly dispersed in the liquid rather than a large clump, but avoid getting too much of the mixture on the sides of the tube.
Rest the lid on top of the centrifuge tube, but do not screw it on.
Place the centrifuge tube in a 250 mL beaker.
Fill the beaker to ∼50 mL with tap water, just above the level of liquid in the centrifuge tube.
Microwave the beaker and centrifuge tube for 50 seconds at high power, at which point the agarose mixture should be clear, and may have some bubbles.
Using a disposable plastic spatula, place a drop of agarose mixture about 1 cm in diameter onto the middle of a slide prepared with shims and immediately cover this slide with a second slide (see Note 15).
Make slides until all the agarose has been used. (see Note 16)
Allow slides to set for at least 1 minute before adding worms.
Steps 11-16 should be performed quickly for optimal immobilization
-
11
Load 1.5 μL of a 2.5% (v/v) suspension of 50 nm diameter polystyrene beads into a 20 μl pipettor [23]. (see Note 17)
-
12
Remove top slide from one of the pads and place the slide with the pad onto a plate lid on the microscope stage.
-
13
Use bacteria to stick up to 10 worms onto the bottom of a worm pick, but do not put them on the pad yet.
-
14
Expel the 1.5 uL of beads onto the pad.
-
15
Gently, and as quickly as possible, place the pick into the beads and allow the worms to transfer into the beads on the pad. (see Note 18)
-
16
Quickly place a coverslip on top of the pad to immobilize the worms.
-
17
Wait 5-10 minutes before performing experiments to allow the worms to habituate.
D. Performing the experiments
Set the frame rate of the camera and the laser power. (see Note 19).
Place a slide on the microscope stage and find a worm at 10x on the microscope under brightfield illumination. (see Note 20)
Switch to 63x and move the pharynx of the worm into the center of the field of view under brightfield illumination. (see Note 21)
Manually take a z-stack of the pharyngeal neurons by illuminating the entire field using the DMD, and focusing through the relevant regions. This illumination period should be less than 1 second.
If desired, use MATLAB convert the images into JPEG files. MATLAB scripts for this and all other steps are available upon request. (see Note 22).
Identify the images in the z-stack that most clearly show the neurons of interest.
Use the roipoly function in MATLAB to select the regions of these images you would like to use to stimulate each neuron. (see Note 23 and Figure 2B and C)
Use MATLAB to create an image mask that that contains the value 1 for the region you outlined in the previous step and the value 0 elsewhere, and transform this file into DMD coordinates using the transformation computed in step A23. (see Note 24)
Create a Discovery 4100 script that tells the DMD which images to display and at which times they should be displayed. (see Note 25)
Acquire a baseline recording of behavior without any illumination. (see Note 26)
Run each script while recording from both the red and green channels. (see Note 27)
Figure 2. Stimulation of single pharyngeal neurons.
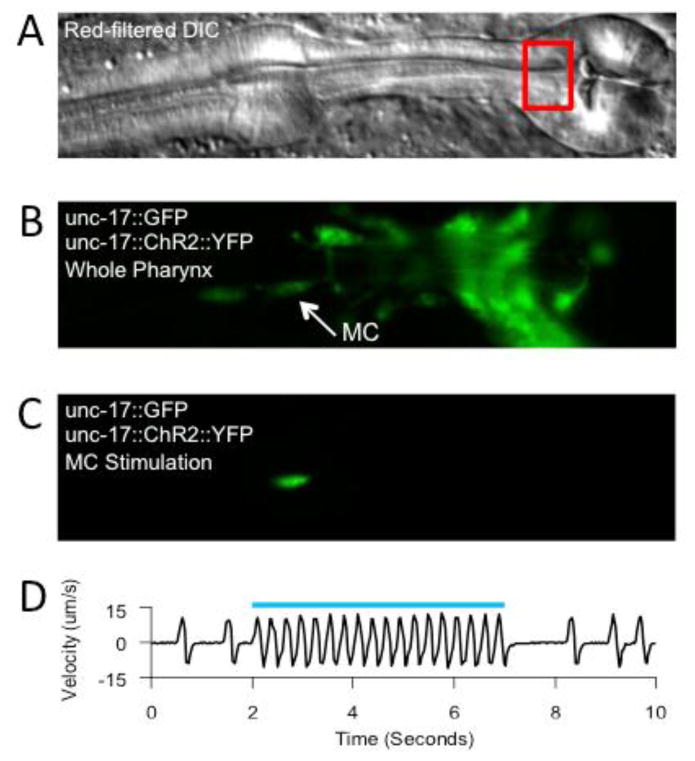
A: DIC image of the pharynx. Black box denotes region used for velocity calculations. B: wide field GFP fluorescence image of the same field of view as in A. The arrow points to an MC soma. C: GFP fluorescence image of the same field of view as in A and B, during selective illumination of an MC soma. D: Velocity from PIV algorithm during ChR2-mediated stimulation of the MC neurons. Each peak in the velocity represents a pump. The blue bar represents timing of laser illumination. Modified from Trojanowski et al., 2014 with permission from American Physiological Society.
E. Analyzing the data
The following steps should be repeated for each experiment.
If desired, convert the images into JPEG files. (see Note 22)
Use the roipoly function in MATLAB to draw a ROI around the brightest part of the neuron that was stimulated during the experiment. (see Note 28)
Use MATLAB to track the pixel intensity of this region over the course of experiment.
Use MATLAB to identify the times at which the intensity of this region sharply increased or decreased. These are the times at which the stimulus was turned on and off, respectively.
Use MATLAB to select the rectangular region of the terminal bulb just anterior to the grinder. (see Note 29 and Figure 2A)
Using the freely available package PIVlab, a Time-Resolved Digital Particle Image Velocimetry Tool for MATLAB, track the velocity this region over time. (see Note 30 and Figure 2D)
Use this trace of velocity over time to identify the times at which a pump occurred by drawing a threshold and recording the times at which a positive-going threshold crossing occurs. (see Note 31)
Determine the number of pumps that occur during each interval in which the stimulus is on or off. (see Note 32)
Divide the number of pumps in a stimulus interval by the length of that stimulus interval to find the average pump rate. (see Note 33)
Notes
-
Note 1
Our setup uses a Leica DMI3000B inverted microscope with a Leica Plan Apo 63X oil immersion objective lens with N.A.= 1.4. Any microscope with a port that allows direct access to the back of the objective should suffice. An inverted microscope may be easier to set up due to the lower height of the fluorescence illumination path, but an upright microscope could be used as well.
-
Note 2
The distance between the 6.24 mm lens and the 75 mm lens must be ∼81.24 mm, but the distances from 75 mm lens to the irises, between the irises, and between the irises and the laser, can be arbitrary. Our rig is partially designed to work with a 532 nm laser as well as a 473 nm laser, so we use a system of mirrors and a dichroic beam splitter to allow us to use these two lasers through the same optical path. If you only wish to use one laser, you can aim it directly through the irises, though we find it useful to have the beam reflect off at least one mirror before entering the irises, because it is easier to precisely adjust the tilt angle of the mirror than that of the laser.
-
Note 3
For the Leica DMI3000B, the fluorescent light port in the rear of the microscope contained optics of unknown parameters, so we used a side auxiliary port and custom filter cube (Nuhsbaum Inc.) that allowed direct access to the back of the objective.
-
Note 4
You should adjust this position so that a sharp back-scattered image through the objective forms 200 mm away beyond the lens. It is difficult to measure the 200 mm distance from the back of the objective to this lens precisely, so you may need to adjust this lens empirically later. If this lens needs to be adjusted after all the other lenses are set up, it may be easier to adjust the position of the microscope rather than move all the optics.
-
Note 5
Due to spatial constraints, we put a mirror between the 200 mm lenses. This is fine so long as the total distance along the light path between the lenses is 400 mm.
-
Note 6
The 100 mm distance here should be adjusted empirically so that a crisp back-scattered image from the microscope appears on the DMD and is centered on the grid of mirrors, covering it completely.
-
Note 7
The laser beam should just barely cover the DMD. If this is not the case, then you likely need to adjust the two smaller lenses so that the beam is not changing in size after it exits the 75 mm lens.
-
Note 8
To do this, the light must be incident onto the DMD from the lower right, if you are facing the DMD. We find that is easiest to use multiple mirrors to reflect the laser beam at the correct angle, as this provides multiple degrees of freedom for adjustment
-
Note 9
This will allow a large amount of the light to pass through but will reflect a small fraction without disrupting the direction of the laser beam. You can measure the light power reflected and the light power at the objective to determine the percentage of light that is reflected, and use this relationship to determine the light power at the objective at any time.
-
Note 10
Alternatively, a beam splitter could be built in house with similar optics to those in the DV2.
-
Note 11
In order to target a specific region of the microscope stage, you must first identify the DMD coordinates that correspond to this region. This process will need to be repeated if any of the optics are inadvertently bumped, so make sure that all of the optics are tightly fastened to the table before beginning this step.
-
Note 12
It is essential that the opsin of interest is tagged with an appropriate fluorescent protein (we used blue light to excite ChR2 and Mac, so we used opsins tagged with YFP or GFP). However, we found that for some transgenes the ChR2∷YFP was not bright enough to resolve neuron processes (for example, zxIs6[unc-17p∷ChR2(H134R)∷YFP + lin-15(+)]), likely because the ChR2 is membrane bound. After confirming expression in the relevant cell bodies, we crossed strains containing dim transgenes into a strain that expressed cytoplasmic GFP under the same promoter (we used vsIs48[unc-17∷GFP]). We found this particularly useful for looking at off-target effects during ablation experiments, were we wanted to determine the effect of stimulating processes near a cell body after killing the cell body.
-
Note 13
We stored ATR-seeded plates at 4°C for up to one week before use.
-
Note 14
We make the agarose mixture fresh for each experiment. 5-HT is necessary for inducing a basal pumping rate during immobilization. Other drugs can be added at this step as desired, though we found that adding too many ionic salts (more than 10mM) caused the polystyrene beads to clump and made immobilization difficult.
-
Note 15
We have found that the flexibility of the plastic spatulas makes it easier to get all the agarose out of the centrifuge tube, compared to stainless steel spatulas, and their low thermal mass may prevent premature cooling of the agarose.
-
Note 16
We are usually able to make 6 slides from 2 mL of agarose solution.
-
Note 17
We store 100 μL aliquots of polystyrene beads at 4°C between uses.
-
Note 18
When the pads contain 5-HT, the beads clump quickly after they are added to the pad, which reduces the quality of immobilization. Thus, we try to have the beads on the pad for as little time as possible before we add the cover slip.
-
Note 19
We use an exposure time of 30 ms, which produces a frame rate of 32.7 Hz. We set the laser power so that the irradiance of the laser at the objective is approximately 37 mW/mm2, well above the saturation irradiance of ChR2 [26]. These settings can be adjusted to increase the visibility of the fluorescent signal, if necessary.
-
Note 20
Because of the way the DV2 splits the camera field of view, it is important that the head of the worm is close to aligned with the long direction of each channel's field of view (within ∼30 degrees). If the head is not aligned in this manner, rotate the slide or select a different worm on the slide. Do not rotate the camera, or you will have to re-register the DMD and camera images.
-
Note 21
It is important that the grinder is visible in the camera's field of view, since its motion will later be used to quantify feeding rate. It is also important that the locations of the neurons of interest are visible in the camera. For pharyngeal neurons, this should not be an issue as long as the worm is aligned as described in Note 20.
-
Note 22
The Andor iXon 885 and Andor SOLIS software produce images as multipage TIFF files. We find it easier to work with JPEG files than multipage TIFF files, but this is a lossy compression and may increase noise.
-
Note 23
This should be a region slightly larger than the cell body – about 2-3 μm in diameter – to allow constant stimulation as the neural cell bodies move during the pump. It is important that the neuron of interest remains in this region during the entire experiment, because the fluorescent signal from this neuron will be used to determine the times of stimulation post hoc. Counterintuitively, we found it difficult to immobilize some paralyzed mutants, in which case we found it necessary to use a substantially larger stimulus region to ensure the neuron of interest was stimulated during the entire experiment.
-
Note 24
The DMD mirrors can be set in either the ON or OFF position, so we pass an image that contains 1s (representing ON) in locations corresponding to the area of the stage we wish to illuminate and 0s (representing OFF) elsewhere.
-
Note 25
The DMD works by reading in images that represent the pattern it should display and displaying this pattern, then pausing for a defined period, then reading in the next file, and so on. For our experiments, we begin with an all-off image for 5 seconds, followed by 5 seconds of illumination of the neuron of interest, followed by an all-off image for 5 seconds, repeating up to 10 times and ending with an all-off image.
-
Note 26
We record the baseline for 30 seconds.
-
Note 27
We wait 2-3 minutes between running each script, i.e. between each neuron we stimulate. We found that the behavior was most robust when experiments were performed within 90 minutes of immobilization.
-
Note 28
Here we find it better to use a ROI smaller than that used for the experiment, because it is easier to detect changes in brightness when just looking at the brightest parts of the neuron.
-
Note 29
We found that using a rectangle that extends from the anterior edge of the terminal bulb to the grinder, and is just slightly wider than the grinder, provides the best signal.
-
Note 30
Tracking the velocity of this region over time will show a series of spikes, each representing a pump: a positive change in velocity represents the movement of the grinder towards the posterior, and a negative change in velocity represents anterior movement.
-
Note 31
We found that using a threshold of half of the maximum velocity provided high sensitivity and specificity, though a wide range of threshold values will give the same result on a good recording.
-
Note 32
We did this for each stimulus interval by finding the number of pumps for which the value (pump time – stimulus time) was greater than 0 but less than the time between when the stimulus turned on and when it turned off.
-
Note 33
The pumping rate during the stimulus-off windows is sometimes lower the initial baseline, likely due to post-excitatory inhibition, so we typically do not use these values for looking at the effect of neuron stimulation. Rather, we use the pumping rate that we get from step D10 as the baseline.
Acknowledgments
We thank Olivia Padovan-Merhar for assistance writing MATLAB scripts and David Raizen for valuable comments and suggestions. Some strains were provided by Alexander Gottschalk and the Caenorhabditis Genetics Center (CGC), which is funded by National Institutes of Health (NIH) Office of Research Infrastructure Programs (P40-OD-010440). This work was supported by the National Institute of Neurological Disorders and Stroke of the NIH under Award R01-NS-084835 (C. Fang-Yen), the National Heart, Lung, and Blood Institute of the NIH Award T31-HL-07953 (N.F. Trojanowski; principal investigator: Allen I. Pack), the Ellison Medical Foundation (C. Fang-Yen), and an Alfred P. Sloan Foundation Research Fellowship (C. Fang-Yen).
References
- 1.Xu XZS, Kim SK. The early bird catches the worm: new technologies for the Caenorhabditis elegans toolkit. Nature Reviews Genetics. 2011;12:793–801. doi: 10.1038/nrg3050. [DOI] [PMC free article] [PubMed] [Google Scholar]
- 2.Bargmann CI, Marder E. From the connectome to brain function. Nature Methods. 2013;10:483–490. doi: 10.1038/nmeth.2451. [DOI] [PubMed] [Google Scholar]
- 3.Goodman MB, Lindsay TH, Lockery SR, Richmond JE. Electrophysiological methods for Caenorhabditis elegans neurobiology. Methods in Cell Biology. 2012;107:409–436. doi: 10.1016/B978-0-12-394620-1.00014-X. [DOI] [PMC free article] [PubMed] [Google Scholar]
- 4.Bargmann CI, Avery L. Laser killing of cells in Caenorhabditis elegans. Methods in Cell Biology. 1995;48:225–250. doi: 10.1016/s0091-679x(08)61390-4. [DOI] [PMC free article] [PubMed] [Google Scholar]
- 5.Fang-Yen C, Gabel CV, Samuel ADT, et al. Laser microsurgery in Caenorhabditis elegans. Methods in Cell Biology. 2012;107:177–206. doi: 10.1016/B978-0-12-394620-1.00006-0. [DOI] [PMC free article] [PubMed] [Google Scholar]
- 6.Steger KA, Shtonda BB, Thacker CM, et al. The C. elegans T-type calcium channel CCA-1 boosts neuromuscular transmission. Journal of Experimental Biology. 2005;208:2191–2203. doi: 10.1242/jeb.01616. [DOI] [PMC free article] [PubMed] [Google Scholar]
- 7.Deisseroth K. Optogenetics. Nature Methods. 2010;8:26–29. doi: 10.1038/nmeth.f.324. [DOI] [PMC free article] [PubMed] [Google Scholar]
- 8.Husson SJ, Gottschalk A, Leifer AM. Optogenetic manipulation of neural activity in C. elegans: From synapse to circuits and behaviour. Biology of the Cell n/a–n/a. 2013 doi: 10.1111/boc.201200069. [DOI] [PubMed] [Google Scholar]
- 9.Voutev R, Hubbard EJA. A “FLP-Out” System for Controlled Gene Expression in Caenorhabditis elegans. Genetics. 2008;180:103–119. doi: 10.1534/genetics.108.090274. [DOI] [PMC free article] [PubMed] [Google Scholar]
- 10.Davis MW, Morton JJ, Carroll D, Jorgensen EM. Gene activation using FLP recombinase in C. elegans. PLoS Genet. 2008;4:e1000028. doi: 10.1371/journal.pgen.1000028. [DOI] [PMC free article] [PubMed] [Google Scholar]
- 11.Wei X, Potter CJ, Luo L, Shen K. Controlling gene expression with the Q repressible binary expression system in Caenorhabditis elegans. Nature Methods. 2012;9:391–395. doi: 10.1038/nmeth.1929. [DOI] [PMC free article] [PubMed] [Google Scholar]
- 12.Schmitt C, Schultheis C, Husson SJ, et al. Specific Expression of Channelrhodopsin-2 in Single Neurons of Caenorhabditis elegans. PLoS ONE. 2012;7:e43164. doi: 10.1371/journal.pone.0043164.t004. [DOI] [PMC free article] [PubMed] [Google Scholar]
- 13.Guo ZV, Hart AC, Ramanathan S. Optical interrogation of neural circuits in Caenorhabditis elegans. Nature Methods. 2009;6:891–896. doi: 10.1038/nmeth.1397. [DOI] [PMC free article] [PubMed] [Google Scholar]
- 14.Leifer AM, Fang-Yen C, Gershow M, et al. Optogenetic manipulation of neural activity in freely moving Caenorhabditis elegans. Nature Methods. 2011;8:147–152. doi: 10.1038/nmeth.1554. [DOI] [PMC free article] [PubMed] [Google Scholar]
- 15.Stirman JN, Crane MM, Husson SJ, et al. Real-time multimodal optical control of neurons and muscles in freely behaving Caenorhabditis elegans. Nature Methods. 2011;8:153–158. doi: 10.1038/nmeth.1555. [DOI] [PMC free article] [PubMed] [Google Scholar]
- 16.Kocabas A, Shen C-H, Guo ZV, Ramanathan S. Controlling interneuron activity in Caenorhabditis elegans to evoke chemotactic behaviour. Nature. 2012:1–6. doi: 10.1038/nature11431. [DOI] [PMC free article] [PubMed] [Google Scholar]
- 17.Avery L, You Y-J. C. elegans feeding. Wormbook. 2012:1–23. doi: 10.1895/wormbook.1.150.1. [DOI] [PMC free article] [PubMed] [Google Scholar]
- 18.Trojanowski NF, Padovan-Merhar O, Raizen DM, Fang-Yen C. Neural and genetic degeneracy underlies Caenorhabditis elegans feeding behavior. Journal of Neurophysiology. 2014;112:951–961. doi: 10.1152/jn.00150.2014. [DOI] [PMC free article] [PubMed] [Google Scholar]
- 19.Zhang F, Wang L-P, Brauner M, et al. Multimodal fast optical interrogation of neural circuitry. Nature. 2007;446:633–639. doi: 10.1038/nature05744. [DOI] [PubMed] [Google Scholar]
- 20.Chow BY, Han X, Dobry AS, et al. High-performance genetically targetable optical neural silencing by light-driven proton pumps. Nature. 2010;463:98–102. doi: 10.1038/nature08652. [DOI] [PMC free article] [PubMed] [Google Scholar]
- 21.Waschuk SA, Bezerra AG, Shi L, Brown LS. Leptosphaeria rhodopsin: bacteriorhodopsin-like proton pump from a eukaryote. Proceedings of the National Academy of Sciences of the United States of America. 2005;102:6879–6883. doi: 10.1073/pnas.0409659102. [DOI] [PMC free article] [PubMed] [Google Scholar]
- 22.Okazaki A, Takahashi M, Toyoda N, Takagi S. Optical silencing of C. elegans cells with light-driven proton pumps. Methods. 2014;68:425–430. doi: 10.1016/j.ymeth.2014.02.030. [DOI] [PubMed] [Google Scholar]
- 23.Kim E, Sun L, Gabel CV, Fang-Yen C. Long-Term Imaging of Caenorhabditis elegans Using Nanoparticle-Mediated Immobilization. PLoS ONE. 2013;8:e53419. doi: 10.1371/journal.pone.0053419.g005. [DOI] [PMC free article] [PubMed] [Google Scholar]
- 24.Raizen DM, Song B-M, Trojanowski NF, You Y-J. Methods for measuring pharyngeal behaviors. Wormbook. 2012:1–23. doi: 10.1895/wormbook.1.154.1. [DOI] [PMC free article] [PubMed] [Google Scholar]
- 25.Stiernagle T. Maintenance of C. elegans. Wormbook. 2006 doi: 10.1895/wormbook.1.101.1. [DOI] [PMC free article] [PubMed] [Google Scholar]
- 26.Grossman N, Nikolic K, Toumazou C, Degenaar P. Modeling study of the light stimulation of a neuron cell with channelrhodopsin-2 mutants. IEEE Trans Biomed Eng. 2011;58:1742–1751. doi: 10.1109/TBME.2011.2114883. [DOI] [PubMed] [Google Scholar]