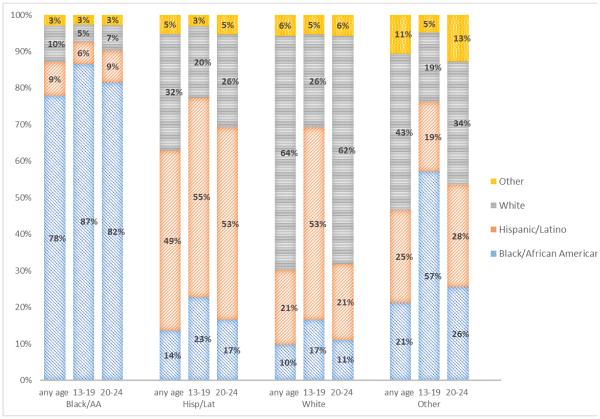
Figure 1. Estimated proportion of potential transmission partners of different racial/ethnic groups, 2001–2012—21 U.S. states and the District of Columbia.
Bar chart depicts the proportion of potential HIV transmission partners of men who have sex with men from different racial/ethnic groups for any age at HIV diagnosis and for those 13-19 years and 20-24 years of age, by race/ethnicity.

