Abstract
Background:
Central nervous system (CNS) metastases represent a major problem in the treatment of human epidermal growth factor receptor 2 (HER2)–positive breast cancer because of the disappointing efficacy of HER2-targeted therapies against brain lesions. The antibody-drug conjugate ado-trastuzumab emtansine (T-DM1) has shown efficacy in trastuzumab-resistant systemic breast cancer. Here, we tested the hypothesis that T-DM1 could overcome trastuzumab resistance in murine models of brain metastases.
Methods:
We treated female nude mice bearing BT474 or MDA-MB-361 brain metastases (n = 9–11 per group) or cancer cells grown in organotypic brain slice cultures with trastuzumab or T-DM1 at equivalent or equipotent doses. Using intravital imaging, molecular techniques and histological analysis we determined tumor growth, mouse survival, cancer cell apoptosis and proliferation, tumor drug distribution, and HER2 signaling. Data were analyzed with one-way analysis of variance (ANOVA), Kaplan-Meier analysis, and Coefficient of Determination. All statistical tests were two-sided.
Results:
T-DM1 delayed the growth of HER2-positive breast cancer brain metastases compared with trastuzumab. These findings were consistent between HER2-driven and PI3K-driven tumors. The activity of T-DM1 resulted in a survival benefit (median survival for BT474 tumors: 28 days for trastuzumab vs 112 days for T-DM1, hazard ratio = 6.2, 95% confidence interval = 6.1 to 85.84, P < .001). No difference in drug distribution or HER2-signaling was revealed between the two groups. However, T-DM1 led to a statistically significant increase in tumor cell apoptosis (one-way ANOVA for ApopTag, P < .001), which was associated with mitotic catastrophe.
Conclusions:
T-DM1 can overcome resistance to trastuzumab therapy in HER2-driven or PI3K-driven breast cancer brain lesions due to the cytotoxicity of the DM1 component. Clinical investigation of T-DM1 for patients with CNS metastases from HER2-positive breast cancer is warranted.
Treatment of brain metastases (BM) remains an unmet need in the management of human epidermal growth factor receptor 2 (HER2)–positive breast cancer. The current treatment of BM is largely palliative and mostly based on local therapies (1–4). Survival ranges from six to 18 months, even with the advent of multidisciplinary therapeutic strategies (5,6). HER2-targeted drugs such as trastuzumab efficiently control systemic extracranial disease; their efficacy against BM remains, however, limited (7,8). Even small-molecule HER2 inhibitors with improved delivery into brain lesions show a lack of efficacy that is marginally increased through the combination with other therapies (9–11). The poor prognosis of BM emphasizes the necessity to optimize targeted treatments with efficacy in the CNS.
Recently, the US Food and Drug Administration approved the antibody-drug conjugate (ADC) ado-trastuzumab emtansine (T-DM1) for HER2-positive metastatic breast cancer. The phase III EMILIA trial demonstrated a statistically significant survival improvement with T-DM1 compared with lapatinib/capecitabine in patients previously treated with trastuzumab and taxanes (12,13). Moreover, in the phase III TH3RESA study T-DM1 statistically significantly improved progression-free survival compared with physician’s choice in patients with advanced disease that progressed after at least two HER2-directed regimens (14). The efficacy of T-DM1 is two-fold: The drug binds and blocks HER2 on tumor cells and releases the cytotoxic component DM1 after it undergoes intracellular lysosomal degradation (15,16).
Knowledge concerning the efficacy of T-DM1 against BM is limited. Based on its efficacy against trastuzumab-resistant breast cancer, we hypothesized that T-DM1 could be effective against HER2-positive BM. Despite its large molecular weight, we hypothesized that T-DM1 can achieve adequate concentrations in brain lesions. This hypothesis is supported by the heterogeneous leakiness of the tumor vasculature, which permits the extravasation of macromolecules through the so-called “blood-tumor barrier” (BTB) (17). Consistent with this notion, PET studies showed adequate accumulation of radiolabeled trastuzumab in BM (18).
To investigate the potential of T-DM1 in the CNS, we used clinically relevant mouse models of BM and established HER2-positive breast cancer cells cultured on brain slices and high-resolution imaging technologies.
Methods
Tumor Models
Female nude mice age eight weeks were implanted with a 0.36mg, 60-day or 90-day release 17β-estradiol pellet (Innovative Research of America, Sarasota, FL) 24 hours before implantation of tumor cells and every 60 to 90 days thereafter. Mice were anesthetized with ketamine (90mg/kg BW) and xylazine (9mg/kg BW). One hundred thousand BT474-Gluc or MDA-MB-361-Gluc cells diluted in 1 μL PBS were stereotactically injected in the left frontal lobe of the mouse brain as previously described (19). For the intracarotid model, 200 000 BT474-Gluc cells diluted in 100 μL PBS were injected through a catheter in the left carotid artery. For the mammary fat pad model, 5x10⁶ BT474-Gluc cells were suspended in a 50 μL mixture of PBS and Matrigel Matrix High Concentration (BD Biosciences) at a 1:1 ratio before injection. All animal procedures were performed according to the guidelines of the Public Health Service Policy on Human Care of Laboratory Animals and in accordance with a protocol approved by the Institutional Animal Care and Use Committee of Massachusetts General Hospital.
Reagents and Treatments
Trastuzumab and T-DM1 were obtained from the Massachusetts General Hospital pharmacy. Trastuzumab and nonspecific human IgG (Jackson ImmunoResearch Laboratories, Inc., West Grove, PA) were administered weekly at a concentration of 15mg/kg or 6mg/kg body weight i.p. T-DM1 was administered weekly at a concentration of 15mg/kg, 5mg/kg, or 3.6mg/kg body weight i.v. Paclitaxel (Hospira Inc, Australia) was administered at a dose of 6.5mg/kg i.p. weekly. Mice were randomly assigned before treatment initiation, when the tumor volume reached 5 to 6mm3. For BT474-Gluc and MDA-MB-361-Gluc, this corresponds to Gluc values of ~60 000 RLU/s and approximately 500 000 RLU/s, respectively (Supplementary Materials and Supplementary Figure 1, A-E, available online). Mice were sacrificed when they lost more than 20% body weight or exhibited signs of prolonged distress or neurological impairment.
Organotypic Brain Slice Cultures
200 µm thick brain slices were obtained from postnatal day 17 to 20 mice using a Compresstome Vf-300 microtome (Precisionary Instruments, Greenville, NC). Slices were cultured into inserts with 50% MEM, 25% EBSS, 25% HS, Gentamycin and Glucose (Invitrogen Life Technologies, Grand Island, NY). Seven thousand five hundred BT474-Gluc cells were injected into the cortical layers four to six days after slice preparation (Supplementary Figure 1, F and G, available online). Medium was collected every two days, and Gluc activity was measured with a Promega Glomax 96 microplate luminometer (Fisher Scientific, Waltham, MA).
Electron Microscopy
Tissues were fixed in electron microscopy fixative (2.5% glutaraldehyde, 2.0% paraformaldehyde; 0.025% calcium chloride in a 0.1M sodium cacodylate buffer, pH 7.4). Toluidine blue staining (0.5% toluidine blue in aqueous 0.5% sodium borate) was performed for light microscopy. Sections were cut using a diamond knife, and an LKB 2088 ultramicrotome and electron microscopy was performed in an FEI Morgagni transmission electron microscope. Further details are provided in the Supplementary Methods (available online).
Whole Transcriptome Microarray Analysis
RNA was extracted from BT474-Gluc BM, which were snap-frozen 48 hours post-treatment with trastuzumab or T-DM1 (15mg/kg). Biotin-labeled samples were hybridized to GeneChip Human Gene 2.0 ST Arrays (PC043) according to the manufacturer’s instructions. Raw data from gene arrays are available at Gene Expression Omnibus (GEO accession number: GSE69042). Differential gene expression was tested using Significance Analysis of Microarrays and Bioconductor’s limma package (Supplementary Methods, available online). A custom gene set, associated with mitotic catastrophe (20) was assembled. Gene set enrichment analysis was performed using gene set permutation and signal-to-noise ratio as a ranking metric. Further details are provided in the Supplementary Methods (available online).
Immunostaining
Primary antibodies included: cleaved caspase 3 (CC3, cell signaling, rabbit mAb #9664, 1:50), cluster differentiation factor 31 (CD31, endothelial cell marker, Millipore, MAB1398Z, mouse mAb, 1:200) and human IgG (Invitrogen, Cat# A-21091, 1:100). Apoptag (ApopTag Peroxidase In Situ Apoptosis Detection Kit, #S7100, Millipore) was used as apoptosis marker. Further details are provided in the Supplementary Methods (available online).
Western Blotting
Protein was collected from tumors 48 hours after single treatment. All primary antibodies were obtained from Cell Signaling Technologies, Danvers, MA. Primary antibodies included monoclonal rabbit antibodies for HER2 (Cat#2165, 1:1000), pHER2 (Cat#2243, 1:1000), Akt (Cat#4691, 1:1000), pAkt (Cat#4060, 1:1000), Erk1/2 (Cat#9102, 1:1000), pErk1/2 (Cat#4370, 1:1000), S6 (Cat#2217, 1:1000) and pS6 (Cat#5364, 1:1000). Rabbit antihuman IgG antibody was provided by Abcam (polyclonal, Cat#ab6759, 1:5000). Further details are provided in the Supplementary Methods (available online).
Statistical Analysis
Statistical analysis was performed using the Data Analysis and Statistical Software STATA 13.1 and Prism 6 (GraphPad Software Inc., La Jolla, CA). All statistical tests were two-sided. A difference was considered statistically significant at a P value of less than .05. Comparisons of continuous outcomes were performed using the one-way analysis of variance (ANOVA) test with Bonferroni-Holms correction for categorical and t test (two-tailed with unequal variance) for dichotomous explanatory variables. Statistical analysis of the survival data was carried out using the Kaplan-Meier method. Hazard ratios (HRs) and confidence intervals (CIs) in survival studies were calculated using the nonparametric log-rank test. Coefficient of Determination (R2) was calculated to analyze a correlation between two continuous variables.
Results
The Effect of T-DM1 Treatment on BM Growth and Mouse Survival
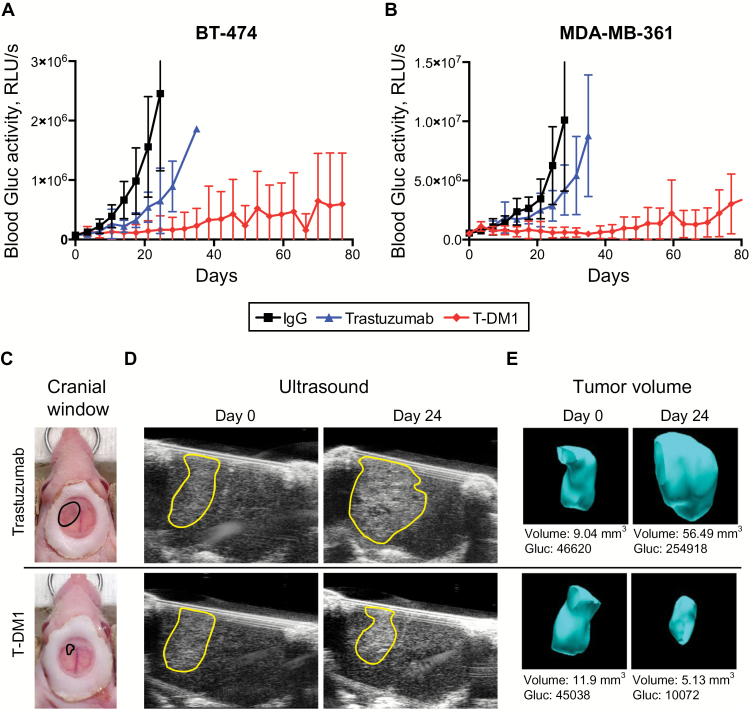
We treated mice bearing BT474-Gluc or MDA-MB-361-Gluc BM with T-DM1, trastuzumab, or control IgG at the same dose (15mg/kg) (n = 9–11). Whereas trastuzumab slowed the growth of BT474-Gluc BM by a median of 10 days compared with control IgG (1.7-fold), treatment with T-DM1 led to a median tumor growth delay of 60 days (5.3-fold) (Figure 1A) (Time-to-10x Gluc, trastuzumab vs T-DM1: HR = 3.68, 95% CI = 1.76 to 22.17, P = .01) (Table 1). A similar effect was measured in MDA-MB-361-Gluc BM, which are HER2-amplified but also harbor an activating PIK3CA mutation (E545K) (Figure 1B) (Time-to-10x Gluc; trastuzumab vs T-DM1: HR = 3.08, 95% CI = 2.72 to 70.65, P = .01) (Table 1). The differences in Gluc activity correlated with a delay in morphological tumor growth as monitored with ultrasonography (Figure 1, C-E).
Figure 1.
Differential response of human epidermal growth factor receptor 2 (HER2)–positive breast cancer lesions to trastuzumab or T-DM1 in the central nervous system (CNS) microenvironment. BT474-Gluc (A) and MDA-MB-361-Gluc (B) tumors growing in the brain were treated with trastuzumab or T-DM1 (15mg/kg), and blood Gluc activity (relative light units per sec [RLU/s]) was measured over time. Nonspecific human IgG was used as control at the same dose (n = 9–11). C) Cranial windows were placed to monitor BT474-Gluc tumor volume. Representative images of size- and time-matched BT474-Gluc tumors 24 days after treatment initiation. D) Representative ultrasonography images of size- and time-matched BT474-Gluc tumors treated with trastuzumab or T-DM1 (15mg/kg) at day 0 and day 24. E) Corresponding three-dimensional reconstruction of tumor volume. The Gaussia luciferase activity measured from blood samples correlates with tumor volume. RLU = relative light unit.
Table 1.
Median survival and median time-to-10xGluc of mice bearing BT474-Gluc and MDA-MD361-Gluc tumors in the brain
| Treatment, mg/kg | Survival, d BT474 |
10xGluc, d BT474 |
Survival, d MDA-MD-361 |
10xGluc, d MDA-MD-361 |
|---|---|---|---|---|
| IgG, 15 | 25 | 14 | 35 | 25 |
| Trastuzumab, 15 | 28 | 24 | 49 | 32 |
| T-DM1, 15 | 112 | 74 | 133 | 77 |
| T-DM1, 5 | 46 | 28 | * | 56 |
* Median survival not reached. d = days
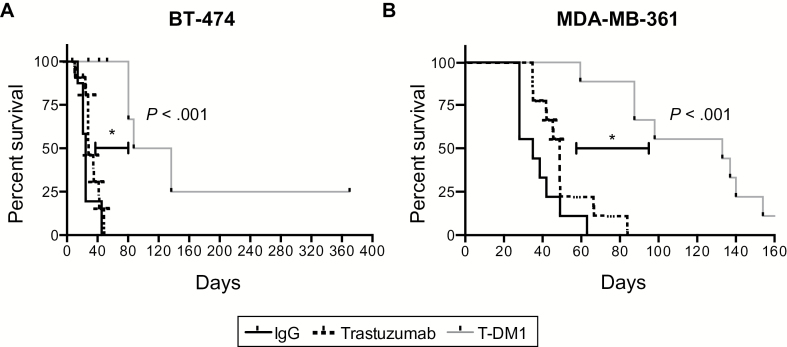
The delay of BM growth corresponded to a statistically significant improvement in mouse survival. Median survival for T-DM1 was four-fold greater than trastuzumab (112 days vs 28 days) in BT474-Gluc BM (HR = 6.2, 95% CI = 6.1 to 85.84, P < .001) (Figure 2A and Table 1). Similarly, we noted a 2.7-fold increase in median survival in mice bearing MDA-MB-361-Gluc BM (HR = 4.49, 95% CI = 5.40 to 58.17, P < .001) (Figure 2B and Table 1).
Figure 2.
Effect of T-DM1 on survival of mice with established human epidermal growth factor receptor 2–positive breast cancer brain metastases. Kaplan-Meier survival analysis of mice bearing BT474-Gluc (A) or MDA-MB-361-Gluc tumors (B) in the brain after treatment with control IgG, trastuzumab, or T-DM1 (15mg/kg) (n = 9–11). All statistical tests were two-sided.
To test whether the model of direct intracranial injection might influence the efficacy of T-DM1 on BM, we repeated the studies in a BM model after intracarotid injection of BT474-Gluc cells (n = 8). T-DM1 delayed tumor growth compared with trastuzumab at the same dose (15mg/kg) (Supplementary Figure 2A, available online) and led to a statistically significant survival improvement (HR = 10.98, 95% CI = 2.11 to 36.20, P = .003) (Supplementary Figure 2B, available online).
To mimic the clinical situation, we compared the efficacy of T-DM1 to the efficacy of trastuzumab in combination with taxane-based chemotherapy at doses similar to the clinical doses (3.6mg/kg weekly for T-DM1, 6mg/kg weekly for trastuzumab, and 6.5mg/kg weekly for paclitaxel; n = 8). The growth of BT474-Gluc BM was delayed by T-DM1 and trastuzumab plus paclitaxel but not by the monotherapies (trastuzumab or paclitaxel) (Supplementary Figure 3A, available online). This resulted in a statistically significant survival improvement (trastuzumab vs T-DM1: HR = 3.85, 95% CI = 1.94 to 21.17, P = .007; paclitaxel vs T-DM1: HR = 4.04, 95% CI = 2.49 to 27.66, P = .003) (Supplementary Figure 3B, available online). Despite a slightly improved median survival (49 days vs 42 days), there was no statistical difference between T-DM1 and trastuzumab plus paclitaxel (HR = 1.03, 95% CI = 0.25 to 4.30, P = .95). However, we tested the efficacy of T-DM1 against BT474-Gluc BM that progressed under trastuzumab plus paclitaxel therapy (n = 4–5). T-DM1 delayed tumor progression (Supplementary Figure 3C, available online) and statistically improved survival (HR = 3.52, 95% CI = 2.19 to 61.75, P = .01) (Supplementary Figure 3D, available online).
Effects of T-DM1 or Trastuzumab in the Brain at Equipotent Doses in the Extracranial Setting
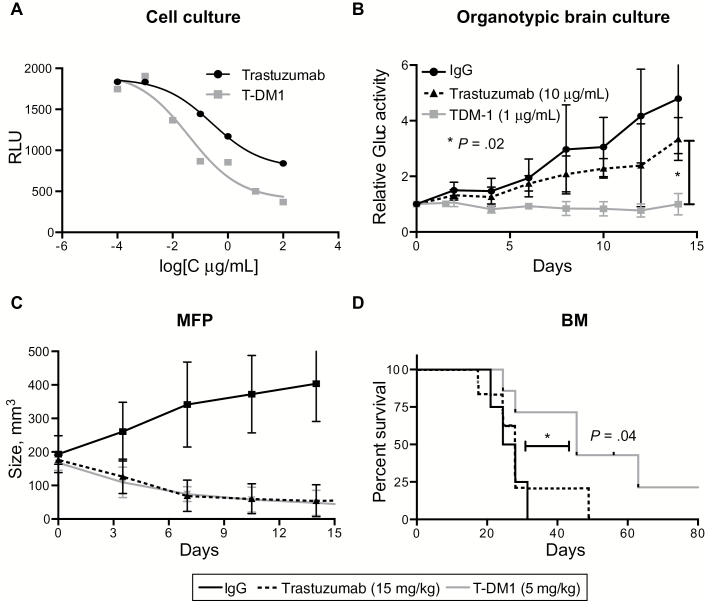
To test whether the superior response of HER2-positive BM to T-DM1 is solely explained by its differential potency and/or efficacy compared with trastuzumab, we first determined the EC50 values of both drugs on BT474-Gluc cells using an in vitro cell viability assay. The EC50 value for T-DM1 was approximately 10-fold lower than that of trastuzumab (0.039 μg/mL, 95% CI = 0.007 to 0.215, and 0.265 μg/mL, 95% CI = 0.049 to 1.439, respectively) (Figure 3A). Subsequently, we treated BT474-Gluc cells growing in organotypic brain slice cultures with concentrations of trastuzumab or T-DM1 that displayed equal response in vitro (10 μg/mL for trastuzumab and 1 μg/mL for T-DM1); 1 μg/mL of T-DM1, but not 10 μg/mL of trastuzumab, slowed the growth of BT474-Gluc cells in the brain slice cultures. The mean fold increase in Gluc-activity at day 14 to day 0 in the control IgG, trastuzumab, or T-DM1 groups was 4.79 (SD = 1.97), 3.34 (SD = 0.76), or 0.99 (SD = 0.38), respectively (one-way ANOVA, P = .02) (Figure 3B).
Figure 3.
T-DM1 vs trastuzumab in the brain microenvironment at doses of similar efficacy in the extracranial setting. A) In vitro Cell Titer Glo viability assay of BT474-Gluc breast cancer cells after treatment with trastuzumab or T-DM1 at various concentrations. B) Relative activity of Gaussia luciferase in the media of organotypic brain slice cultures with BT474-Gluc cells after treatment with trastuzumab (10 μg/mL) or T-DM1 (1μg/mL). Unspecific IgG was used as control at a concentration of 10 μg/mL (n = 6). C) Tumor volume of BT474-Gluc tumors growing in the mammary fat pad of mice, treated with trastuzumab (15mg/kg) or T-DM1 (5mg/kg) (n = 6). D) Kaplan-Meier survival analysis of mice bearing BT474-Gluc brain metastases after treatment with trastuzumab (15mg/kg) (n = 7) or T-DM1 (5mg/kg) (n = 7). Control IgG was used at a dose of 15mg/kg (n = 4). All statistical tests were two-sided. BM = brain metastasis; MFP = mammary fat pad; RLU = relative light unit.
To test if these findings translate to the in vivo setting, we determined that a dose of 15mg/kg of trastuzumab was similarly efficacious to a 5mg/kg dose of T-DM1 on the growth of BT474-Gluc primary tumors (Figure 3C). In the brain microenvironment, however, T-DM1 dosed at 5mg/kg improved survival (HR = 2.60, 95% CI = 1.31 to 16.43, P = .04), whereas trastuzumab dosed at 15mg/kg was ineffective (Table 1 and Figure 3D). Similarly, T-DM1 at 5mg/kg delayed the growth of MDA-MB-361-Gluc BM (Table 1).
The Effect of T-DM1 on Tumor Cell Apoptosis and Proliferation in BM
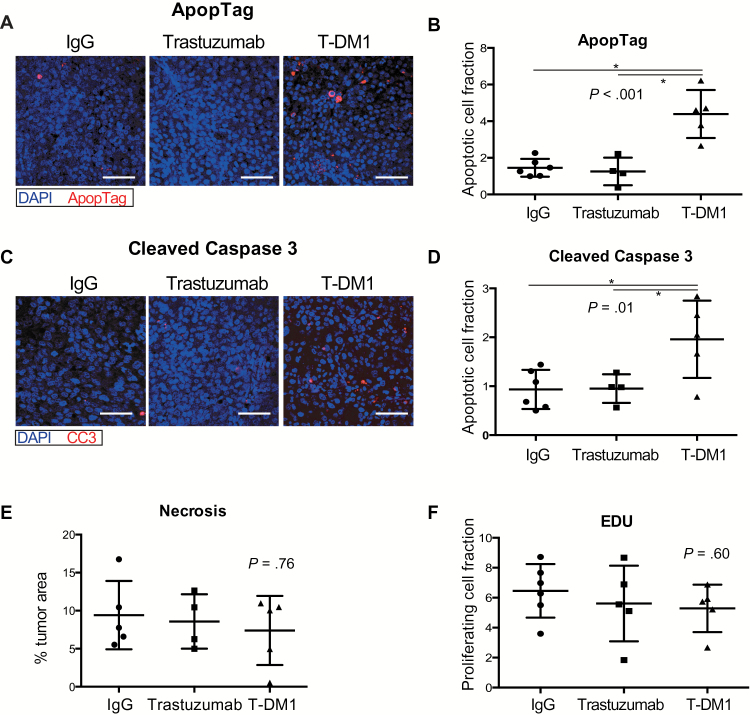
To compare the effects of T-DM1 and trastuzumab on tumor cell apoptosis in BM we stained for cleaved caspase 3 (CC3) and Apoptag five days after a single treatment. Apoptosis markers were increased in T-DM1–treated tumors. The mean percentages of positive cells for Apoptag in tumors treated with control IgG, trastuzumab, or T-DM1 were 1.4 (SD = 0.4), 1.2 (SD = 0.7), and 4.3 (SD = 1.3), respectively (one-way ANOVA, P < .001) (Figure 4, A and B). The mean values for CC3 were 0.9 (SD = 0.4) for control IgG, 0.9 (SD = 0.2) for trastuzumab, and 1.9 (SD = 0.7) for T-DM1 (one-way ANOVA, P = .01) (Figure 4, C and D). No difference in necrotic fraction between the groups was noticed (% tumor area, IgG: mean = 9.4, SD = 4.4; trastuzumab: mean = 8.5, SD = 3.5; T-DM1: mean = 7.3, SD = 4.5, one-way ANOVA, P = .76) (Figure 4E), suggesting that the difference in apoptosis is rather mediated by the drugs and not by unspecific effects.
Figure 4.
Effects of T-DM1 on apoptosis and tumor cell proliferation. A and C) Representative images of BT474-Gluc tumors in the brain after staining for ApopTag (A) or cleaved caspase 3 (C). Cell apoptosis was determined in BT474-Gluc brain metastases after quantification of ApopTag (B) or cleaved caspase 3 (D)–positive staining five days after a single treatment with control IgG, trastuzumab, or T-DM1 (15mg/kg) (n = 5–6). E) Necrotic tumor area is comparable between trastuzumab and T-DM1. Sections of BT474-Gluc tumors were stained five days after single treatment with control IgG, trastuzumab, or T-DM1 (15mg/kg) with hematoxylin and eosin (H&E) for necrosis (n = 5). F) EdU cell proliferation assay was applied for BT474-Gluc brain lesions five days after a single treatment with control IgG (n = 6), trastuzumab (n = 5), or T-DM1 (n = 5). Scale bars = 100 μm. Data are means ±SD. All statistical tests were two-sided.
To compare the effects of the drugs on tumor cell proliferation, we stained the same tissues for EdU. There was no difference in the percentage of EdU-positive cells between control IgG (mean = 6.4, SD = 1.7), trastuzumab (mean = 5.2, SD = 2.7), and T-DM1 (mean = 5.2, SD = 1.5), (one-way ANOVA, P = .60) (Figure 4F).
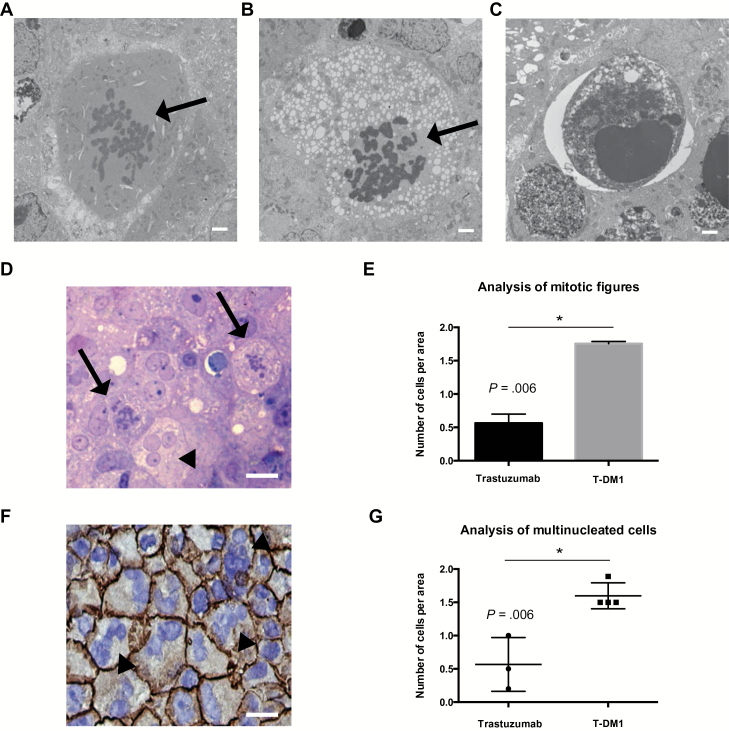
To provide mechanistic insight into how T-DM1 induces apoptosis in BM, we performed electron microscopy (EM) of BT474-Gluc BM treated with trastuzumab or T-DM1 (15mg/kg). EM revealed enhanced apoptosis and abnormal mitotic figures after treatment with T-DM1 (Figure 5, A-C). Quantification using light microscopy revealed increased numbers of abnormal mitotic figures in the T-DM1 group (trastuzumab: mean = 0.56, SD = 0.09; T-DM1: mean = 1.75, SD = 0.02, P = .006) (Figure 5, D and E). Moreover, immunohistochemistry (IHC) showed a statistically significant increase in the number of multinucleated cells in the T-DM1 group (trastuzumab: mean = 0.56, SD = 0.40; T-DM1: mean = 1.59, SD = 0.20, P = .006) (Figure 5, F and G).
Figure 5.
Effect of T-DM1 on number of abnormal mitotic figures and multinucleated cells in human epidermal growth factor receptor 2 (HER2)–positive breast cancer brain metastases. A-C) Electron microscopy images of BT474-Gluc brain metastases reveal abnormal mitotic figures (A, B, arrow) and cells undergoing apoptosis (C). Scale bars = 2 μm. D) Representative image of toluidin blue section (1 μm) of a BT474-Gluc brain lesion treated with T-DM1; the arrows indicate tumor cells with abnormal mitotic figures, and the arrowhead indicates a multinucleated tumor cell. E) Quantification of tumor cells with abnormal mitotic figures in BT474-Gluc tumors treated with trastuzumab or T-DM1 at the same dose (15mg/kg); surface area = 0.25mm2. F) Immunohistochemistry of BT474-Gluc brain metastases treated with T-DM1 shows an increased number of HER2-positive multinucleated cells (arrowheads) (blue: DAPI staining). Scale bar = 50 μm. G) Quantification of the number of multinucleated cells from BT474-Gluc tumors treated with trastuzumab or T-DM1 at the same dose (15mg/kg) (n = 3–4); surface area = 0.25mm2. E and G) Data are means ± SD. All statistical tests were two-sided.
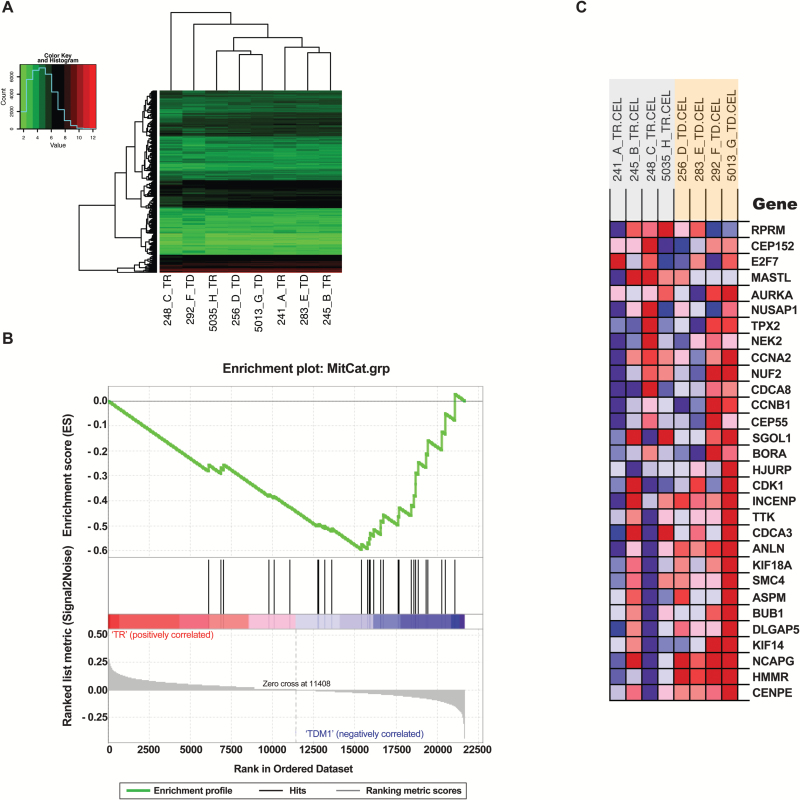
In addition, we performed whole-transcriptome microarray analysis of BT474-Gluc BM treated with trastuzumab or T-DM1 (n = 4). Gene expression profiles were highly similar. In a hierarchical clustering analysis, trastuzumab- and T-DM1–treated BM did not segregate into distinct groups (Figure 6A). After correcting for multiple testing, we were unable to detect individual genes that were different between the two treatments (Figure 6A). To test whether mitotic catastrophe–related genes as a group were enriched in T-DM1–treated BM, we used gene set enrichment analysis. Genes associated with biological responses that are linked to mitotic catastrophe (20) were enriched in T-DM1–treated BM (FDR q-value = 0.002) (Figure 6, B and C).
Figure 6.
Whole-transcriptome microarray analysis of BT-474-Gluc brain metastases treated with trastuzumab or T-DM1. A) Hierarchical clustering analysis (using Euclidian distance and complete linkage) of the 10% of transcripts with the highest variance across all samples (n = 4). B and C) Gene set enrichment analysis results for a custom set of genes (20) involved in spindle assembly checkpoint, centrosome amplification/maturation, and G2/M arrest (FDR q-value for enrichment in T-DM1 treated samples = 0.002). The heatmap colors in (C) indicate expression values (red = high; blue = low). TD = T-DM1; TR = trastuzumab.
The Distribution of T-DM1 and Trastuzumab in BM
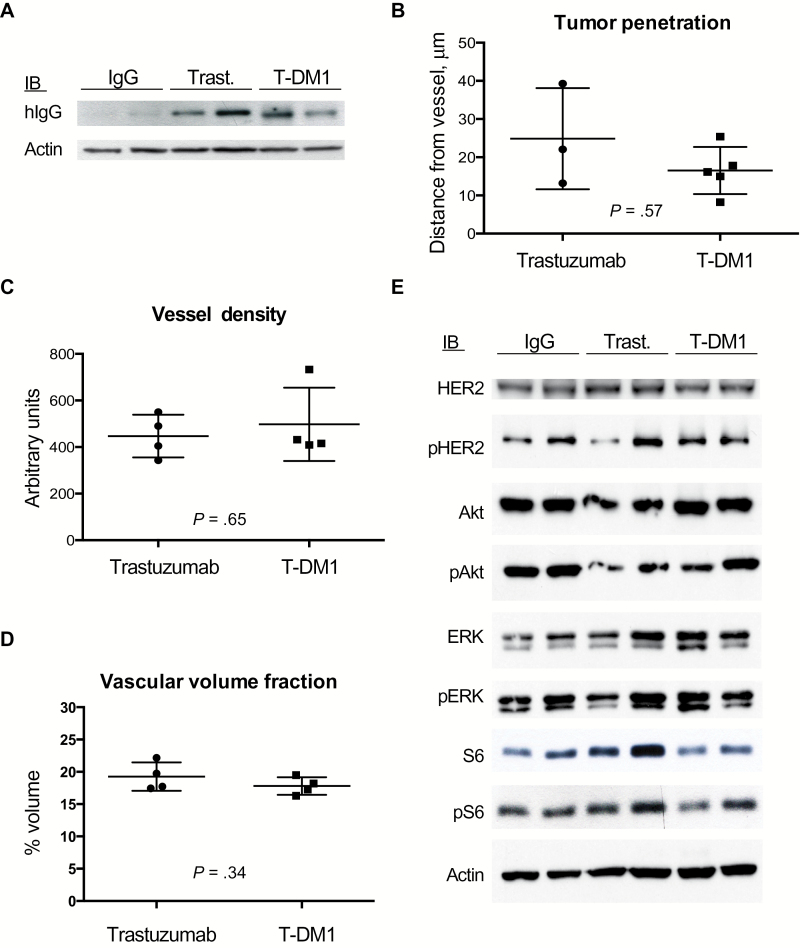
Tumor tissue was collected two days after a single dose of T-DM1, trastuzumab, or control IgG (15mg/kg), and western blot for human IgG1 was performed. Western blotting revealed a similar amount of trastuzumab and T-DM1 in BT474-Gluc BM and an absence of control IgG because of its lack of binding and/or retention (Figure 7A). Immunofluorescence (IF) of early human IgG distribution on tumor tissue collected two hours after a single treatment (n = 4) (Supplementary Figure 4, available online) revealed comparable perivascular penetration of trastuzumab (mean = 24.84 μm, SD = 13.24) and T-DM1 (mean = 16.51 μm, SD = 6.15; P = .57) (Figure 7B). Tumor vessel analysis using optical frequency domain imaging (OFDI) (Supplementary Figure 5, available online) showed no difference in vessel density (trastuzumab: mean = 447.09, SD = 91.64; T-DM1: mean = 497.44, SD = 157.34, P = .65) (Figure 7C) or vascular volume fraction (trastuzumab: mean = 0.19, SD = 0.02; T-DM1: mean = 0.17, SD = 0.01, P = .34) (Figure 7D) at the same time point. Together, these results indicate that there is no difference in the distribution of T-DM1 and trastuzumab in BM.
Figure 7.
The tumor distributions of T-DM1 and trastuzumab, as well as the human epidermal growth factor receptor 2 (HER2) signaling blockade in HER2-positive breast cancer brain lesions, are comparable. A) BT474-Gluc tumor tissue, collected two days after single treatment with control IgG, trastuzumab, or T-DM1 (15mg/kg), was analyzed by western blot for human IgG1. B) Quantification of human IgG1 vessel penetration from tissues collected two hours after single treatment with trastuzumab or T-DM1 (15mg/kg). C and D) Quantification of the vessel density (C) and vascular volume fraction (D), as assessed with optical frequency domain imaging (OFDI) from BT474-Gluc brain tumors treated with trastuzumab or T-DM1 at t = 0 (n = 4). Data are means ± SD. All statistical tests were two-sided. E) Western blots of the HER2 downstream pathway signaling was performed on BT474-Gluc tumors, collected 48 hours after single treatment with control IgG, trastuzumab, or T-DM1 (15mg/kg).
The Effect of T-DM1 on HER2 Signaling and Immune Cell Infiltration
BT474-Gluc BM were collected 48 hours after a single-dose of control IgG, trastuzumab, or T-DM1 (15mg/kg), and western blotting was performed for total and phosphorylated HER2, AKT, Erk1/2 and S6. The analysis revealed no difference in pathway inhibition by trastuzumab or T-DM1 (Figure 7E). In addition, we used FACS to compare the immune cell tumor infiltration. Despite the limitations of the immune-deficient mouse model, our comparison showed no statistical difference in the percentage of macrophages, B cells, or NK cells (CD45: trastuzumab: mean = 38, SD = 9.8; T-DM1: mean = 34, SD = 7.5, P = .48; F4/80: trastuzumab: mean = 21, SD = 5.6; T-DM1: mean = 17.7, SD =0.9, P = .91; CD11b+Gr1+: trastuzumab: mean = 5, SD = 1.8; T-DM1: mean = 4, SD = 1.4, P = .54; CD19: trastuzumab: mean = 0.6, SD = 0.2; T-DM1: mean = 0.9, SD = 1.3, P = .82; NK1.1: trastuzumab: mean = 0.2, SD = 0.1; T-DM1: mean = 0.1, SD = 0.08, P = .34) (Supplementary Figure 6, available online).
Discussion
Our results demonstrate a striking therapeutic benefit for T-DM1 in mice and provide a basis for clinical trials in patients with HER2-positive breast cancer BM. The efficacy of systemic therapies against CNS metastases is controversial. To our knowledge, we provide the first preclinical evidence that T-DM1 is effective against established BM from HER2-positive breast cancer. Our model of direct stereotactic injection of tumor cells into the brain parenchyma does not contain key steps of the metastatic process (21). However, the model is clinically relevant because it recapitulates clinical findings: Whereas primary tumors respond well to trastuzumab, BMs are resistant. Furthermore, it has the advantage of consistent and reproducible tumor growth, allowing for testing of treatments under controlled conditions. Nevertheless, we confirmed the efficacy of T-DM1 in an intracarotid tumor cell injection BM model.
A comparison of T-DM1 with trastuzumab at 1) equal doses and 2) doses equally efficacious against primary tumor growth revealed a superior ADC response in the brain microenvironment. Investigation of potential mechanisms of action of trastuzumab, such as reduction of HER2 downstream pathway signaling (22), revealed no differences between the two compounds. Furthermore, there was no difference in immune cell infiltration between the two groups. A role for the immune system, however, cannot be excluded and should be tested in immune-competent models. Despite a comparable tumor distribution for T-DM1 and trastuzumab, the ADC leads to a statistically significant increase in tumor cell apoptosis. Microscopy studies revealed enhanced abnormal mitotic figures and increased numbers of multinucleated cells after T-DM1 treatment. This phenotype is associated with DM1-induced mitotic catastrophe (23). Moreover, gene array analysis indicated an upregulation of genes related to mitotic catastrophe (20). Together, these results support the hypothesis that the efficacy of T-DM1 in BM is attributed to the cytotoxic agent DM1, which is known to induce apoptosis through the inhibition of microtubule polymerization and cell cycle disruption (15,24).
The response of HER2-positive BM to T-DM1 was independent of the cancer cell PIK3CA mutation status. The ADC improved survival in both HER2-driven and PI3K-driven BM, consistent with emerging clinical data. Baselga et al. investigated the relationship between treatment efficacy and PIK3CA mutation status in patients from the EMILIA trial (25). While the PIK3CA status affected the outcome in the capecitabine/lapatinib arm, the treatment benefit in the T-DM1 arm was not affected.
Previously, we demonstrated that trastuzumab can cause anti-angiogenic effects in HER2-overexpressing breast cancer leptomeningeal metastases (26). The crosstalk between HER2 and VEGF provided the rationale for effective therapies combining trastuzumab and anti-angiogenic drugs (19,27). Investigation of possible effects of T-DM1 on blood vessels of BM indicated a trend for decreased vascular fraction (day 14; trastuzumab: mean = 0.19, SD = 0.01; T-DM1: mean = 0.16, SD = 0.007, P = .02) and reduced vessel diameter (day 14: control IgG: mean = 42.56 μm, SD = 3.35; trastuzumab: mean = 37.57 μm, SD = 2.14; T-DM1: 35.78 μm, SD = 0.32) (Supplementary Figure 7, available online). Considering that the trastuzumab-mediated anti-angiogenic effects can be transient and counteracted by a compensatory increase in stromal VEGF (26), the combination of T-DM1 with anti-VEGF agents might be beneficial in treating breast cancer BM, a hypothesis that needs further investigation.
A correlation between BBB impairment and tumor size may contribute to increased delivery of drugs with high molecular weight at later stages of tumor development (28). Clinical findings on T-DM1 are consistent with this hypothesis: in one study, two-thirds of patients developed BM during T-DM1 treatment (29), suggesting a limited efficacy for BM prevention. Clinical data on established metastatic lesions, however, indicate that the ADC might be an effective therapeutic alternative. Case studies show a response to T-DM1 for treatment-naïve and heavily pretreated HER2-positive BM (30–32). Moreover, a subgroup analysis of the TH3RESA trial indicated a benefit for T-DM1 across patients with asymptomatic or treated BM (14). In addition, a retrospective exploratory analysis of the EMILIA trial in patients with treated, asymptomatic CNS metastases at baseline showed that T-DM1 was associated with improved overall survival compared with the capecitabine-lapatinib combination (33). However, progression-free survival was not statistically different between the two groups (33), revealing the necessity for further investigation. A prospective study of six patients with HER2-positive BM indicated clinical activity for T-DM1 (34). These limited clinical data underscore the potential translational implications of our preclinical studies.
In conclusion, we show here that T-DM1 is efficacious for the treatment of established BM from HER2-positive breast cancer in mice. These data provide a strong rationale for further investigation in prospective clinical trials.
Funding
This work was supported by the Department of Defense (DoD) Breast Cancer Research Innovator Award (W81XWH-10-1-0016 to RKJ), the National Cancer Institute at the National Institutes of Health (R01-CA126642 to RKJ, P01-CA080124 to RKJ and DF, R01-CA096915 to DF, and S10-RR027070 to DF, NCI/Federal Share Proton Beam Program Income to RKJ), the German Research Foundation (Deutsche Forschungsgemeinschaft DFG, AS 422-2/1 to VA), and the Fondation SolidarImmun (to JK).
Supplementary Material
The authors would like to thank Dr. Irene Kuter and Dr. Steven J. Isakoff for their critical comments and suggestions in the manuscript. We thank Sylvie Roberge, Julia Kahn, and Carolyn Smith for help with the mouse experiments.
References
- 1. Ramakrishna N, Temin S, Chandarlapaty S, et al. Recommendations on disease management for patients with advanced human epidermal growth factor receptor 2-positive breast cancer and brain metastases: American Society of Clinical Oncology clinical practice guideline. J Clin Oncol. 2014;32 (19):2100–2108. [DOI] [PMC free article] [PubMed] [Google Scholar]
- 2. Rades D, Kieckebusch S, Haatanen T, et al. Surgical resection followed by whole brain radiotherapy versus whole brain radiotherapy alone for single brain metastasis. Int J Radiat Oncol Biol Phys. 2008;70 (5):1319–1324. [DOI] [PubMed] [Google Scholar]
- 3. Eichler AF, Loeffler JS. Multidisciplinary management of brain metastases. Oncologist. 2007;12 (7):884–898. [DOI] [PubMed] [Google Scholar]
- 4. Chargari C, Campana F, Pierga JY, et al. Whole-brain radiation therapy in breast cancer patients with brain metastases. Nat Rev Clin Oncol. 2010;7 (11):632–640. [DOI] [PubMed] [Google Scholar]
- 5. Kocher M, Soffietti R, Abacioglu U, et al. Adjuvant whole-brain radiotherapy versus observation after radiosurgery or surgical resection of one to three cerebral metastases: results of the EORTC 22952–26001 study. J Clin Oncol. 2011;29 (2):134–141. [DOI] [PMC free article] [PubMed] [Google Scholar]
- 6. Eichler AF, Chung E, Kodack DP, et al. The biology of brain metastases-translation to new therapies. Nat Rev Clin Oncol. 2011;8 (6):344–356. [DOI] [PMC free article] [PubMed] [Google Scholar]
- 7. Kodack DP, Askoxylakis V, Ferraro GB, et al. Emerging strategies for treating brain metastases from breast cancer. Cancer Cell. 2015;27 (2):163–175. [DOI] [PMC free article] [PubMed] [Google Scholar]
- 8. Bendell JC, Domchek SM, Burstein HJ, et al. Central nervous system metastases in women who receive trastuzumab-based therapy for metastatic breast carcinoma. Cancer. 2003;97 (12):2972–2977. [DOI] [PubMed] [Google Scholar]
- 9. Lin NU, Carey LA, Liu MC, et al. Phase II trial of lapatinib for brain metastases in patients with human epidermal growth factor receptor 2-positive breast cancer. J Clin Oncol. 2008;26 (12):1993–1999. [DOI] [PMC free article] [PubMed] [Google Scholar]
- 10. Lin NU, Dieras V, Paul D, et al. Multicenter phase II study of lapatinib in patients with brain metastases from HER2-positive breast cancer. Clin Cancer Res. 2009;15 (4):1452–1459. [DOI] [PubMed] [Google Scholar]
- 11. Bachelot T, Romieu G, Campone M, et al. Lapatinib plus capecitabine in patients with previously untreated brain metastases from HER2-positive metastatic breast cancer (LANDSCAPE): a single-group phase 2 study. Lancet Oncol. 2013;14 (1):64–71. [DOI] [PubMed] [Google Scholar]
- 12. Verma S, Miles D, Gianni L, et al. Trastuzumab emtansine for HER2-positive advanced breast cancer. N Engl J Med. 2012;367 (19):1783–1791. [DOI] [PMC free article] [PubMed] [Google Scholar]
- 13. Welslau M, Dieras V, Sohn JH, et al. Patient-reported outcomes from EMILIA, a randomized phase 3 study of trastuzumab emtansine (T-DM1) versus capecitabine and lapatinib in human epidermal growth factor receptor 2-positive locally advanced or metastatic breast cancer. Cancer. 2014;120 (5):642–651. [DOI] [PubMed] [Google Scholar]
- 14. Krop IE, Kim SB, Gonzalez-Martin A, et al. Trastuzumab emtansine versus treatment of physician’s choice for pretreated HER2-positive advanced breast cancer (TH3RESA): a randomised, open-label, phase 3 trial. Lancet Oncol. 2014;15 (7):689–699. [DOI] [PubMed] [Google Scholar]
- 15. Junttila TT, Li G, Parsons K, et al. Trastuzumab-DM1 (T-DM1) retains all the mechanisms of action of trastuzumab and efficiently inhibits growth of lapatinib insensitive breast cancer. Breast Cancer Res Treat. 2011;128 (2):347–356. [DOI] [PubMed] [Google Scholar]
- 16. Lewis Phillips GD, Li G, Dugger DL, et al. Targeting HER2-positive breast cancer with trastuzumab-DM1, an antibody-cytotoxic drug conjugate. Cancer Res. 2008;68 (22):9280–9290. [DOI] [PubMed] [Google Scholar]
- 17. Deeken JF, Loscher W. The blood-brain barrier and cancer: transporters, treatment, and Trojan horses. Clin Cancer Res. 2007;13 (6):1663–1674. [DOI] [PubMed] [Google Scholar]
- 18. Tamura K, Kurihara H, Yonemori K, et al. 64Cu-DOTA-trastuzumab PET imaging in patients with HER2-positive breast cancer. J Nucl Med. 2013;54 (11):1869–1875. [DOI] [PubMed] [Google Scholar]
- 19. Kodack DP, Chung E, Yamashita H, et al. Combined targeting of HER2 and VEGFR2 for effective treatment of HER2-amplified breast cancer brain metastases. Proc Natl Acad Sci U S A. 2012;109 (45):E3119–3127. [DOI] [PMC free article] [PubMed] [Google Scholar]
- 20. Lindgren T, Stigbrand T, Johansson L, et al. Alterations in gene expression during radiation-induced mitotic catastrophe in HeLa Hep2 cells. Anticancer Res. 2014;34 (8):3875–3880. [PubMed] [Google Scholar]
- 21. Kienast Y, von Baumgarten L, Fuhrmann M, et al. Real-time imaging reveals the single steps of brain metastasis formation. Nat Med. 2010;16 (1):116–122. [DOI] [PubMed] [Google Scholar]
- 22. Hudis CA. Trastuzumab--mechanism of action and use in clinical practice. N Engl J Med. 2007;357 (1):39–51. [DOI] [PubMed] [Google Scholar]
- 23. Barok M, Tanner M, Köninki K, et al. Trastuzumab-DM1 causes tumour growth inhibition by mitotic catastrophe in trastuzumab-resistant breast cancer cells in vivo. Breast Cancer Res. 2011;13 (2):R46. [DOI] [PMC free article] [PubMed] [Google Scholar]
- 24. Poon KA, Flagella K, Beyer J, et al. Preclinical safety profile of trastuzumab emtansine (T-DM1): mechanism of action of its cytotoxic component retained with improved tolerability. Toxicol Appl Pharmacol. 2013;273 (2):298–313. [DOI] [PubMed] [Google Scholar]
- 25. Baselga J, Verma S, Ro J, et al. Relationship between tumor biomarkers (BM) and efficacy in EMILIA, a phase III study of trastuzumab emtansine (T-DM1) in HER2-positive metastatic breast cancer (MBC). Cancer Res. 2013;73 (8)(suppl 1):LB-63. [DOI] [PMC free article] [PubMed] [Google Scholar]
- 26. Izumi Y, Xu L, di Tomaso E, et al. Tumour biology: herceptin acts as an anti-angiogenic cocktail. Nature. 2002;416(6878):279–280. [DOI] [PubMed] [Google Scholar]
- 27. Falchook GS, Moulder SL, Wheler JJ, et al. Dual HER2 inhibition in combination with anti-VEGF treatment is active in heavily pretreated HER2-positive breast cancer. Ann Oncol. 2013;24 (12):3004–3011. [DOI] [PMC free article] [PubMed] [Google Scholar]
- 28. Murrell DH, Foster PJ, Chambers AF. Brain metastases from breast cancer: lessons from experimental magnetic resonance imaging studies and clinical implications. J Mol Med (Berl). 2014;92 (1):5–12. [DOI] [PubMed] [Google Scholar]
- 29. Olson EM, Lin NU, DiPiro PJ, et al. Responses to subsequent anti-HER2 therapy after treatment with trastuzumab-DM1 in women with HER2-positive metastatic breast cancer. Ann Oncol. 2012;23 (1):93–97. [DOI] [PMC free article] [PubMed] [Google Scholar]
- 30. Torres S, Maralani P, Verma S. Activity of T-DM1 in HER-2 positive central nervous system breast cancer metastases. BMJ Case Rep. 2014. [DOI] [PMC free article] [PubMed] [Google Scholar]
- 31. Bartsch R, Berghoff AS, Preusser M. Breast cancer brain metastases responding to primary systemic therapy with T-DM1. J Neurooncol. 2014;116 (1):205–206. [DOI] [PubMed] [Google Scholar]
- 32. Foglietta J, Metro G, Crino L, et al. Letter to the editor concerning “Trastuzumab emtansine (T-DM1) versus lapatinib plus capecitabine in patients with HER2-positive metastatic breast cancer and central nervous system metastases: a retrospective, exploratory analysis in EMILIA”. Ann Oncol. 2015;26 (5):1033–1034. [DOI] [PubMed] [Google Scholar]
- 33. Krop IE, Lin NU, Blackwell K, et al. Trastuzumab emtansine (T-DM1) versus lapatinib plus capecitabine in patients with HER2-positive metastatic breast cancer and central nervous system metastases: a retrospective exploratory analysis in EMILIA. Ann Oncol. 2015;26 (1):113–119. [DOI] [PMC free article] [PubMed] [Google Scholar]
- 34. Bartsch R, Berghoff AS, Rudas M, et al. T-DM1 in HER2-positive breast cancer brain metastases (BM). J Clin Oncol. 2014;32:5(Suppl; Abstr 650). [DOI] [PubMed] [Google Scholar]
Associated Data
This section collects any data citations, data availability statements, or supplementary materials included in this article.


