Abstract
In this note, we present a discussion of the advantages and scope of model-free analysis methods applied to the popular solvatochromic probe LAURDAN, which is widely used as an environmental probe to study dynamics and structure in membranes. In particular, we compare and contrast the generalized polarization approach with the spectral phasor approach. To illustrate our points we utilize several model membrane systems containing pure lipid phases and, in some cases, cholesterol or surfactants. We demonstrate that the spectral phasor method offers definitive advantages in the case of complex systems.
Keywords: LAURDAN, spectral phasor, generalized polarization, membrane biophysics, lung surfactant
Introduction
Usually, experimental results, such as fluorescence data, are examined and explained on the basis of different models. However, sometimes an appropriate model is difficult to construct. In the present letter, we present a discussion of the advantages and scope of model-free analysis methods applied to the popular solvatochromic probe LAURDAN, which is widely used as an environmental probe to study dynamics and structure in membranes [1, 2]. To understand the use of LAURDAN as a sensor in membranes we need to understand the photophysical processes involved. The generalized polarization (GP) function [3] most commonly used with LAURDAN is based on the classical mathematics of fluorescence polarization. Specifically, GP is defined as:
| (1) |
where IB and IR represent the emission intensities in the ‘blue’ and ‘red’ spectral regions, respectively (these regions are typically at 440 nm and 490 nm). GP measurements can be implemented in microscopes as well as cuvettes: In the case of microscope determinations one must include a G factor (as in polarization) to calibrate the efficiency in both channels to obtain the corrected GP value [4].
Recently, new model-free methods to study LAURDAN in membranes have appeared in both lifetime and steady-state domains [5–7]. These methods are based on the Fourier transformation of the lifetime decay function or the emission spectra of LAURDAN. These Fourier transformations allow one to determine, with a simple visual inspection, the presence of complex interactions in the LAURDAN/membrane system without the assumption of a particular model.
In 1981, Weber [8] introduced a Fourier transformation approach for dealing with multiple lifetime emission components. These algorithms allowed the calculation of N lifetime components in a heterogeneous fluorescence emission as the sum of independent terms in the Fourier space, calculating the real and imaginary part of the lifetime decay. In 1984, Jameson et al [9] introduced the concept and application of the phasor plot to study the heterogeneous emission of probes. These lifetime phasor plots were used for a number of in vitro (cuvette) measurements in protein and membrane systems by Stefl et al [5]. Digman et al [6] used the phasor plot representation to analyze FLIM data, introducing these methods to the imaging field. The spectral phasor approach was first introduced by Fereidouni et al [7], for the blind unmixing of up to three different probe emissions in the same sample with spectral resolved confocal microscopy. The emission spectrum of a sample, recorded on a spectrofluorimeter or in an image from a spectral confocal microscope, is used to calculate the real and imaginary components (the amplitude and phase, respectively) for the first harmonic Fourier transformed spectrum (X and Y, called G and S, respectively). The data are then plotted in a phasor scatter plot, termed the spectral phasor plot.
The spectral phasor is based on the Fourier transformation of the spectral information obtained from a cuvette or each pixel in a spectral image. The basic calculation is as follows:
| (2) |
| (3) |
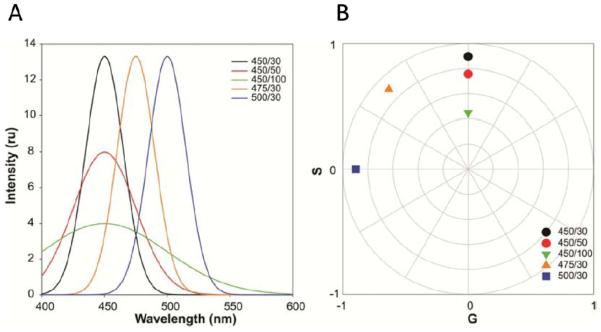
where I is the intensity at each step of the spectrum (each λ interval or bandwidth in an image spectral phasor), n is the number of the harmonic, and L is the length of the spectrum taken as the final minus the initial wavelengths, in our case 600–400 nm). The calculations of G (equation (2)) and S (equation (3)) are very simple; basically, the intensity at each wavelength is multiplied by the cosine or sine of the wavelength at each step multiplied by the harmonic number and 2π/L. After that, the sum of the individual steps is divided by the integral of the spectrum (sum of the intensities of the full spectrum). The G and S terms take values between l to −1 and the position on the spectral phasor plot is related to the center of mass of the spectrum and the width of the spectrum. The center of mass of the spectrum is associated with the angular position of the point on the spectral phasor plot while its axial position is inversely related to the spectral bandwidth. These principles are illustrated with simulations of spectral phasors shown in figure 1.
Figure 1.
Simulations illustrating spectral phasors for examples with different wavelength maxima and full width at the half maximum (FWHM). (a) Simulation of three spectra with increasing spectral maxima but the same FWHM (black, orange, and blue, respectively), or the same spectral maximum but increasing FWHM (black, red, and green, respectively). The first number in the legend represents the center of the spectrum and the second number is the FWHM (both are in nanometers). (b) First harmonic spectral phasor of the simulated spectra in the left plot. In that plot one observes that increasing the spectral center moves the position of the spectral phasor point in a counterclockwise direction (black, orange, and blue spectra). Increasing the FWHM moves the spectral phasor point towards the center of the plot (black, red, and green spectra).
The Fourier space, i.e. the spectral phasor plot, has the properties of sum, difference, etc, providing the opportunity to judge the contributions from the different species, and the interactions between them, in a straightforward manner.
In a recent paper, Golfetto et al [10] introduced the first utilization of the spectral phasor approach to study LAURDAN emission in membranes. That paper demonstrated the utility of the method to delineate aspects of membrane micro-heterogeneity and lipid domains with the association of the cholera toxin subunit B.
To emphasize the novelty of the spectral phasor approaches and to demonstrate the basic concept behind the methods, in this letter we offer a description of the strength of the method to study complex fluorescence emission in a simple and straightforward manner. We illustrate the spectral phasor method using two simple systems and we discuss the utility of this novel method for studies of solvatochromic probes in membranes; however, we emphasize that the main purpose of this technical letter is to present a pedagogical treatment as opposed to offering a detailed discussion of membrane properties.
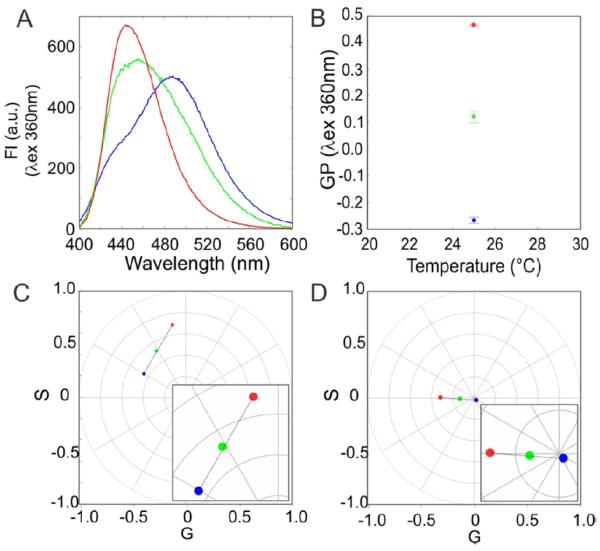
As the first example (figure 2), we provide a simple problem, i.e. a study of LAURDAN in gel (Lβ) and fluid (Lα)phases in a membrane. Figure 2(a) shows the spectra of LAURDAN in MLVs prepared with DOPC (blue), DPPC (red), and the 1/1 (mol %) DOPC:DPPC mixture (green). In the GP plot (figure 2(b), one notes that the gel membrane (red) has a high GP value while the fluid membrane (blue) has a low GP value, as expected. However, the DOPC : DPPC (green) mixture has an intermediate value of GP, which, as in the case of spectra alone, could imply that the membrane has a mixture of coexisting fluid and gel phases. But, this intermediate GP value could, theoretically, also be due to a homogeneous mixture of the lipids and a model based on the additive nature of the GP function, used to ‘quantify’ the extent of each phase, will not reflect this homogeneous mixture case [11]. In fact, these lipid mixtures were studied in detail by several groups [12–14] and the coexistence of gel and fluid phases was eventually established. When the same spectra used for the GP calculations are converted to the spectral phasor format, one can see, in both the first and second harmonics (figures 2(c) and (d)), a linear trajectory between the fluid and gel phases with the mixture half and half (DOPC : DPPC) at the middle. This data are then also consistent with a mixture of two coexisting lipid phases.
Figure 2.
Example of the identification of linear combination in the emission of LAURDAN in a binary mixture of fluid and gel membrane with spectral phasor. (a) Spectra recorded of the MLVs of DOPC (blue), DPPC (red) and a mixture 1:1 mol of DOPC:DPPC (green) at 25 °C. (b) Calculated GP values from the spectral intensity (GP = I440 − I490/I440 + I490). (c) Spectral phasor position of each sample in the first harmonic. (d) Spectral phasor position of each sample in the second harmonic. All the measurements were done in triplicate and each point represents the mean ± standard deviation (when standard deviations do not appear they are smaller than the symbol diameter).
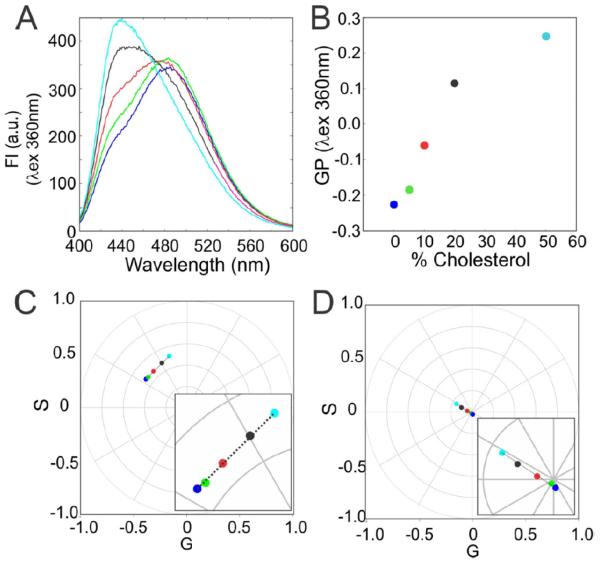
The second example to demonstrate the utility of the phasor plot is the effect of cholesterol on a 50 : 50 mixture of DOPC:DPPC. As previously shown, the vesicles with a 50 : 50 ratiometric mixture of DOPC:DPPC have a coexistence of membranes in the fluid or gel phases. The addition of cholesterol changes the system from Ld (from 0 to 15 % cholesterol) → Ld/Liquid order (Lo, from 15 to 45% cholesterol) → Lo (from 45 to 50% cholesterol). At this level of complexity it is hard to know how much of the LAURDAN emission comes from Ld or Lo states. This problem is simplified using image resolved GP analysis, comparing the histogram distribution of the Ld, Lβ, or Lo [4], but is essentially intractable using cuvettes. However, if the effect of cholesterol is an additive process and the change in the emission is the sum of simple components, all the spectral phasor points should fall on the straight line that join these limits. With the spectra (figure 3(a)) one observes the effect of the cholesterol as the increasing appearance of a shoulder at 490 nm that finally reaches the maximum emission wavelength at 50 mol% cholesterol. The GP (figure 3(b)) shows a non-linear relation with the addition of cholesterol to the mixture from 0 to 50 mol%. A model that accounts for this nonlinear GP data would be very complicated and, depending on the cholesterol concentration [11], would reguire at least three phases. From the first and second harmonic (figures 3(c) and (d)) one can identify a linear combination from 0 to 50 mol% of cholesterol. The reasons why the LAURDAN points are on the line between the limits designed for our experiment (DOPC: DPPC and DOPC: DPPC + 50% cholesterol) are related to the photophysics underlying the LAURDAN emission process. In principle, LAURDAN can re-orient a few molecules of water around its excited state dipole at the membrane interphase (for a detailed description read [4]). This means, in a situation where water is absent, LAURDAN will present the non-relaxed emission, while with the full complement of water molecules (around 4–5 water molecules) the LAURDAN emission will present as completely relaxed, i.e. at the other phasor limit. All the intermediate states (which mean 1, 2, and 3 water molecules) should be at the intermediate spectral phasor positions that join the limits (0 or 4–5 water molecules). In our opinion, the results presented in figure 3(c) indicate that the increase in the cholesterol results in a decrease in the number of water molecules around the LAURDAN from 0 to 50% cholesterol. These results are in line with the previous reports related to the effects of cholesterol [4], but a more detailed examination of this system is beyond the scope of this technical note.
Figure 3.
Example of the effects of the cholesterol in a membrane with coexisting fluid/gel phases studied using spectral phasors. (a) Spectra recorded of the MLVs of a mixture 1:1 mol of DOPC:DPPC with the addition of cholesterol (0%—green, 5%—blue, 10%—red, 20%—pink and 50%—cyan) at 35 °C. (b) Calculated GP values from the spectral intensity (GP = I440 − I490/I440 + I490). (c) Spectral phasor position of each sample in the first harmonic. (d) Spectral phasor position of each sample in the second harmonic. All the measurements were done in triplicate and each point represents the mean standard deviation (when standard deviations do not appear they are smaller than the symbol diameter).
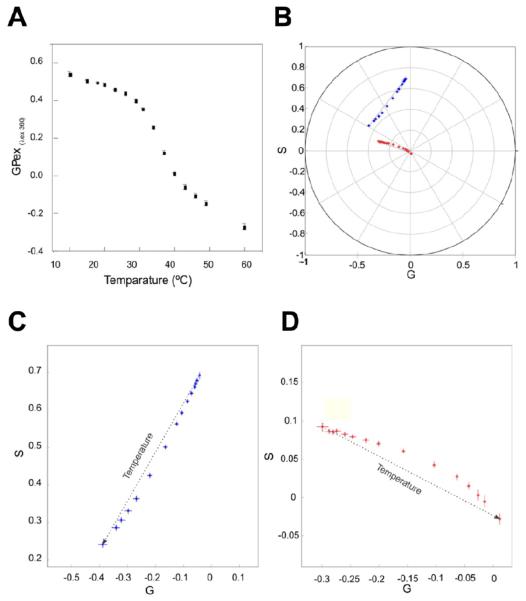
The pulmonary surfactant is a tensoactive mixture of lipids and protein located in the alveolus responsible for decreasing the surface tension at the end of expiration in order to avoid alveolar collapse during the respiratory cycle [16]. To achieve that function the pulmonary surfactant has a complex mixture of hundreds of lipids and four proteins (pulmonary surfactant proteins, called SP-A, -B, -C, and -D). The thermotropic behavior is controlled by the phospholipid composition and cholesterol content [17]. Figure 4 shows the GP analysis for the LAURDAN emission in a porcine pulmonary surfactant in response to a temperature increase. From the GP data alone, it is difficult to demonstrate that the system has more than two components. When the spectral phasor approach is applied (figures 4(b)–(d)), however, it is immediately evident that there is not a linear combination of two discrete states. Hence, one can reason that LAURDAN experiences at least three different environments during the melting transition in the native pulmonary surfactant (which have the polar and apolar components). The melting transition of the pulmonary surfactant is board [18] and it is difficult to account for the observed behavior, but it may be that the pulmonary surfactant can experience some fluctuation in the lamellar Lo to Ld transition with the occurrence of lamellar and non-lamellar structures [19] that result in a more complex environment for LAURDAN than is present in lamellar membranes alone, which in principle, as previously demonstrated in figure 3, always falls on the line that joins the relaxed and un-relaxed state. It may also be that LAURDAN can bind to the surfactant protein in the mixture, which would then give rise to a more complex emission. Needless to say, at the present time our understanding of this system is speculative and further studies are required for a detailed explanation of these results.
Figure 4.
Study of the thermotropic behavior of porcine native pulmonary surfactant with LAURDAN. (a) Excitation GP (excitation wavelength was 360 nm) for the thermotropic transition of pulmonary surfactant from 15 to 70 °C (each step was 5 °C). (b) First and second harmonic (blue and red, respectively) spectral phasor plot for the LAURDAN in the pulmonary surfactant during the thermotropic transition. (c), (d) Zoom of the first and second harmonics in plot B, the temperature increase is denoted by the arrow direction. All the measurements were done in triplicate and each point represents the mean ± standard deviation (when standard deviations do not appear they are smaller than the symbol diameter).
Conclusion
The spectral phasor approach for the study of the emission of environmentally sensitive probes such as LAURDAN in membrane systems is a rapid and reliable method to visualize and understand complex processes without the necessity of models. The application of the spectral phasor method to other systems in which emission spectra alter during a physico-chemical process, such as the emission of tryptophan in protein undergoing unfolding or conformational alterations, is another possible application of the method (protein unfolding and conformational change have been studied using lifetime phasors [20–23]). We note that the value of the traditional GP measurement is fully defined by one number (the ratio of two intensities) while the phasor, either lifetime or spectral, is defined by two numbers (G and S). Parasassi et al [24] introduced a variation of the GP method to include the excitation GP in addition to the emission GP so that data could be represented on two axes, allowing a more detailed description of the observed phenomena.
Acknowledgments
The authors would like to thank the Biochemistry and Proteomic Unit at the Institut Pasteur to allow us access to their facilities, in particular to Drs Carlos Batthyany and Rosario Duran. LM wassupported by a I + D-2012 grant from the Comisión Sectorial de Investigación Científica, Universidad de la Reptiblica-Uruguay. EG is supported by National Institutes of Health grant P41-GM103540 and P50-GM076516.
References
- [1].Bagatolli LA, Mely Y, Duportail G. Fluorescent Methods to Study Biological Membranes (Springer Series in Fluorescence) Vol. 13. Springer; Heidelberg: 2012. LAURDAN fluorescence properties in membranes: a journey from the fluorometer to the microscope; pp. 3–36. [Google Scholar]
- [2].Jameson DM. Introduction to Fluorescence. CRC Press; New York: 2014. [Google Scholar]
- [3].Parasassi T, De Stasio G, d’Ubaldo A, Gratton E. Phase fluctuation in phospholipid membranes revealed by Laurdan fluorescence. Biophys. J. 1990;57:1179–86. doi: 10.1016/S0006-3495(90)82637-0. [DOI] [PMC free article] [PubMed] [Google Scholar]
- [4].Parasassi T, Gratton E, Yu WM, Wilson P, Levi M. Two-photon fluorescence microscopy of laurdan generalized polarization domains in model and natural membranes. Biophys. J. 1997;72:2413–29. doi: 10.1016/S0006-3495(97)78887-8. [DOI] [PMC free article] [PubMed] [Google Scholar]
- [5].Štefl M, James NG, Rossj A, Jameson DM. Applications of phasors to in vitro time-resolved fluorescence measurements. Anal. Biochem. 2011;410:62–9. doi: 10.1016/j.ab.2010.11.010. [DOI] [PMC free article] [PubMed] [Google Scholar]
- [6].Digman MA, Caiolfa VR, Zamai M, Gratton E. The phasor approach to fluorescence lifetime imaging analysis. Biophys. J. 2008;94:LI4–6. doi: 10.1529/biophysj.107.120154. [DOI] [PMC free article] [PubMed] [Google Scholar]
- [7].Fereidouni F, Bader AN, Gerritsen HC. Spectral phasor analysis allows rapid and reliable unmixing of fluorescence microscopy spectral images. Opt. Express. 2012;20:12729. doi: 10.1364/OE.20.012729. [DOI] [PubMed] [Google Scholar]
- [8].Weber G. Resolution of the fluorescence life times in a heterogeneous system by phase and modulation measurements. J. Phys. Chem. 1981;85:949–53. [Google Scholar]
- [9].Jameson DM, Gratton E, Hall RD. The measurement and analysis of heterogeneous emissions by multifrequency phase and modulation fluorometry. Appl. Spectrosc. Rev. 1984:2055–106. doi: 10.1146/annurev.bb.13.060184.000541. [DOI] [PubMed] [Google Scholar]
- [10].Golfetto O, Hinde E, Gratton E. The Laurdan spectral phasor method to explore membrane micro-heterogeneity and lipid domains in live cells. In: Owen DM, editor. Methods in Membrane Lipids (Methods in Molecular Biology. Vol. 1232. Springer; New York: 2015. pp. 273–90. [DOI] [PubMed] [Google Scholar]
- [11].Parasassi T, Ravagnan G, Rusch RM, Gratton E. Modulation and dynamics of phase properties in phospholipid mixtures detected by Laurdan fluorescence. Photochem. Photobiol. 1993;57:403–10. doi: 10.1111/j.1751-1097.1993.tb02309.x. [DOI] [PubMed] [Google Scholar]
- [12].Li L, Cheng JX. Coexisting stripe- and patch-shaped domains in giant unilamellar vesicles. Biochemistry. 2006;45:11819–26. doi: 10.1021/bi060808h. [DOI] [PMC free article] [PubMed] [Google Scholar]
- [13].Bernchou U, Ipsen JH, Simonsen AC. Growth of solid domains in model membranes: quantitative image analysis reveals a strong correlation between domain shape and spatial position. J. Phys. Chem. 2009;113:7170–7. doi: 10.1021/jp809989t. [DOI] [PubMed] [Google Scholar]
- [14].Juhasz J, Davis JH, Sharom FJ. Fluorescent probe partitioning in GUVs of binary phospholipid mixtures: implications for interpreting phase behavior. Biochim. Biophys. Acta—Biomembr. 2012;1818:19–26. doi: 10.1016/j.bbamem.2011.09.006. [DOI] [PubMed] [Google Scholar]
- [15].Marsh D. Liquid-ordered phases induced by cholesterol: a compendium of binary phase diagrams. Biochim. Biophys. Acta. 2010;1798:688–99. doi: 10.1016/j.bbamem.2009.12.027. [DOI] [PubMed] [Google Scholar]
- [16].Pérez-Gil J. Structure of pulmonary surfactant membranes and films: the role of proteins and lipid-protein interactions. Biochim. Biophys. Acta. 2008;1778:1676–95. doi: 10.1016/j.bbamem.2008.05.003. [DOI] [PubMed] [Google Scholar]
- [17].Bernardino De La Serna J, Hansen S, Berzina Z, Simonsen AC, Hannibal-Bach HK, Knudsen J, Ejsing CS, Bagatolli LA. Compositional and structural characterization of monolayers and bilayers composed of native pulmonary surfactant from wild type mice. Biocl1im. Biophys. Acta—Biomembr. 2013;1828:2450–9. doi: 10.1016/j.bbamem.2013.07.008. [DOI] [PubMed] [Google Scholar]
- [18].Bernarclino de la Serna J, Perez-Gil J, Simonsen AC, Bagatolli LA. Cholesterol rules: direct observation of the coexistence of two fluid phases innative pulmonary surfactant membranes at physiological temperatures. J. Biol. Chem. 2004;279:40715–22. doi: 10.1074/jbc.M404648200. [DOI] [PubMed] [Google Scholar]
- [19].Cullis PR, De Kruijff B. Lipid polymorphism and the functional roles of lipids in biological membranes. Biochim. Biophys. Acta–Rev. Biomembr. 1979;559:399–420. doi: 10.1016/0304-4157(79)90012-1. [DOI] [PubMed] [Google Scholar]
- [20].James NG, Ross JA, Stefl M, Jameson DM. Applications of phasor plots to. Anal. Biochem. 2011;410:70–6. doi: 10.1016/j.ab.2010.11.011. [DOI] [PMC free article] [PubMed] [Google Scholar]
- [21].Lopes JLS, Araujo APU, Jameson DM. Investigation of the conformational flexibility of DGAT1 peptides using tryptophan fluorescence. Methods Appl. Fluoresc. 2015;3:025003. doi: 10.1088/2050-6120/3/2/025003. [DOI] [PubMed] [Google Scholar]
- [22].Bader AN, Visser NV, van Amerongen H, Visser AJWG. Phasor approaches simplify the analysis of tryptophan fluorescence data in protein denaturation studies. Methods Appl. Fluoresc. 2014;2:045001. doi: 10.1088/2050-6120/2/4/045001. [DOI] [PubMed] [Google Scholar]
- [23].Montecinos-Franjola F, James NG, Concha-Marambio L, Brunet JE, Lagos R, Monasterio O, Jameson DM. Single tryptophan mutants of FtsZ: nucleotide binding/exchange and conformational transitions. Biochim. Biophys. Acta. 2014;1844:1193–200. doi: 10.1016/j.bbapap.2014.03.012. [DOI] [PubMed] [Google Scholar]
- [24].Parasassi T, Giusti AM, Raimondi M, Gratton E. Abrupt modifications of phospholipid bilayer properties at critical cholesterol concentrations. Biophys. J. 1995;68:189S–902. doi: 10.1016/S0006-3495(95)80367-X. [DOI] [PMC free article] [PubMed] [Google Scholar]


