Abstract
Deep venous thrombosis (DVT), thrombosis of the inferior vena cava, and pulmonary embolism (PE) constitute a continuum that includes venous thromboembolic (VTE) disease. VTE is the third most common cardiovascular disorder that affects all races, ethnicities, gender, and ages. VTE predominantly affects the elderly population, exponentially increasing in incidence with increasing age. Venous thromboembolism is not only a singular event but a chronic disease and has been found to have a rate of recurrence approaching 40% among all patients after 10 years. Whether symptomatic or asymptomatic, once thromboembolism is suspected, objective methods are required for the accurate and confirmatory presence of a thrombus with imaging as the next step in the diagnostic algorithm. Imaging also allows for the determination of the extent of clot burden, clot propagation, occlusive versus nonocclusive thrombus, acute versus chronic thrombus, or in some cases thrombus recurrence versus thrombophlebitis. Vena caval filter placement is, in some instances, required to prevent a significant subsequent VTE event. Placement of these therapeutic devices paradoxically promotes thrombus formation, and other sequelae may arise from the placement of inferior vena cava filters. In this article, the authors provide an overview of available techniques for imaging the vena cava with or without a filter and discuss advantages and drawbacks for each.
Keywords: inferior vena cava, venography, imaging
Objectives: Upon completion of this article, the reader will be able to discuss the role of imaging of the IVC before and after filter placement, and identify relative strengths and weaknesses of each type of imaging modality.
Accreditation: This activity has been planned and implemented in accordance with the Essential Areas and Policies of the Accreditation Council for Continuing Medical Education (ACCME) through the joint providership of Tufts University School of Medicine (TUSM) and Thieme Medical Publishers, New York. TUSM is accredited by the ACCME to provide continuing medical education for physicians.
Credit: Tufts University School of Medicine designates this journal-based CME activity for a maximum of 1 AMA PRA Category 1 Credit™. Physicians should claim only the credit commensurate with the extent of their participation in the activity.
Deep venous thrombosis (DVT), thrombosis of the inferior vena cava, and pulmonary embolism (PE) constitute a continuum that includes venous thromboembolic (VTE) disease. VTE is the third most common cardiovascular disorder,1 and affects all races, ethnicities, gender, and ages. VTE predominantly affects the elderly population, exponentially increasing in incidence with increasing age.2 The increasing age of the population also means that VTE will continue to be a significant public health concern. The precise incidence of VTE is unknown, as there is no national surveillance mechanism, but several hospital- and community-based studies have estimated an annual incidence of 1 to 2 per 1,000 (300,000–600,000 cases in the United States).3
VTE is not only a singular event but a chronic disease, which has been found to have a rate of recurrence approaching 40% among all patients after 10 years of age. This is the case even when patients with active cancer and other risk factors are excluded.4 The various continuum of VTE may or may not be associated with symptoms, which may develop depending on several factors, including size of the thrombus, sufficiency of collateral vessel formation, and inflammation. Whether symptomatic or asymptomatic, once thromboembolism is suspected, objective methods are required for the accurate and confirmatory presence of a thrombus with imaging as the next step in the diagnostic algorithm. Imaging also allows for determination of the extent of clot burden, clot propagation, occlusive versus nonocclusive thrombus, acute versus chronic thrombus, or in some cases thrombus recurrence versus thrombophlebitis. The determination of the proximal extent of lower extremity thrombus also has prognostic implications for the incidence of PEs and postthrombotic syndrome, a frequent complication of DVT.5
The mainstay therapy for symptomatic VTE is anticoagulation. In circumstances where there are contraindications to or complications from anticoagulation therapy, then vena caval filter placement is an effective alternative therapy to prevent a significant subsequent PE. Placement of these devices paradoxically promotes thrombus formation.6 In this article, the authors provide an overview of available techniques for imaging the vena cava with or without a filter and discuss advantages and drawbacks for each.
Imaging of the Inferior Vena Cava and Venous System
Venous Ultrasonography
Venous ultrasonography is the first-line imaging tool to aid in the diagnosis or exclusion of an acute or chronic DVT. It is inexpensive, portable, noninvasive, and does not use ionizing radiation. It is also the primary imaging choice for suspected lower extremity thrombus (according to the American College of Radiology appropriateness criteria).7 There are several techniques that can be employed for venous ultrasonography: B-mode imaging only (compression sonography); color Doppler; and duplex sonography, which combines B-mode imaging with Doppler waveform analysis (Fig. 1). B-mode imaging with compression technique is usually performed in the femoropopliteal system, while interrogation of the smaller calf veins and deeper iliac veins is technically more challenging and may require duplex and color Doppler imaging.8 There is variability in the sensitivity and specificity for the detection of thrombi by different modes of venous ultrasonography. In a study by Vogel et al, sensitivity for thrombi detection using compression with B-mode imaging and color Doppler ranges from 91 to 94% in the proximal deep veins.9
Fig. 1.
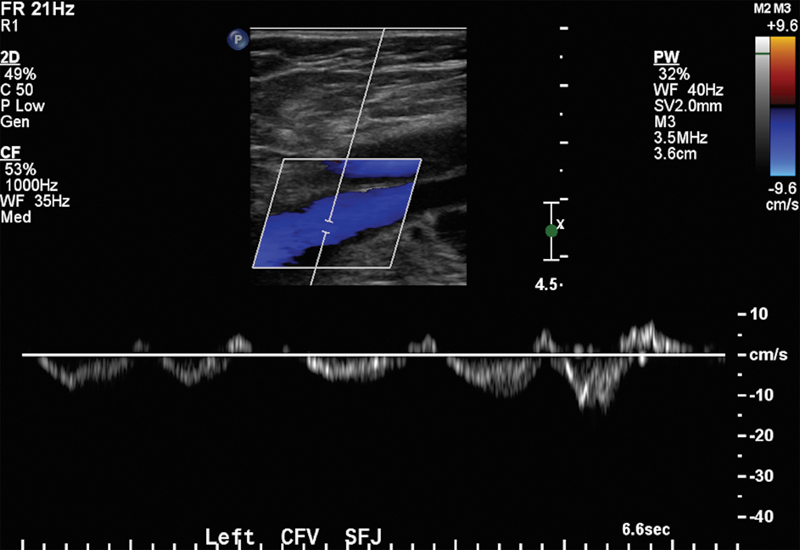
Ultrasound demonstrating normal color Doppler and phasic flow with the respiratory cycle on spectral waveform in the left common femoral vein.
One of the major limitations of venous ultrasonography is its operator dependency and its inability to directly visualize the iliac veins, inferior vena cava, and the superficial femoral vein in the adductor canal. Other limitations for the visualization of veins include the presence of edema, tenderness, obscuring overlying compression bandages, or if only tributary veins are involved.8 9 10 In addition, ultrasound can fail to visualize segments of the inferior vena cava (IVC) or the presence of any IVC anomalies.11 This can be challenging when there is suspicion for vena caval thrombosis or May-Thurner syndrome.
Despite vena caval thrombosis being uncommon in adults, its clinical significance is that it can have life-threatening consequences. The clinical presentation for this will vary according to the level of thrombus formation. Typically, acute thrombus is sonographically hypoechoic, and the vein is expanded with intraluminal thrombus12(Fig. 2). Indirect measures of venous obstruction can be detected with spectral Doppler imaging. The normal spectral waveform appearance of a patent IVC includes a continuous waveform that varies with respiration and becomes more pulsatile during emptying of the IVC into the right atrium. In the presence of an IVC thrombus/obstruction, the spectral waveform loses its normal phasic variation resulting in a monophasic waveform13 in both common femoral veins. Monophasic waveforms are a reliable indicator of venous obstruction central to the level of interrogation. A monophasic waveform can be seen with extrinsic compression, or intrinsic luminal narrowing either in the native vessel or a stent device (Fig. 3).
Fig. 2.
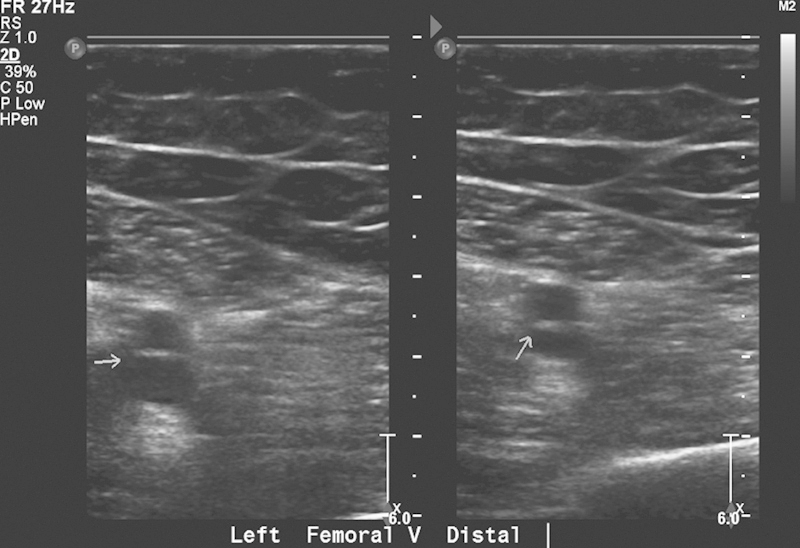
Gray-scale ultrasound demonstrates noncompressibility of the distal left femoral vein (arrow), consistent with acute thrombus.
Fig. 3.
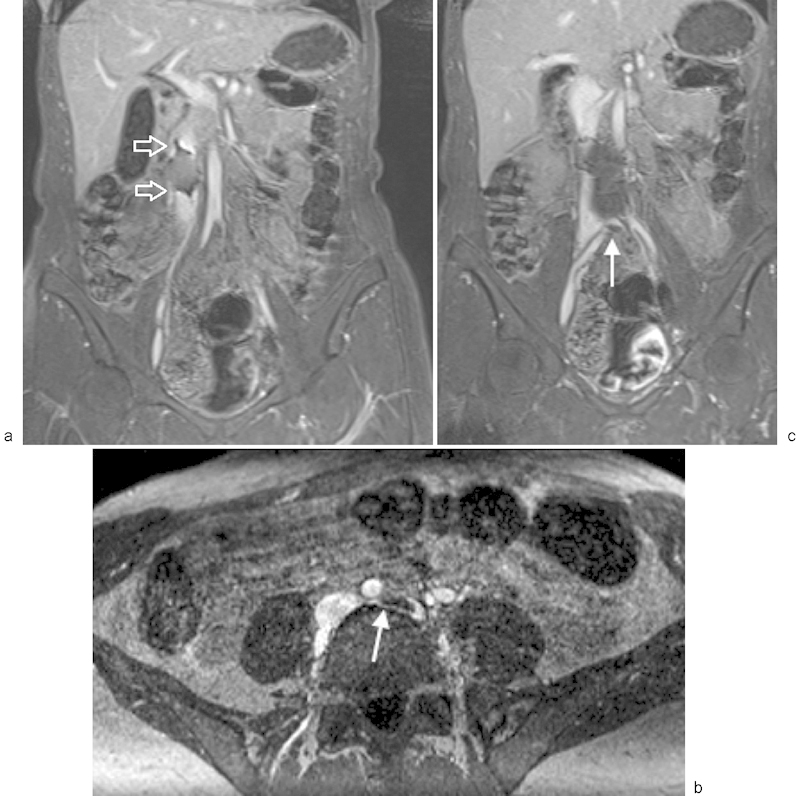
MR venography using a blood pool contrast agent in a patient with an IVC filter and May–Thurner syndrome. (a) Coronal post–contrast MR venogram demonstrating susceptibility artifact (arrows) from an Optease filter in the infrarenal inferior vena cava. (b) Axial post–contrast MR venography in the same patient showing compression of the left common iliac vein by the right common iliac artery and presence of thrombus in the proximal left common iliac vein (arrow). These findings are consistent with May–Thurner syndrome. (c) Coronal post–contrast MR venography in the same patient demonstrating the infrarenal IVC filter and thrombus in the proximal left common iliac vein (arrow).
A more specialized ultrasound technique, intravascular ultrasound (IVUS), has a niche role in IVC imaging and is an alternative or adjunct imaging technique to be used during endovascular procedures. IVUS is a portable and relatively inexpensive but invasive technique that can provide high-resolution trans-sectional images of the vessel structure. IVUS has several applications in arterial intervention and is most commonly used in endovascular aneurysm repair and within the venous system. It can also be used to guide IVC filter placement. IVUS can detect intraluminal thrombus, degree of stenosis, and structures extrinsic to the vein, with acute thrombus possibly being less well detected than chronic thrombus. However, in contrast to venography, IVUS may also detect fibrous bands, webs, or trabeculations in recanalized veins where such structures may not be well visualized.14 The portability of IVUS makes it attractive to nonradiologists, who investigated placement of IVC filters at the bedside and, in at least one study, found it to be safe and efficacious.15 Another study in the trauma literature compared IVUS to contrast venography, and found IVUS to be more accurate in localizing the renal veins as well as measuring the IVC diameter for preprocedural planning16 in real time and size selection of the filter. However, IVC anomalies (such as a duplicated IVC) are more difficult to detect with IVUS; as such, its role is more appropriate for adjunctive imaging to assist with filter placement.17 IVUS is efficacious for imaging the IVC in patients with either absolute or relative contraindications to contrast, and is best combined with a noncontrast imaging technique to exclude IVC anomalies. Incorporating IVUS can reduce the amount of contrast load during IVC procedures, which is highly advantageous in patients with renal dysfunction. Even with the benefits outlined here, IVUS is a rare adjunct to traditional ultrasound imaging of the abdomen or IVC intervention.
Computed Tomographic Venography
Multidector computed tomographic venography (CTV) is a fast, high spatial resolution technique that is valuable for visualizing and evaluating the anatomy and course of the deep venous system. CTV can accurately diagnose and assess the extent of thrombus, the presence and evaluation of any vascular anomalies,18 and assess for any extrinsic pathology that may be the cause of the underlying symptoms. One study reported a sensitivity of 80% and specificity of 97% for CTV compared with sonography.19 But there are several important drawbacks for CTV compared with lower extremity Doppler: these include radiation exposure and the use of intravenous iodinated contrast material with the direct CTV technique.
There are two methods for CTV: direct and indirect. The direct CTV preceded the development of indirect CTV. Direct CTV involves administration of dilute contrast material (usually a 50:50 contrast:saline mixture) in the dorsum of the foot with a tourniquet above the level of interest, and with the patient lying supine on the scanner with the leg raised.20 The central veins are visualized with direct CTV without the use of a tourniquet. The identical technique can be used for imaging other central veins such as upper extremity veins in patients with thoracic outlet syndrome (Fig. 4). Direct CTV technique is now infrequently used for imaging the inferior vena cava and lower extremity veins.
Fig. 4.
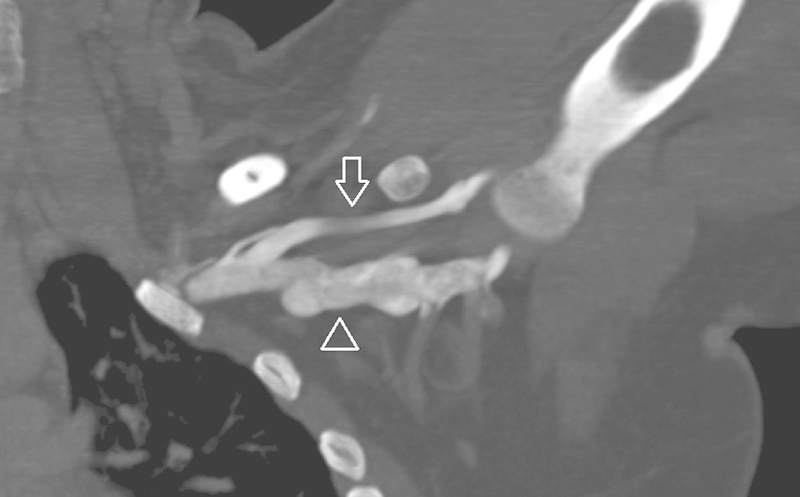
Direct CT venography. Coronal maximum intensity projection CT venography in abduction is used for thoracic outlet syndrome assessment. Dilute (50% saline mix) contrast is administered via a peripheral IV in the ipsilateral arm, same technique used in direct CT venography for the IVC or lower extremity veins (arrowhead—axillary vein; arrow—cephalic vein).
Indirect CTV was developed later and provides more anatomic detail of the deep venous system than using the direct CTV method. Indirect CTV evaluates the subdiaphragmatic to the lower extremity deep venous system immediately after a diagnostic CT exam (often a pulmonary CTA) that negates the need for additional contrast agent administration.21 22 23 Indirect CTV can also be performed as a standalone exam without necessarily acquiring a pulmonary CTA or imaging the aorta first. A major benefit of the indirect CTV method is that it can be integrated with other exams and does not require an additional dedicated contrast load. Other benefits of the indirect CTV method are that this combined approach can provide information on the disease burden and thereby alter the therapeutic management. The wider acquisition on the indirect CTV provides the availability of a road map to guide further intervention, including catheter thrombolysis or IVC filter placement, and even used for preoperative navigation in varicose vein surgery.24
The degree of venous enhancement on CTV is important in allowing the confident diagnosis and detection of DVT. This is related to the difference in attenuation between clot and the contrast-enhanced vein, which needs to be great enough to provide a confident diagnosis. Several factors influence this difference in attenuation: time to peak enhancement, iodine concentration of the contrast agent, volume of injected contrast, body weight, and age of the patient.25 It is unclear why an older patient would be associated with better contrast enhancement. One study hypothesized that it may be related to changes in the cardiopulmonary circulation with aging.25
As scanning technology allows, due to the k-edge of iodine, the use of a lower kilovolt peak (kVp) acquisition generates far greater contrast between iodinated contrast material-enhanced blood and filling defects. Nakaura et al specifically studied this phenomenon where they assessed the impact of using low kVp, high-current tube technique on imaging quality at indirect CTV. Their cohort compared patients who had multidetector computed tomography (MDCT) scanned at 120 kVP with patients who had a second scan at 80 kVp. They found that using a reduced radiation dose at 80 kVp and a high tube current setting (426 mA on a 64-slice MDCT) significantly improved image quality compared with using at 120 kVp and 170 mA.26
These factors are all related to image quality, and a difference can be seen between direct and indirect CTV techniques. Both techniques have advantages and disadvantages. Some of direct CTV's limiting technical factors compared with indirect CTV include20 establishing adequate lower extremity intravenous access (a similar issue with venography), and uniform opacification of capacious deep venous system.
In the authors' experience, indirect CTV provides inconsistent image quality due to variability in timing of recirculation of contrast into the venous system. Such recirculation time is highly variable in the presence of significant arterial occlusive disease of the lower extremities, aortic aneurysms, and in the presence of occlusive DVT. Paradoxically, patients with significant arterial occlusive disease can have arteriovenous shunting, shortening the time for recirculation in the affected limb. This variability in recirculation time can lead to poor opacification of the deep veins, producing images where the density of the vein is similar to nonclotted blood. Despite these factors, indirect CTV probably uses less contrast than conventional venography18 (Fig. 5).
Fig. 5.
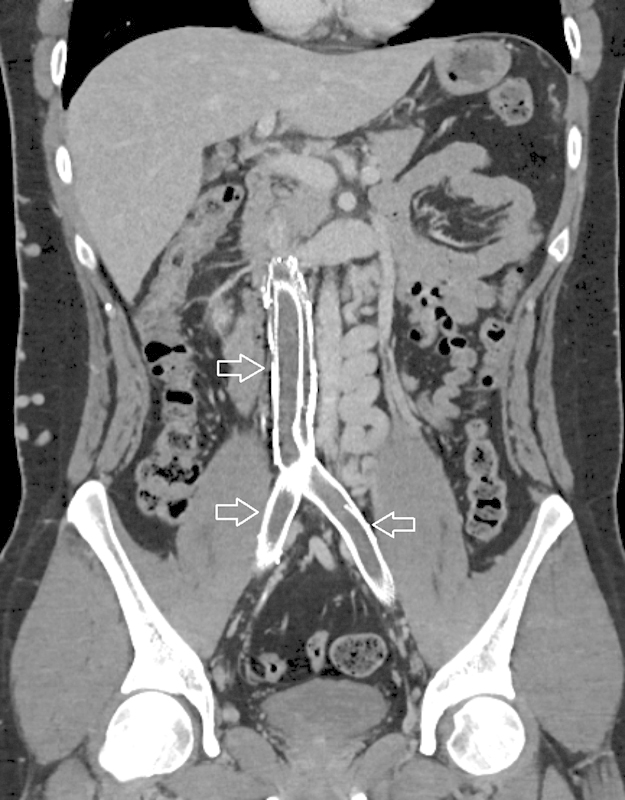
Indirect CT venography. Coronal reformat of indirect CT venogram demonstrating stented inferior vena cava with occlusive thrombus (arrows).
Magnetic Resonance Venography Techniques for Imaging the IVC
Magnetic resonance venography (MRV) is an attractive modality for imaging DVT, and based on availability may replace CTV as a primary diagnostic modality for IVC thrombosis and for posttherapy follow-up imaging. MRV can broadly be divided into two techniques (noncontrast or contrast enhanced) which are used to assess for venous pathology and anatomical variants. Similar to CTV, MRV can give information regarding vein lumen size, assess the overall extent of thrombus, determine central or peripheral VTE, and determine any possible extrinsic causes. The ability of MRV to image central veins with a high degree of accuracy without operator dependence is a significant advantage over ultrasonography. The lack of ionizing radiation and contrast when using the noncontrast technique offers a substantial advantage over CTV. Contrast-enhanced MRV is the workhorse of MRV, with noncontrast MRV techniques typically used when administration of gadolinium-based contrast is contraindicated. Renewed interest in noncontrast MRV techniques have been led by the emergence of nephrogenic systemic fibrosis (NSF), and more recent development in MR contrast retention will be discussed in the next section.
Contrast-Enhanced Magnetic Resonance Venography
The majority of available MRI contrast agents are gadolinium based. Gadolinium is a rare earth metal with paramagnetic properties. Currently, there are nine commercially available gadolinium-based contrast agents (GBCAs) approved by the Federal Drug Administration (FDA); they are classified according to their protein binding, ionicity, chemical configuration, and chemical structure. The configuration of the molecular structure is either linear or macrocyclic. Charges on their chemical structures influence their classification as either ionic or nonionic. Both ionicity and molecular structure influence the binding of gadolinium and its chemical stability. The least stable group belongs to the nonionic linear chelates: Gadodiamide and Gadoversetamide. These agents have higher rates of dissociation (Table 1).27
Table 1. Commercially available gadolinium agents in the United States and their pharmacological properties.
| Generic name | Trade name | Molecular structure | Chemical structure | Type |
|---|---|---|---|---|
| Gadodiamide | Omniscan | Linear | Nonionic | Extracellular |
| Gadoversetamide | Optimark | Linear | Nonionic | Extracellular |
| Gadopentetate dimeglumine | Magnevist | Linear | Ionic | Extracellular |
| Gadobenate dimeglumine | Multihance | Linear | Ionic | Extracellular |
| Gadoxetate disodium | Eovist/Primovist | Linear | Ionic | Extracellular and hepatocyte-specific properties |
| Gadofosveset trisodium | Ablavar | Linear | Ionic | Blood pool |
| Gadoterate meglumine | Dotarem | Macrocyclic | Ionic | Extracellular |
| Gadobutrol | Gadavist/Gadovist | Macrocyclic | Nonionic | Extracellular |
| Gadoteridol | Prohance | Macrocyclic | Nonionic | Extracellular |
Transmetallation, the displacement of the gadolinium ion from its chemical structure by other metals, will lead to release of free gadolinium. Free gadolinium is toxic to the body; contrast manufacturers chelate the gadolinium to improve the safety profile of administration. GBCAs are largely eliminated via the kidneys and, in patients with normal renal function, have a biological half-life of 1.5 hours; it is fully excreted by 24 hours.28 In patients with impaired renal function, elimination can take 30 hours or more.27 There are also several agents that are eliminated via the hepatic route. Even in patients with normal renal function, if gadolinium chelate remains in the body for an extended period of time, there is an increased likelihood of free gadolinium being released.
In the late 1990s and early 2000s, there were reports that NSF, a rare disease of unclear etiology, was emerging in patients exposed to GBCA with acute and chronic renal insufficiency. This was the first indication that GBCAs were associated with NSF, a potentially lethal multisystem fibrosing disease that had no effective treatment.29 30 31 In susceptible individuals with acute or chronic renal insufficiency, administration of GBCA can lead to an inflammatory reaction that eventually results in fibrotic changes in the skin, viscera, and lungs.32 More recently, several authors have reported unbound gadolinium ions deposited and retained in brain tissue and bones. In the initial report by Kanda et al, an imaging-based study showed increased nonenhanced T1-weighted signal in the dentate nucleus and globus pallidus in individuals with prior exposure to gadolinium.33 These findings were observed with the use of linear gadolinium complexes,34 and other authors found evidence that macrocyclic gadolinium complexes did not cause an increase in signal intensity on the unenhanced T1-weighted sequence.35 An autopsy-based study by Kanda et al confirmed accumulation of GBCAs in the brain of subjects without severe renal dysfunction,36 with higher concentrations detected in dentate nucleus and globus pallidus. These findings have led to further interest in noncontrast MR venography techniques, more stable macrocyclic gadolinium contrast media, and non–gadolinium-based MRI contrast agents.
Ferumoxytol (Fereheme, Amag pharmaceuticals, Waltham, MA), a superparamagnetic iron oxide agent used as iron replacement therapy in anemic patients with chronic renal insufficiency, has been investigated as a nongadolinium contrast agent. Ferumoxytol behaves initially as a blood pool contrast agent, for several hours distributing only within the intravascular compartment. These characteristics are highly suitable for use as a contrast agent for steady-state imaging, and enable a high signal-to-noise ratio (SNR) for vascular imaging with T1-weighted pulse sequences. Its half-life in the blood pool also allows imaging sequences of longer duration with superior spatial resolution to visualize smaller vessels,37 with the use of respiratory gating in the abdomen, or without respiratory gating in the pelvis and lower extremities (Fig. 6). However, the use of Ferumoxytol for imaging is off-label, and in March 2015, the FDA issued a black box warning that Ferumoxytol can potentially cause fatal allergic reactions.38
Fig. 6.
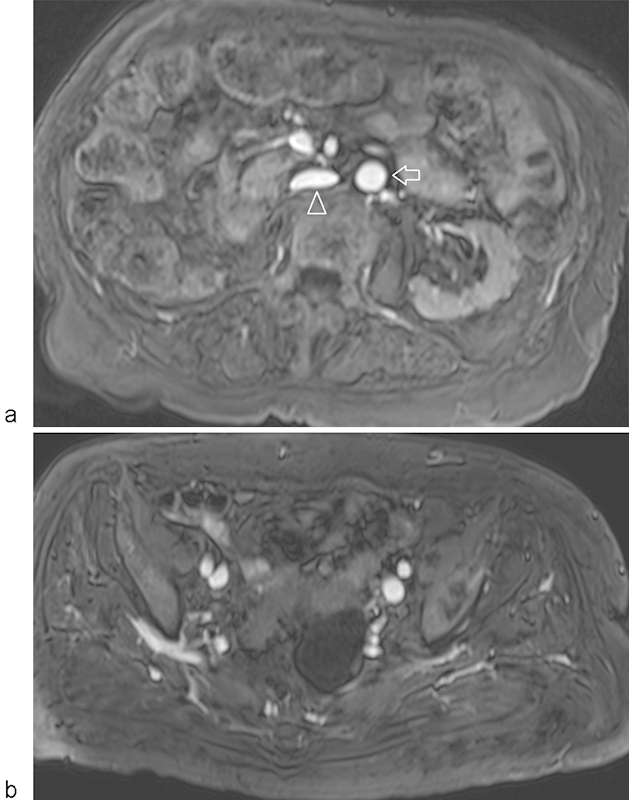
MR venography using ferumoxytol. Axial T1-weighted, fat-suppressed images through the (a) infrarenal IVC and (b) pelvic veins demonstrate wide patency of the venous system using a non–gadolinium-based contrast agent imaged in the steady state. Note the bright signal in both arteries and veins at both of these levels (arrow—aorta; arrowhead—inferior vena cava). (Figure courtesy of Dr. Mustafa Bashir, MD, Duke University Medical Center, Durham, NC.)
Another alternative to traditional extravascular gadolinium agents is gadofosveset trisodium, which has yet to be implicated in NSF. Gadofosveset trisodium is a blood pool contrast agent that reversibly binds to human serum albumin, and the agent has a high relaxivity. These characteristics dramatically improve options for venous imaging with MR. This allows evaluation of the arterial and venous vasculature in the steady state without the dependency on careful bolus timing required on first pass arterial imaging.39
Contrast-enhanced 3D MRA (CE-MRA) is an accepted reference standard in the diagnostic assessment of the vasculature. Mask subtraction of enhanced and unenhanced 3D CE-MRA data with segmentation of the venous vasculature allows for the generation of maximum intensity projection images, simplifying assessment of the venous system without soft-tissue superimposition. The technique can be employed in the evaluation of postthrombotic changes, congenital venous anomalies,40 and improved depiction of large-, medium-, and small-sized vessels. Time-resolved MR angiography is able to separate arterial and venous phases of enhancement, dynamically depict venous flow, and improve the assessment of collateral flow pathways.
A study by Laissy et al compared MR venography with color Doppler and reported that MRV was more accurate with a 100% sensitivity and specificity in the diagnosis of femoral, iliac, and inferior vena cava DVT.41 Importantly, when the authors compared MRV with color Doppler, MRV was more accurate. Studies using contrast-enhanced MRV with blood pool contrast agents have been highly accurate in the diagnosis of abdominopelvic and lower extremity DVT.42 43 44 The use of blood pool contrast agents simplifies the examination for MR technologists; these agents can be administered in the holding area prior to imaging, with all imaging performed in the steady state of enhancement.
Non–Contrast-Enhanced MRV
Investigators have found noncontrast MRV to be accurate in the diagnosis of abdominopelvic and lower extremity DVT.45 The ideal features of a noncontrast MRA/MRV technique are fast; easy to use; and insensitive to motion, heart rate, and flow patterns.
There are numerous noncontrast techniques available. Although a comprehensive discussion is outside the scope of this article, we will address several techniques that have shown particular promise for venous imaging in the abdomen, pelvis, and lower extremities. Rather than being considered mutually exclusive, combining these techniques often increases diagnostic confidence; several pitfalls are important to consider as well.
Balanced steady-state free precession (bSSFP) is a family of gradient-based echo sequences, which produce bright blood flow–independent vascular signal. bSSFP imaging is predominantly employed to produce cine images of the heart, taking advantage of the inherently high contrast between blood and myocardium46 yielding excellent delineation of the myocardial—blood pool contour. bSSFP has high SNR that can be exploited in vascular imaging,47 where arterial and venous structures will produce bright signal, thereby making it an excellent candidate for noncontrast MRV. 2D single-shot applications can be performed with time-efficient coverage of the entire volume of interest during normal breathing. The acquisition can be respiratory navigator gated to acquire data at the same point of the respiratory cycle (often end expiration). 3D applications are often coupled with a respiratory navigator for abdominal venous imaging; an inversion pulse can be applied to reduce signal from perivascular fat. The strength of 2D and 3D bSSFPs is that they yield high SNR with a short scan time. MRV utilizing bSSFP has been investigated and found to have concordant findings with ultrasound results in cases of acute thrombi.48 3D acquisitions can be coupled with saturation slabs and specified inflow times to maximize venous signal in a particular region of interest. An appropriate inflow time is chosen to optimize either arterial or venous signal. Major vendors offer this sequence under a wide variety of trade names (see Table 2). The technique has been used for peripheral arterial assessment, but can also be optimized for venous imaging (Figs. 7 and 8).
Table 2. Vendor's noncontrast MR venography.
| Sequence | Vendors | Technique |
|---|---|---|
| QISS | Siemens | 2D-ECG gated, fat-suppressed, single-shot balanced steady-state free precession |
| bSSFP | Siemens: Native TrueFisp GE: Inhance inflow inversion recovery (IFIR) Philips: B-TRANCE Toshiba: time-spatial labeling inversion pulse (time-SLIP) |
Gradient-based sequence Steady-state free precession |
| 3D SPACE STIR | Siemens: SPACE (Sampling Perfection with Application optimized Contrasts using different flip angle Evolution) GE: CUBE Philips: VISTA (Volume Isotropic Turbo spin echo Acquisition Toshiba: 3D MVOX (MultiVOXel) |
3D Turbo Spin Echo |
Abbreviations: 2D, two-dimensional; 3D, three-dimensional; ECG, electrocardiogram.
Fig. 7.
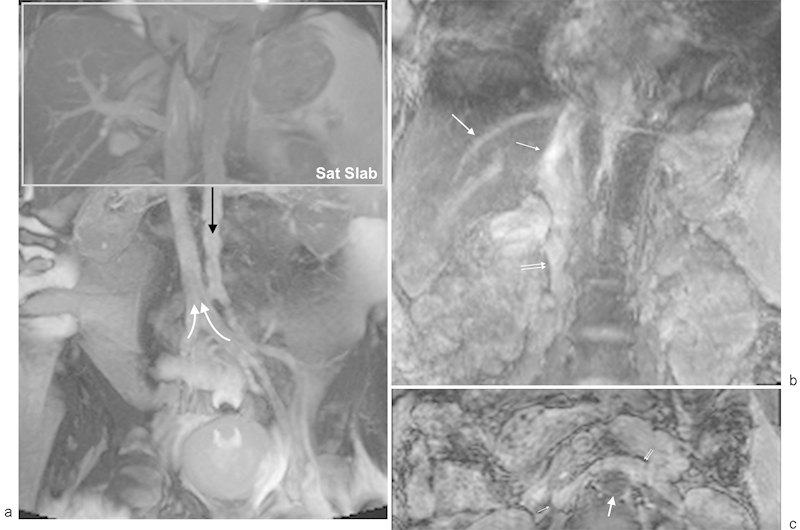
Balanced steady-state free precession MR venography: (a) coronal, noncontrast, single-shot, two-dimensional, free breathing balanced steady-state free precession (bSSFP) MR venography demonstrates good contrast between the soft tissues and the IVC. For illustration purposes, a gray saturation slab has been depicted along the superior border of the image to saturate arterial inflow (black arrow) as would be specified for inflow-prepared bSSFP venography. The saturation slab also reduces signal from stationary tissues improving the contrast for IVC visualization by specifying a time to allow venous inflow (white arrows). (b) Coronal inflow-prepared bSSFP MR venography. The suprarenal (thin arrow) and infrarenal (double arrow) IVC is well depicted. The hepatic veins are well seen with this technique (medium arrow). (c) Axial inflow-prepared bSSFP MR venography. The abdominal aorta signal is suppressed (thick arrow) with excellent contrast between the IVC (thin arrow) and left renal vein (double arrow) and surrounding soft tissues.
Fig. 8.
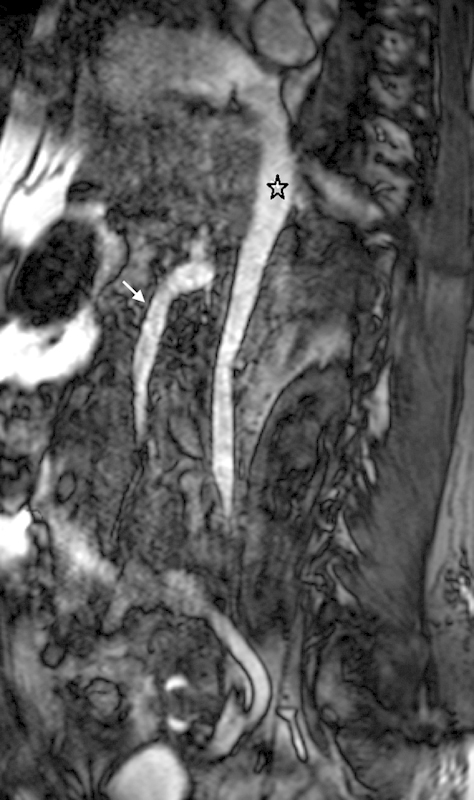
Noncontrast MR venography using three-dimensional balanced steady-state free precession (bSSFP). Multiplanar reformatted image through the inferior vena cava using three-dimensional respiratory-gated bSSFP demonstrates a widely patent inferior vena cava (asterisk). The superior mesenteric vein and portal confluence are also depicted (arrow).
Quiescent-interval single shot (QISS) MR angiography is a noncontrast technique that provides a robust depiction of abdominal and lower extremity peripheral arterial anatomy and peripheral vascular disease in less than 10 minutes.49 The pulse sequence is based on a bSSFP acquisition, with the addition of a nonselective saturation pulse, a dedicated fat-suppression pulse, and a tracking vascular saturation pulse applied either toward the head or foot to reduce signal from the arteries or veins, respectively. The tracking saturation pulse can be turned off in the case of varices or unknown vascular flow directionality. Data acquisition is performed in diastole, as such the technique requires a regular heart rhythm.50 Studies have also demonstrated that QISS has a good diagnostic performance in patients with substantial peripheral vascular disease,51 52 and if required the central vascular structures including veins can be imaged. The advantage of QISS compared with other noncontrast MR techniques is that the technique requires only minor modifications in the presence of tachycardia; otherwise it is performed without patient-specific modifications. Unpublished experience at the authors' institution demonstrates the utility of QISS MR angiography in assessing the veins of the abdomen, pelvis, and lower extremities (Fig. 9).
Fig. 9.
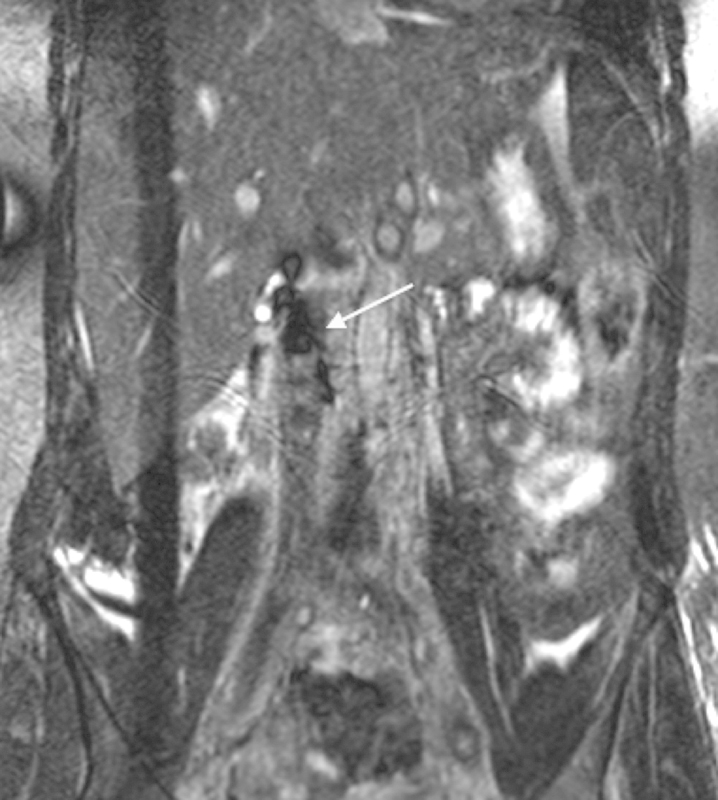
Quiescent interval single-shot MR venography. Susceptibility artifact is present from an IVC filter (arrow). Occlusive thrombus can be seen extending caudally from the IVC filter.
3D turbo spin echo or Fast spin echo techniques have been modified for isotropic imaging. One example is 3D-sampling perfection with application of optimized contrast agents using different flip angle evolution [(SPACE)-STIR], which uses nonselective, short-refocusing radiofrequency pulse train with variable flip angles. This allows for very high turbo factors and fast isotropic imaging which has many applications throughout the body and central nervous system.53 The feasibility for atherosclerotic plaque burden has been assessed utilizing the 3D SPACE technique applied to bSSFP pulse sequences, and has been found to have great potential.54 Applications in the abdomen are best performed with respiratory gating and enable a large field of view coverage with excellent conspicuity of the vasculature. A downside of this technique is that both the arteries and veins are visualized; spin dephasing can therefore be seen in high-flow arteries and venous shunts.
Phase contrast imaging is an ancillary MRV technique that employs a gradient echo sequence with bidirectional gradient pulses applied at the same strength and duration. Phase shifts are induced by protons moving in a spatially varying magnetic field, and are directly proportional to the proton velocity in the direction of the gradient. A phase image can be processed on a dedicated workstation, with flow directionality encoded as black/white linked with negative and positive phase shifts to 180 degrees. The relationship between the color coding and flow is operator dependent; one must identify flow directionality in another structure for orientation.55 This technique is often performed as a 2D acquisition used to demonstrate flow directionality or to confirm the absence of flow in a vessel of interest.
Catheter Venography
Catheter venography remains the gold standard in the diagnosis of IVC thrombosis assessment and pre–filter placement, with the advantage of demonstrating a route of access for the immediate treatment of DVT. Potential disadvantages to catheter venography include difficulty in obtaining venous access, pain/discomfort from the procedure, and an inability to delineate the caudal extent of the occlusion due to preferential flow into collaterals.56 Another potential disadvantage includes a relatively fixed location for the procedure (the interventional suite). However, there have been a few small studies to determine the safety and accuracy of bedside carbon dioxide cavography for IVC filter insertion in the intensive care unit.57 58 In both of these studies, carbon dioxide was recommended due to its renal safety profile. Carbon dioxide digital subtraction angiography is a safe alternative agent used for diagnostic and therapeutic endovascular procedures in patients with renal failure, and is particularly useful in critically ill patients and in patients with a severe contrast allergy.59 Other contrast agents available for catheter venography are iodinated contrast and gadolinium. As mentioned previously, these contrast agents are contraindicated in patients with poor renal function.
IVC Filter Placement
As recommended in quality improvement guidelines by specialty societies including the American College of Radiology, the IVC needs to be assessed prior to filter placement.60 There are various invasive and noninvasive options available for pre–filter placement assessment. The preprocedural information can typically be gleaned from cross-sectional noninvasive imaging methods. Information needed prior to filter placement includes the following:
Length and diameter of the IVC, particularly the infrarenal segment
Location and number of renal veins
IVC anomalies
IVC thrombus
Typically, either contrast-enhanced CT or MRI can be utilized, with the availability of noncontrast MRV techniques in patients with severe renal dysfunction. The infrarenal IVC is the typical location for filter placement, but there are instances when suprarenal placement should be considered, including IVC thrombus, extrinsic IVC compression, circumaortic renal vein (Figs. 9b and 10a), pregnancy or other pelvic masses, renal or gonadal vein thrombosis, chronic occlusion or intrinsic narrowing of the IVC, and a duplicated IVC.61 These findings can be ascertained by the various cross-sectional imaging methods with cavogram reserved for therapeutic intervention.
Fig. 10.
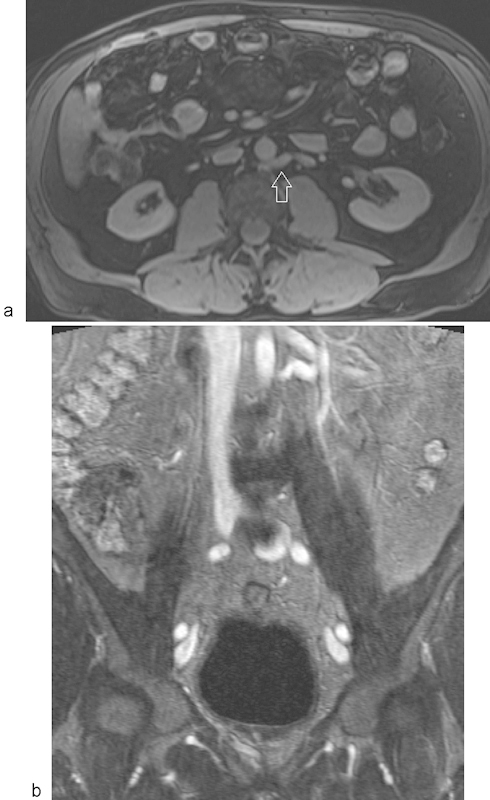
MR venography using gadofosveset trisodium demonstrating a circumaortic left renal vein. Axial (a) and coronal (b) multiplanar reformatted images from an MR venogram acquired in the steady state of contrast opacification depict a circumaortic left renal vein (arrow).
Complications and Imaging
Despite advances in interventional techniques, equipment, and filter technology, complications with the use of IVC filters can still occur. In general, complications fall into three broad categories: (1) procedural complications, (2) complications related to the filter, and (3) complications of filter retrieval.62
Procedural complications include minor postprocedural bleeding with formation of a hematoma at the site of interventional entry point and access-site thrombosis. Other potential procedural complications are related to the delivery system and include sheath kinking and more seriously air embolism. Complications related to the filter include malpositioning, migration, tilting, and failure of or incomplete deployment. High-quality imaging of the IVC including delineating possible anatomical variants is the key to preprocedural planning, with accurate sizing of the vein and choosing the most appropriate site for filter deployment to reduce the risk of some of these complications such as filter migration or tilting.
Vena cava penetration can occur into adjacent organs including the small bowel (Fig. 11a, b), vertebral body (Fig. 12), aorta, or renal collecting system, potentially leading to fistula formation. The filter itself can fracture and embolize, which is a very serious complication that could lead to sudden death.63 Another serious complication related to the filter is venous thrombosis. The thrombus burden is variable, ranging from a small clot trapped below the filter to extensive clot extending into the lower extremities (Fig. 13). Most seriously, thrombus can extend cranially beyond the confines of the filter structure (Fig. 14). If there is a suspicion of filter thrombosis, the advantages of MRV over CT is that there may be poor mixing and opacification on CT, limiting the diagnostic confidence. Such mixing is not problematic with MRV with late-phase imaging, or with the use of a blood pool contrast agent with imaging in the steady state.
Fig. 11.
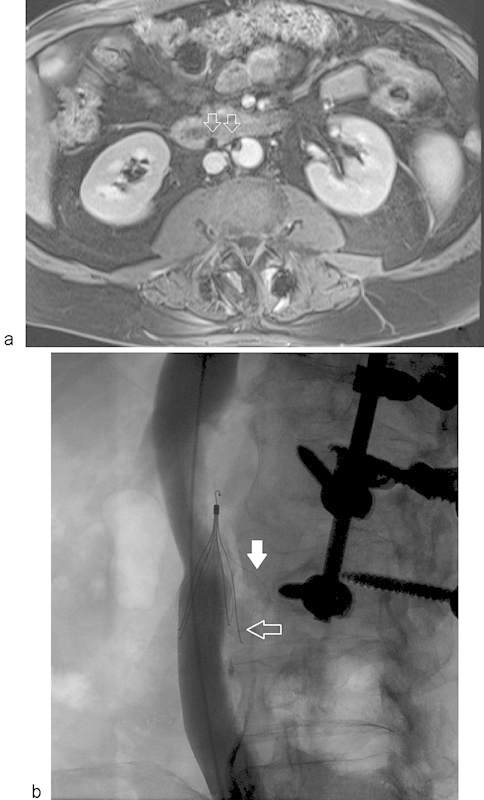
IVC filter strut penetration (a) Axial MR venogram through lower aspect of the infrarenal IVC filter demonstrating susceptibility artifact from the filter struts (arrows) which have penetrated the IVC and are abutting the adjacent duodenum and aorta. (b) IV cavogram showing strut penetration (arrows) with one of the limbs adjacent to the vertebral body (solid arrow).
Fig. 12.
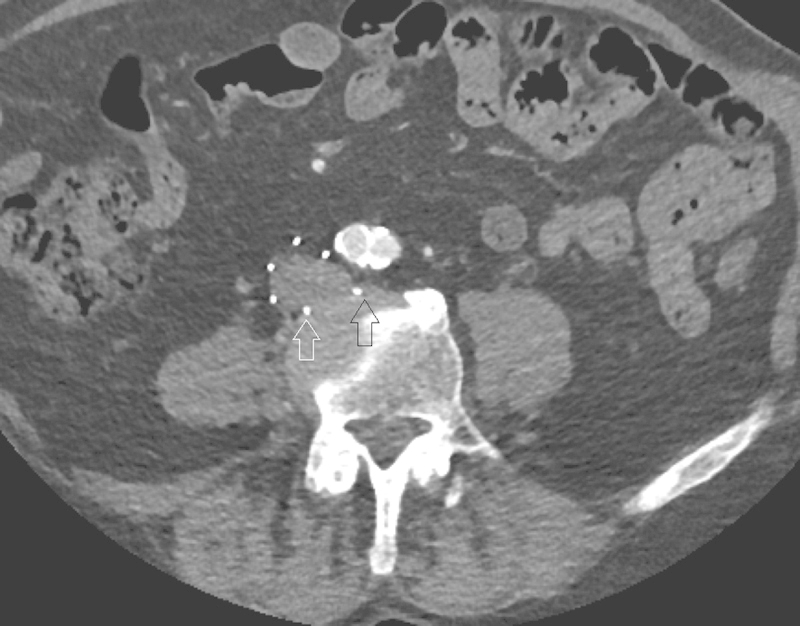
IVC filter strut penetration at CT. Axial arterial phase contrast-enhanced CT showing penetration of multiple IVC filter legs both anteriorly and posteriorly, contacting the adjacent intervertebral disc (black and white arrows). Due to the presence of fat surrounding the IVC, filter complications are well characterized on CT with or without contrast.
Fig. 13.
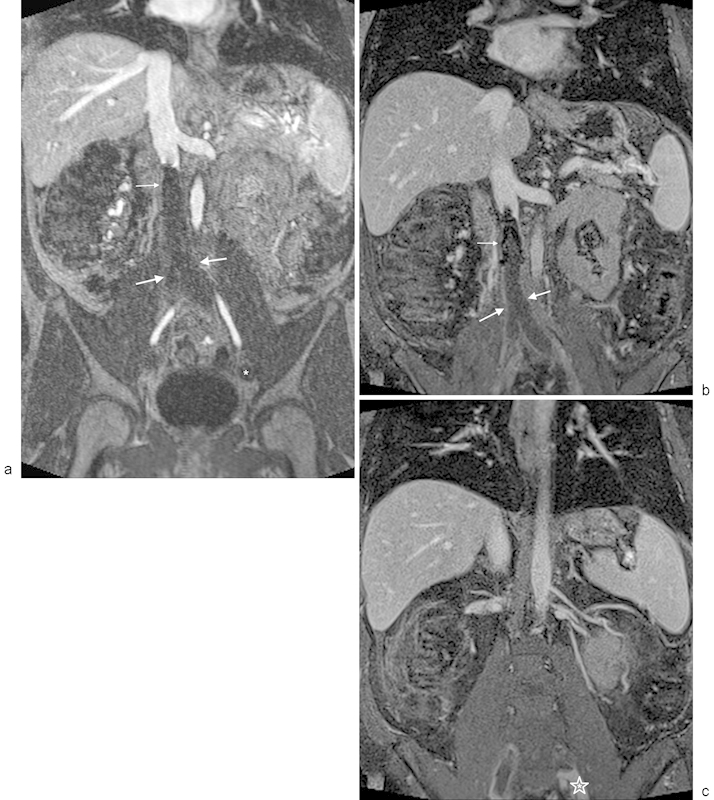
MR venography with occlusive IVC thrombosis extending from an IVC filter. (a) Venous phase contrast-enhanced MRA using gadofosveset trisodium demonstrates occlusive IVC and bilateral iliac thrombus (thick arrows) extending inferiorly from an IVC filter (thin arrow). Note that the distal iliac vein on the left is not opacified, which could be either thrombus or secondary to prolonged arteriovenous transit (asterisk). (b) Steady-state imaging using a 3D, T1-weighted, fat-saturated acquisition demonstrates the IVC filter (thin arrow) with peripheral enhancement around the occlusive IVC and bi-iliac thrombus (thick arrows). (c) Steady-state, 3D, T1-weighted, fat-saturated image demonstrates the inferior-most extent of the left iliac thrombus (asterisk). The thrombus extends peripherally to the confluence of the internal and external iliac veins.
Fig. 14.
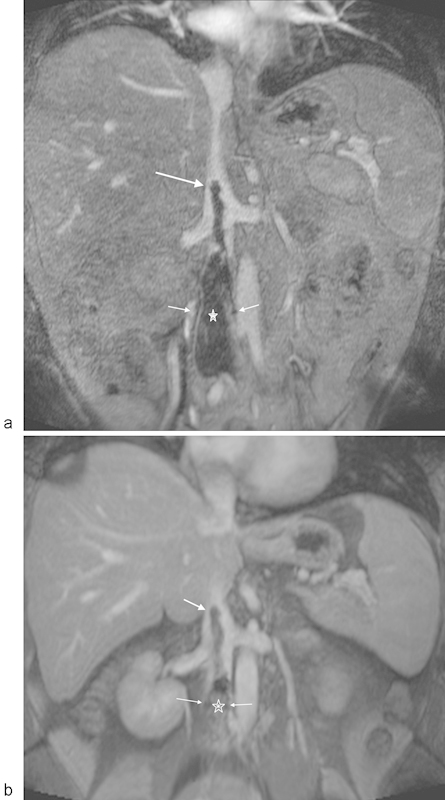
MR venography using gadofosveset trisodium (a) Contrast-enhanced MR angiogram acquired in the venous phase demonstrating thrombus (thick arrow) extending above the IVC filter (thin arrows denote leg struts) with clot below the filter as well (asterisk). (b) Contrast-enhanced 3D, T1-weighted, fat-saturated image acquired in the steady state, with persistent vascular enhancement. The filter struts are depicted with thin arrows, with the clot extending cephalad to the filter with a thick arrow. The clot below the filter is higher signal secondary to partial thrombosis of the inferior vena cava below the filter, better appreciated in the steady state of contrast enhancement (asterisk).
Conclusion
In conclusion, this article has discussed noninvasive imaging options used when evaluating the IVC and lower extremity venous system for pre-filter assessment, diagnosis of IVC/lower extremity thrombosis, and assessing postprocedural complications. Options also include techniques for patients with poor renal function, and in cases where GBCAs are contraindicated.
References
- 1.Goldhaber S Z. Venous thromboembolism: epidemiology and magnitude of the problem. Best Pract Res Clin Haematol. 2012;25(3):235–242. doi: 10.1016/j.beha.2012.06.007. [DOI] [PubMed] [Google Scholar]
- 2.Heit J A. The epidemiology of venous thromboembolism in the community. Arterioscler Thromb Vasc Biol. 2008;28(3):370–372. doi: 10.1161/ATVBAHA.108.162545. [DOI] [PMC free article] [PubMed] [Google Scholar]
- 3.Beckman M G Hooper W C Critchley S E Ortel T L Venous thromboembolism: a public health concern Am J Prev Med 201038(4, Suppl):S495–S501. [DOI] [PubMed] [Google Scholar]
- 4.Prandoni P, Noventa F, Ghirarduzzi A. et al. The risk of recurrent venous thromboembolism after discontinuing anticoagulation in patients with acute proximal deep vein thrombosis or pulmonary embolism. A prospective cohort study in 1,626 patients. Haematologica. 2007;92(2):199–205. doi: 10.3324/haematol.10516. [DOI] [PubMed] [Google Scholar]
- 5.Kahn S R, Comerota A J, Cushman M. et al. The postthrombotic syndrome: evidence-based prevention, diagnosis, and treatment strategies: a scientific statement from the American Heart Association. Circulation. 2014;130(18):1636–1661. doi: 10.1161/CIR.0000000000000130. [DOI] [PubMed] [Google Scholar]
- 6.Shefler A, Gillis J, Lam A, O'Connell A J, Schell D, Lammi A. Inferior vena cava thrombosis as a complication of femoral vein catheterisation. Arch Dis Child. 1995;72(4):343–345. doi: 10.1136/adc.72.4.343. [DOI] [PMC free article] [PubMed] [Google Scholar]
- 7.American College of Radiology . Available at: https://acsearch.acr.org/docs/69416/Narrative/. Accessed April 25, 2016
- 8.Zierler B K. Ultrasonography and diagnosis of venous thromboembolism. Circulation. 2004;109(12) 01:I9–I14. doi: 10.1161/01.CIR.0000122870.22669.4a. [DOI] [PubMed] [Google Scholar]
- 9.Vogel P, Laing F C, Jeffrey R B Jr, Wing V W. Deep venous thrombosis of the lower extremity: US evaluation. Radiology. 1987;163(3):747–751. doi: 10.1148/radiology.163.3.3554344. [DOI] [PubMed] [Google Scholar]
- 10.Sigel B, Felix W R Jr, Popky G L, Ipsen J. Diagnosis of lower limb venous thrombosis by Doppler ultrasound technique. Arch Surg. 1972;104(2):174–179. doi: 10.1001/archsurg.1972.04180020054010. [DOI] [PubMed] [Google Scholar]
- 11.Baeshko A A, Zhuk G V, Orlovskiĭ IuN. et al. Congenital anomalies of the inferior vena cava: diagnosis and medical treatment [in Russian] Angiol Sosud Khir. 2007;13(1):91–95. [PubMed] [Google Scholar]
- 12.McAree B J, O'Donnell M E, Boyd C, Spence R A, Lee B, Soong C V. Inferior vena cava thrombosis in young adults—a review of two cases. Ulster Med J. 2009;78(2):129–133. [PMC free article] [PubMed] [Google Scholar]
- 13.Lin E P, Bhatt S, Rubens D, Dogra V S. The importance of monophasic Doppler waveforms in the common femoral vein: a retrospective study. J Ultrasound Med. 2007;26(7):885–891. doi: 10.7863/jum.2007.26.7.885. [DOI] [PubMed] [Google Scholar]
- 14.Neglén P, Berry M A, Raju S. Endovascular surgery in the treatment of chronic primary and post-thrombotic iliac vein obstruction. Eur J Vasc Endovasc Surg. 2000;20(6):560–571. doi: 10.1053/ejvs.2000.1251. [DOI] [PubMed] [Google Scholar]
- 15.Gamblin T C, Ashley D W, Burch S, Solis M. A prospective evaluation of a bedside technique for placement of inferior vena cava filters: accuracy and limitations of intravascular ultrasound. Am Surg. 2003;69(5):382–386. [PubMed] [Google Scholar]
- 16.Ashley D W, Gamblin T C, Burch S T, Solis M M. Accurate deployment of vena cava filters: comparison of intravascular ultrasound and contrast venography. J Trauma. 2001;50(6):975–981. doi: 10.1097/00005373-200106000-00002. [DOI] [PubMed] [Google Scholar]
- 17.Bonn J, Liu J B, Eschelman D J, Sullivan K L, Pinheiro L W, Gardiner G A Jr. Intravascular ultrasound as an alternative to positive-contrast vena cavography prior to filter placement. J Vasc Interv Radiol. 1999;10(7):843–849. doi: 10.1016/s1051-0443(99)70126-0. [DOI] [PubMed] [Google Scholar]
- 18.Mavili E, Ozturk M, Akcali Y. et al. Direct CT venography for evaluation of the lower extremity venous anomalies of Klippel-Trenaunay Syndrome. AJR Am J Roentgenol. 2009;192(6):W311-6. doi: 10.2214/AJR.08.1151. [DOI] [PubMed] [Google Scholar]
- 19.Shah A A, Buckshee N, Yankelevitz D F, Henschke C I. Assessment of deep venous thrombosis using routine pelvic CT. AJR Am J Roentgenol. 1999;173(3):659–663. doi: 10.2214/ajr.173.3.10470898. [DOI] [PubMed] [Google Scholar]
- 20.Stehling M K, Rosen M P, Weintraub J, Kim D, Raptopoulos V. Spiral CT venography of the lower extremity. AJR Am J Roentgenol. 1994;163(2):451–453. doi: 10.2214/ajr.163.2.8037048. [DOI] [PubMed] [Google Scholar]
- 21.Cham M D, Yankelevitz D F, Shaham D. et al. Deep venous thrombosis: detection by using indirect CT venography. Radiology. 2000;216(3):744–751. doi: 10.1148/radiology.216.3.r00se44744. [DOI] [PubMed] [Google Scholar]
- 22.Loud P A, Grossman Z D, Klippenstein D L, Ray C E. Combined CT venography and pulmonary angiography: a new diagnostic technique for suspected thromboembolic disease. AJR Am J Roentgenol. 1998;170(4):951–954. doi: 10.2214/ajr.170.4.9530042. [DOI] [PubMed] [Google Scholar]
- 23.Yankelevitz D F, Gamsu G, Shah A. et al. Optimization of combined CT pulmonary angiography with lower extremity CT venography. AJR Am J Roentgenol. 2000;174(1):67–69. doi: 10.2214/ajr.174.1.1740067. [DOI] [PubMed] [Google Scholar]
- 24.Min S K, Kim S Y, Park Y J. et al. Role of three-dimensional computed tomography venography as a powerful navigator for varicose vein surgery. J Vasc Surg. 2010;51(4):893–899. doi: 10.1016/j.jvs.2009.10.117. [DOI] [PubMed] [Google Scholar]
- 25.Arakawa H, Kohno T, Hiki T, Kaji Y. CT pulmonary angiography and CT venography: factors associated with vessel enhancement. AJR Am J Roentgenol. 2007;189(1):156–161. doi: 10.2214/AJR.06.1240. [DOI] [PubMed] [Google Scholar]
- 26.Nakaura T, Awai K, Oda S. et al. Low-kilovoltage, high-tube-current MDCT of liver in thin adults: pilot study evaluating radiation dose, image quality, and display settings. AJR Am J Roentgenol. 2011;196(6):1332–1338. doi: 10.2214/AJR.10.5698. [DOI] [PubMed] [Google Scholar]
- 27.Morcos S K. Extracellular gadolinium contrast agents: differences in stability. Eur J Radiol. 2008;66(2):175–179. doi: 10.1016/j.ejrad.2008.01.025. [DOI] [PubMed] [Google Scholar]
- 28.Swan S K, Lambrecht L J, Townsend R. et al. Safety and pharmacokinetic profile of gadobenate dimeglumine in subjects with renal impairment. Invest Radiol. 1999;34(7):443–448. doi: 10.1097/00004424-199907000-00001. [DOI] [PubMed] [Google Scholar]
- 29.Marckmann P, Skov L, Rossen K. et al. Nephrogenic systemic fibrosis: suspected causative role of gadodiamide used for contrast-enhanced magnetic resonance imaging. J Am Soc Nephrol. 2006;17(9):2359–2362. doi: 10.1681/ASN.2006060601. [DOI] [PubMed] [Google Scholar]
- 30.Sadowski E A, Bennett L K, Chan M R. et al. Nephrogenic systemic fibrosis: risk factors and incidence estimation. Radiology. 2007;243(1):148–157. doi: 10.1148/radiol.2431062144. [DOI] [PubMed] [Google Scholar]
- 31.Grobner T. Gadolinium—a specific trigger for the development of nephrogenic fibrosing dermopathy and nephrogenic systemic fibrosis? Nephrol Dial Transplant. 2006;21(4):1104–1108. doi: 10.1093/ndt/gfk062. [DOI] [PubMed] [Google Scholar]
- 32.Perazella M A. Nephrogenic systemic fibrosis, kidney disease, and gadolinium: is there a link? Clin J Am Soc Nephrol. 2007;2(2):200–202. doi: 10.2215/CJN.00030107. [DOI] [PubMed] [Google Scholar]
- 33.Kanda T, Ishii K, Kawaguchi H, Kitajima K, Takenaka D. High signal intensity in the dentate nucleus and globus pallidus on unenhanced T1-weighted MR images: relationship with increasing cumulative dose of a gadolinium-based contrast material. Radiology. 2014;270(3):834–841. doi: 10.1148/radiol.13131669. [DOI] [PubMed] [Google Scholar]
- 34.Kanda T, Osawa M, Oba H. et al. High signal intensity in dentate nucleus on unenhanced T1-weighted MR images: association with linear versus macrocyclic gadolinium chelate administration. Radiology. 2015;275(3):803–809. doi: 10.1148/radiol.14140364. [DOI] [PubMed] [Google Scholar]
- 35.Radbruch A, Weberling L D, Kieslich P J. et al. Gadolinium retention in the dentate nucleus and globus pallidus is dependent on the class of contrast agent. Radiology. 2015;275(3):783–791. doi: 10.1148/radiol.2015150337. [DOI] [PubMed] [Google Scholar]
- 36.Kanda T, Fukusato T, Matsuda M. et al. Gadolinium-based contrast agent accumulates in the brain even in subjects without severe renal dysfunction: evaluation of autopsy brain specimens with inductively coupled plasma mass spectroscopy. Radiology. 2015;276(1):228–232. doi: 10.1148/radiol.2015142690. [DOI] [PubMed] [Google Scholar]
- 37.Bashir M R, Bhatti L, Marin D, Nelson R C. Emerging applications for ferumoxytol as a contrast agent in MRI. J Magn Reson Imaging. 2015;41(4):884–898. doi: 10.1002/jmri.24691. [DOI] [PubMed] [Google Scholar]
- 38.FDA . Available at: http://www.fda.gov/Safety/MedWatch/SafetyInformation/SafetyAlertsforHumanMedicalProducts/ucm440479.htm. Accessed April 25, 2016
- 39.Goyen M. Gadofosveset-enhanced magnetic resonance angiography. Vasc Health Risk Manag. 2008;4(1):1–9. doi: 10.2147/vhrm.2008.04.01.1. [DOI] [PMC free article] [PubMed] [Google Scholar]
- 40.Ruehm S G, Zimny K, Debatin J F. Direct contrast-enhanced 3D MR venography. Eur Radiol. 2001;11(1):102–112. doi: 10.1007/s003300000586. [DOI] [PubMed] [Google Scholar]
- 41.Laissy J P, Cinqualbre A, Loshkajian A. et al. Assessment of deep venous thrombosis in the lower limbs and pelvis: MR venography versus duplex Doppler sonography. AJR Am J Roentgenol. 1996;167(4):971–975. doi: 10.2214/ajr.167.4.8819396. [DOI] [PubMed] [Google Scholar]
- 42.Enden T, Storås T H, Negård A. et al. Visualization of deep veins and detection of deep vein thrombosis (DVT) with balanced turbo field echo (b-TFE) and contrast-enhanced T1 fast field echo (CE-FFE) using a blood pool agent (BPA) J Magn Reson Imaging. 2010;31(2):416–424. doi: 10.1002/jmri.22046. [DOI] [PubMed] [Google Scholar]
- 43.Hansch A, Betge S, Poehlmann G. et al. Combined magnetic resonance imaging of deep venous thrombosis and pulmonary arteries after a single injection of a blood pool contrast agent. Eur Radiol. 2011;21(2):318–325. doi: 10.1007/s00330-010-1918-0. [DOI] [PubMed] [Google Scholar]
- 44.Hadizadeh D R, Kukuk G M, Fahlenkamp U L. et al. Simultaneous MR arteriography and venography with blood pool contrast agent detects deep venous thrombosis in suspected arterial disease. AJR Am J Roentgenol. 2012;198(5):1188–1195. doi: 10.2214/AJR.11.7306. [DOI] [PubMed] [Google Scholar]
- 45.Carpenter J P, Holland G A, Baum R A, Owen R S, Carpenter J T, Cope C. Magnetic resonance venography for the detection of deep venous thrombosis: comparison with contrast venography and duplex Doppler ultrasonography. J Vasc Surg. 1993;18(5):734–741. doi: 10.1067/mva.1993.49364. [DOI] [PubMed] [Google Scholar]
- 46.Thiele H, Nagel E, Paetsch I. et al. Functional cardiac MR imaging with steady-state free precession (SSFP) significantly improves endocardial border delineation without contrast agents. J Magn Reson Imaging. 2001;14(4):362–367. doi: 10.1002/jmri.1195. [DOI] [PubMed] [Google Scholar]
- 47.Cukur T, Lee J H, Bangerter N K, Hargreaves B A, Nishimura D G. Non-contrast-enhanced flow-independent peripheral MR angiography with balanced SSFP. Magn Reson Med. 2009;61(6):1533–1539. doi: 10.1002/mrm.21921. [DOI] [PMC free article] [PubMed] [Google Scholar]
- 48.Lindquist C M, Karlicki F, Lawrence P, Strzelczyk J, Pawlyshyn N, Kirkpatrick I D. Utility of balanced steady-state free precession MR venography in the diagnosis of lower extremity deep venous thrombosis. AJR Am J Roentgenol. 2010;194(5):1357–1364. doi: 10.2214/AJR.09.3552. [DOI] [PubMed] [Google Scholar]
- 49.Edelman R R, Sheehan J J, Dunkle E, Schindler N, Carr J, Koktzoglou I. Quiescent-interval single-shot unenhanced magnetic resonance angiography of peripheral vascular disease: technical considerations and clinical feasibility. Magn Reson Med. 2010;63(4):951–958. doi: 10.1002/mrm.22287. [DOI] [PMC free article] [PubMed] [Google Scholar]
- 50.Ayache J B, Collins J D. MR angiography of the abdomen and pelvis. Radiol Clin North Am. 2014;52(4):839–859. doi: 10.1016/j.rcl.2014.02.017. [DOI] [PubMed] [Google Scholar]
- 51.Hodnett P A, Koktzoglou I, Davarpanah A H. et al. Evaluation of peripheral arterial disease with nonenhanced quiescent-interval single-shot MR angiography. Radiology. 2011;260(1):282–293. doi: 10.1148/radiol.11101336. [DOI] [PMC free article] [PubMed] [Google Scholar]
- 52.Amin P, Collins J D, Koktzoglou I. et al. Evaluating peripheral arterial disease with unenhanced quiescent-interval single-shot MR angiography at 3 T. AJR Am J Roentgenol. 2014;202(4):886–893. doi: 10.2214/AJR.13.11243. [DOI] [PubMed] [Google Scholar]
- 53.Lichy M P, Wietek B M, Mugler J P III. et al. Magnetic resonance imaging of the body trunk using a single-slab, 3-dimensional, T2-weighted turbo-spin-echo sequence with high sampling efficiency (SPACE) for high spatial resolution imaging: initial clinical experiences. Invest Radiol. 2005;40(12):754–760. doi: 10.1097/01.rli.0000185880.92346.9e. [DOI] [PubMed] [Google Scholar]
- 54.Zhang Z, Fan Z, Carroll T J. et al. Three-dimensional T2-weighted MRI of the human femoral arterial vessel wall at 3.0 Tesla. Invest Radiol. 2009;44(9):619–626. doi: 10.1097/RLI.0b013e3181b4c218. [DOI] [PMC free article] [PubMed] [Google Scholar]
- 55.Morita S, Masukawa A, Suzuki K, Hirata M, Kojima S, Ueno E. Unenhanced MR angiography: techniques and clinical applications in patients with chronic kidney disease. Radiographics: a review publication of the Radiological Society of North America. Inc. 2011;31:E13–E33. doi: 10.1148/rg.312105075. [DOI] [PubMed] [Google Scholar]
- 56.Park J H, Lee J B, Han M C. et al. Sonographic evaluation of inferior vena caval obstruction: correlative study with vena cavography. AJR Am J Roentgenol. 1985;145(4):757–762. doi: 10.2214/ajr.145.4.757. [DOI] [PubMed] [Google Scholar]
- 57.Sing R F, Stackhouse D J, Jacobs D G, Heniford B T. Safety and accuracy of bedside carbon dioxide cavography for insertion of inferior vena cava filters in the intensive care unit. J Am Coll Surg. 2001;192(2):168–171. doi: 10.1016/s1072-7515(00)00786-9. [DOI] [PubMed] [Google Scholar]
- 58.Schmelzer T M, Christmas A B, Jacobs D G, Heniford B T, Sing R F. Imaging of the vena cava in the intensive care unit prior to vena cava filter insertion: carbon dioxide as an alternative to iodinated contrast. Am Surg. 2008;74(2):141–145. [PubMed] [Google Scholar]
- 59.Moos J M, Ham S W, Han S M. et al. Safety of carbon dioxide digital subtraction angiography. Arch Surg. 2011;146(12):1428–1432. doi: 10.1001/archsurg.2011.195. [DOI] [PubMed] [Google Scholar]
- 60.Caplin D M Nikolic B Kalva S P Ganguli S Saad W E Zuckerman D A; Society of Interventional Radiology Standards of Practice Committee. Quality improvement guidelines for the performance of inferior vena cava filter placement for the prevention of pulmonary embolism J Vasc Interv Radiol 201122111499–1506. [DOI] [PubMed] [Google Scholar]
- 61.Harvey J J, Hopkins J, McCafferty I J, Jones R G. Inferior vena cava filters: what radiologists need to know. Clin Radiol. 2013;68(7):721–732. doi: 10.1016/j.crad.2013.01.001. [DOI] [PubMed] [Google Scholar]
- 62.Nazzal M, Chan E, Nazzal M. et al. Complications related to inferior vena cava filters: a single-center experience. Ann Vasc Surg. 2010;24(4):480–486. doi: 10.1016/j.avsg.2009.07.015. [DOI] [PubMed] [Google Scholar]
- 63.Bustamante M, Abascal F, Garcia-Valtuille R, González-Tutor A, Gómez J M. Sudden death in a patient caused by migration of an Antheor vena cava filter to the heart. J Vasc Interv Radiol. 1998;9(3):521–522. doi: 10.1016/s1051-0443(98)70315-x. [DOI] [PubMed] [Google Scholar]


