

Abstract
Introduction
The concept of community viral load as a modifiable driver of new HIV infections has attracted substantial attention. While several measures of community viral load have been proposed, none have been empirically compared as correlates of HIV incidence.
Methods
In a sample of 26,503 people who inject drugs (PWID) and men who have sex with men (MSM) recruited using respondent-driven sampling from 27 sites in India, we assessed site-level correlations between five community-based measures of HIV control and HIV incidence - estimated with a multi-assay algorithm. Antiretroviral therapy (ART) use was self-reported. All subjects were tested for HIV, with additional testing in HIV-positive participants. Population viral load (PVL), aware viral load (AVL), and in-care viral load (ICVL), were the mean log10 HIV RNA among all HIV-positive persons, those aware of their diagnosis (but not necessarily in care), and those in care, respectively. Population ART coverage was defined as the proportion of HIV-positive subjects taking ART and prevalence of viremia as the prevalence of HIV-positive individuals with HIV RNA>150 copies/ml.
Findings
Prevalence of viremia (ρ=0.81) was significantly more correlated with HIV incidence than all other measures including ICVL (ρ=0.29), AVL (ρ=0.59), PVL (ρ=0.51) and population ART coverage (ρ=−0.54). In regression analysis, a reduction in prevalence of viremia of 4.34% was associated with a 1% decrease in HIV incidence.
Interpretation
Prevalence of viremia, which incorporates information on HIV prevalence and viremia, had the strongest correlation with HIV incidence in this sample and may be a useful measure of program effectiveness.
Funding
US National Institutes of Health, Elton John AIDS Foundation
INTRODUCTION
Compelling evidence of HIV treatment as prevention from clinical studies1 and expanding, but highly variable, global antiretroviral therapy (ART) coverage2,3 has focused attention on the need to monitor community-level effectiveness of ART. In the treatment as prevention paradigm, HIV incidence is the optimal measure of program effectiveness. However, measurement of HIV incidence is difficult and expensive, and rarely undertaken outside of a research context.4 Researchers have proposed community viral load5,6 and population ART coverage2 as capturing a causal relationship between community-level HIV treatment effectiveness and HIV transmission.
Community viral load - a family of measures derived from HIV RNA measurements in subgroups of HIV-infected persons – has been temporally correlated with HIV incidence or new HIV diagnoses (from administrative databases) in ecologic studies.7–9 However, these measures have limitations. Community viral load data derived from administrative databases fail to represent individuals who are out-of-care or unaware of their status, a population that has been proposed to account for a large fraction of HIV transmission.5 Community viral load measured in the context of a cohort study may reflect out-of-care persons, but is unlikely to adequately account for those who are unaware of their status, as seronegative cohort participants are usually routinely tested for HIV at study visits. Others have argued that central tendency measures of community viral load among infected persons fail to account for HIV prevalence, which may vary widely by community.5,10
Unlike community viral load measures, the metric of population ART coverage is based on administrative pharmaceutical data and does not require HIV RNA quantification. This and the ability to measure ART coverage using self-report survey data makes it an appealing measure for resource-limited settings. In a large study from South Africa, higher regional ART coverage was associated with lower HIV incidence.2 To date, no studies have directly compared strength of association between measures of community viral load or ART coverage and HIV incidence in the same sample.
We had a unique opportunity to estimate multiple measures of community viral load and population ART coverage with data systematically collected from 26,503 individuals at high-risk for HIV acquisition across 27 Indian sites – 12,022 men who have sex with men (MSM)11 and 14,481 people who inject drugs (PWID).12 We compared correlations of community measures of viral burden and ART coverage with a validated cross-sectional multi-assay algorithm of HIV incidence.13
METHODS
Study Setting
Data were collected from the baseline assessment of an ongoing cluster randomized trial among MSM and PWID in India (ClinicalTrials.gov Identifier: NCT01686750). The study, “Integrated Care Centers to improve HIV outcomes in vulnerable Indian populations: National Collaboration on AIDS [The NCA study]” uses a cluster randomized trial design to evaluate the effectiveness of integrated care centers on improving uptake of HIV testing, care and treatment among MSM and PWID in 22 cities across India. The intervention, integrated HIV prevention and treatment services in a single venue, is nested between two serial cross-sectional surveys. The baseline assessment was conducted in 27 sites (12 MSM and 15 PWID) across India (Supplementary Figure 1),11,12 selected to reflect varying stages of the HIV epidemic among MSM and PWID.
Study Population
Detailed rationale for the approach have been described.11,12,14 The study population was accrued using respondent-driven sampling (RDS), a chain-referral recruitment strategy that is effective in recruiting hard-to-reach populations.15,16 In each site, prior to the RDS, ethnography was conducted to identify “seeds” – individuals considered influential in the local (i.e., city) MSM/PWID community who served as the starting point for RDS. Each participant that completed the study assessment was given two hologram-labeled referral coupons to recruit two members of their network. Two seeds (started simultaneously) were used in all but one MSM site (Delhi) and one PWID site (Gangtok) where an additional seed was included. Recruitment was continued at each site until 1000 eligible participants had been recruited. The median depth (IQR [interquartile range]) of the RDS samples in the MSM sites was 21 waves from the seed (15 – 23) and 22 (14 – 31) in the PWID sites. The median time (IQR) to recruitment was 99 days (84 – 120) in MSM sites and 135 days (89 – 145) in PWID sites. Participants were reimbursed both for participation and for each eligible subject they referred to the study. Participants provided a fingerprint, which generated a unique hexadecimal code to prevent duplicate enrollment to the study. All RDS process measures were satisfied with respect to equilibrium during recruitment (covariate proportions stabilized with successive recruitment waves) and homophily (the tendency of participants to recruit individuals with similar characteristics) according to HIV status and other factors. Homophily with respect to HIV status was <0.20 in all but 2 sites.11,12
Eligibility criteria for both MSM and PWID included: (1) age ≥ 18 years; (2) informed consent; and (3) possession of a valid RDS referral coupon. In addition to these criteria, MSM participants also had to self-identify as male and report sex with a man in the prior 12 months. Similarly, PWID participants had to additionally report drug injection in the prior 24 months.
Study Procedures
Participants completed an interviewer-administered electronic survey, which captured information on demographics, risk behavior and access to HIV prevention and treatment services. Participants underwent rapid HIV testing with pre- and post-test counseling on-site. Samples were shipped to the central laboratory in Chennai, India.
HIV testing and estimation of cross-sectional HIV incidence
HIV testing was performed on all participants with three rapid tests: Alere™ Determine™ HIV-1/2 (Alere Medical Co., Ltd., Chiba, Japan); First response HIV card test 1–2.0 (PMC Medical India Pvt, Ltd, Daman, India); and Signal Flow Through HIV 1+2 Spot/Immunodot Test kit, (Span Diagnostics Ltd, Surat, India).
To estimate cross-sectional HIV incidence, we used a multi assay algorithm (MAA) validated for subtype-C – the predominant subtype in India.17 The first step in this method was to conduct additional testing on specimens from HIV seropositive participants, including absolute CD4+ count using the FlowCARE™ PLG CD4 (CD45-FITC/CD4-PE) assay (Beckman Coulter, CA, USA), HIV-1 RNA using RealTime HIV-1 assay (Abbott Laboratories, Abbott Park, Illinois, USA), Aware™ BED™ EIA HIV-1 Incidence Test (Calypte Biomedical Corporation, Portland, OR, USA), and an avidity assay based on the GS HIV-1/HIV-2 PLUS O EIA kit (Biorad Laboratories, Redmond, CA, USA) using diethyl amine as the chaotropic agent. HIV seropositive subjects were characterized as recently infected if the following criteria applied: BED-CEIA <1.0 OD-n, avidity index <80%, CD4 cell count >200 cells/mm3 and HIV viral load >400 copies/ml. Estimated incidence was then based on the frequency of recently infected individuals divided by the uninfected individuals (representing the at-risk population) and adjusted by the window period (0.56 years), which provides the time dimension for the estimate.
Statistical Analyses
We calculated community viral load measures that have been codified by the Centers for Disease Control and Prevention (CDC), USA and other groups:5,6,10 (1) In-care viral load (ICVL): arithmetic mean of the log10 HIV RNA among HIV-infected persons currently engaged in care (reported an HIV physician visit in the prior 6 months); (2) Aware viral load (AVL): arithmetic mean of the log10 HIV RNA among HIV-infected persons in a community aware of their status, regardless of engagement in care; (3) Population viral load (PVL): arithmetic mean of the log10 HIV RNA among all HIV-infected persons in the community, regardless of whether they are engaged in care or aware of status; and (4) Prevalence of viremia: prevalence of HIV-infected persons with HIV RNA>150 copies/ml in the community. Additionally, we estimated population ART coverage as the proportion of HIV-infected persons who self-reported ART use in the prior 30 days. All persons who responded that they were aware of their HIV positive status were asked about their experience with ART.
Distribution of each community measure by site-level HIV incidence is seen in Supplementary Figure 1. Correlations between community measures and HIV incidence were assessed using Spearman correlation coefficients. The absolute value of the correlation coefficients of the measures were statistically compared against each other using the Fisher r-to-z transformation.18 The association between each measure and HIV incidence was assessed using simple linear regression models expressed as change in HIV incidence per standard deviation (SD) change of the explanatory variable to facilitate comparisons across measures. R-squared (R2), which represents the proportion of the variance explained by covariates in the model was used to assess discrimination (ability of measures to distinguish between communities with higher and lower HIV incidence) across models. Akaike information criterion (AIC) and Bayesian information criterion (BIC) were further used to compare model fit. Both are model fit statistics that consider both goodness of fit and parsimony. Optimal models minimize both AIC and BIC. Regression coefficients were standardized by population (MSM/PWID). Further, using the model-based estimates, we calculated the change that would be required in each community measure to achieve a one percent decline in HIV incidence.
In one MSM site, Lucknow, none of the HIV-infected persons were aware of their status or in-care so neither ICVL nor AVL could be calculated. For the primary analysis, we assumed that there were HIV-infected persons aware of their status and/or in-care in Lucknow but that our sample failed to identify them. Thus, to include this site in analyses, we imputed the ICVL and AVL using a multiple imputation approach. We created 100 imputed values of ICVL and AVL modeled using relevant predictors, and then averaged across these 100 values in order to estimate one ICVL and AVL value to be used in the correlation and regression model analyses. In sensitivity analyses, we also considered that there were actually no HIV-infected persons aware of their HIV status or in care in Lucknow and imputed zero and the highest value of HIV RNA for the ICVL and AVL in this site – inferences remained unchanged.
Primary analyses were performed using unweighted data, as our goal was to examine correlations rather than to draw inferences about disease burden in the underlying population. Additional sensitivity analyses were conducted: (1) Community viral load measures were recalculated using absolute values of HIV RNA vs. log10-transformed values; (2) Population ART coverage was redefined as the proportion of HIV-infected person who ever initiated ART (vs. currently taking ART); (3) Alternative cut-offs for viremic individuals of HIV RNA>1000 and HIV RNA>5000 copies/ml were used; (4) HIV prevalence was examined as a predictor of HIV incidence and compared against community viral load and proportion ART coverage; (5) RDS-weights were used to estimate measures and HIV incidence and correlations were reexamined (Supplementary Tables 1 thru 4). We used the Volz–Heckathorn estimator (RDS-II),19 which weights estimates for network size (number of PWID or MSM in the city whom a participant saw in the prior 30 days), to calculate site-level estimates of all measures and HIV incidence. Because there is no accepted method to weight cross-sectional HIV incidence estimates, to calculate weighted HIV incidence, we estimated the weighted prevalence of recent infections using RDS-II weights in a community and used this value in the equation described above13 to estimate cross-sectional incidence; and (6) outlying sites identified by exploring influence and leverage were removed from estimates of correlation and regression models (Supplementary Table 5).
Statistical analyses were performed using STATA version 12.0 (STATA Corp., College Station, Texas, USA) and R version 3.1.3 (The R Foundation for Statistical Computing, Vienna, Austria).
Ethical Clearances
This study was approved by institutional review boards at the Johns Hopkins School of Medicine, Johns Hopkins Bloomberg School of Public Health and the YR Gaitonde Centre for AIDS Research and Education and study participants provided oral consent.
Role of Funding Source
The sponsor of the study had no role in study design, data collection, data analysis, data interpretation, or writing of the report. The corresponding author had full access to all the data in the study and had final responsibility for the decision to submit for publication.
FINDINGS
Description of Study Population
A total 26,503 (12,022 MSM and 14,481 PWID) participants were recruited across 27 sites in India between October 2012 and December 2013. The median site-level HIV prevalence across MSM and PWID sites was 8.6% (IQR: 6.1 – 13.2) and 19.7% (IQR: 10.2 – 30.6), respectively, with a site range of 2.0% to 43.3% (Table 1). The median site-level HIV incidence, based on cross-sectional incidence estimation, in MSM and PWID sites was 0.87% (IQR: 0.40 – 1.17) and 1.43% (IQR: 0.60 – 4.00), respectively (Supplementary Figure 2). Sample characteristics and factors associated with HIV prevalence and incidence have been described previously.11,12 The median site-level age was 28 years (IQR: 26 – 31). The percentage of women in the PWID sites ranged from 0% to 20.6%. The majority had attained secondary level of education or lower (Table 1). The site-level median prevalence of unprotected anal intercourse with another man in the prior six months among MSM was 55.9% (IQR: 42.3 – 66.0). In the PWID sites, a median 91.5% (IQR: 84.3 – 96.9) reported injection in the prior 6 months.
Table 1.
Description of site-level characteristics by stratified by population
| MSM (n=12,022; 12 sites) |
PWID (n=14,481; 15 sites) |
|
|---|---|---|
|
| ||
| Site median (IQR) | Site median (IQR) | |
| Median age in years | 26 (25 – 30) | 30 (27 – 32) |
| Proportion male (%) | 100 | 98.4 (88.7 – 99.8) |
| Education (%) | ||
| • Primary school or less | 18.8 (17.0 – 28.7) | 32.8 (22.8 – 42.5) |
| • Secondary school | 41.8 (37.8 – 50.0) | 45.6 (40.7 – 52.8) |
| • High school and above | 29.8 (27.2 – 40.4) | 21.0 (9.5 – 24.1) |
| Marital status (%) | ||
| • Currently married/living with partner | 37.9 (29.5 – 47.2) | 46.9 (33.9 – 58.3) |
| • Never married | 59.7 (48.4 – 63.4) | 41.8 (29.8 – 49.3) |
| Median monthly income in Indian rupees | 6000 (5250 – 6750) | 5000 (4000 – 6000) |
| Ever injected drugs (%) | 1.0 (0.4 – 2.2) | 100 |
| Median age at 1st injection in years | 19 (18 – 20) | 21 (19 – 22) |
| Injected drugs in past 6 months (%) | 1.0 (0.4 – 1.9) | 91.5 (84.3 – 96.9) |
| Shared needles in the past 6 months (%) | 0.3 (0.2 – 0.5) | 35.0 (27.2 – 50.1) |
| Ever heterosexual sex, (%) | 70.1 (63.9 – 80.4) | 88.3 (79.8 – 91.1) |
| Unprotected heterosexual sex in the past 6 months (%) | 41.4 (32.5 – 49.9) | 39.1 (33.3 – 58.4) |
| Ever MSM behavior (%) | 100 | 3.7 (2.1 – 9.3) |
| Median age at 1st MSM encounter | 18 (17 – 19) | 20 (18 – 22) |
| Unprotected MSM behavior in the past 6 months (%) | 55.9 (42.3 – 66.0) | 0.8 (0.5 – 1.5) |
| HIV Prevalence (%) | 8.6 (6.1 – 13.2) | 19.7 (10.2 – 30.6) |
| HIV incidence (%)* | 0.87 (0.40 – 1.17) | 1.43 (0.60 – 4.00) |
IQR - interquartile range; MSM – men who have sex with men; PWID – people who inject drugs;
HIV incidence was estimated using a multi-assay algorithm that incorporated BED CEIA, avidity index, absolute CD4+ count and HIV RNA
Distribution of community measures
The median ICVL, AVL and PVL across sites were 2.7 (IQR: 2.5 – 3.4), 3.1 (IQR: 2.8 – 3.8) and 3.9 (IQR: 3.1 – 4.3) log10 copies/ml, respectively (Table 2). Prevalence of viremia ranged from 1.8 to 33.8% across sites. Among HIV-infected participants, a site-level median 36% (IQR: 13.4 – 52.9) reported that they had taken ART in the prior 30 days.
Table 2.
Distribution of community measures of interest overall and stratified by risk-population
| MSM (n=12,022; 12 sites) |
IDU (n=14,481; 15 sites) |
Overall (n=26,503; 27 sites) |
|
|---|---|---|---|
|
| |||
| Site median (IQR) | Site median (IQR) | Site median (IQR) | |
| In-care viral load (ICVL)a (log10 copies/ml) | 2.7 (2.5 – 3.1) | 2.7 (2.5 – 3.9) | 2.7 (2.5 – 3.4) |
| Aware viral load (AVL) (log10 copies/ml) | 2.9 (2.7 – 3.4) | 3.4 (2.9 – 4.1) | 3.1 (2.8 – 3.8) |
| Population viral load (PVL) (log10 copies/ml) | 3.8 (3.1 – 4.2) | 4.0 (3.1 – 4.4) | 3.9 (3.1 – 4.3) |
| Prevalence of viremia (%) | 5.0 (4.0 – 7.7) | 14.2 (8.3 – 20.1) | 9.0 (4.4 – 15.6) |
| Proportion on ARTb (%) | 39.6 (23.2 – 52.9) | 28.2 (9.7 – 52.9) | 36.0 (13.4 – 52.9) |
IQR - interquartile range;
Including imputed values for Lucknow;
Proportion of HIV-infected participants who self-report currently taking antiretroviral therapy (ART)
Correlation with HIV incidence
AVL, PVL, and prevalence of viremia were statistically significantly correlated with HIV incidence, while ICVL was not (Table 3; Figure 1). Proportion on ART (Spearman correlation coefficient [ρ]= −0.54) was also significantly correlated with incidence. The viral load measure most strongly correlated with HIV incidence was prevalence of viremia (ρ=0.81) followed by AVL (ρ=0.59) and PVL (ρ=0.51).
Table 3.
Community measure correlations with HIV incidence and linear regression model results
| Community measure | ρ1 (95% CI; p-value) | Linear Regression
|
|||
|---|---|---|---|---|---|
| Change in HIV incidence per 1 SD increase in measure (95% CI) | R-squared | AIC/BIC | Change in community measure required to reduce HIV incidence by 1% | ||
| In-care viral load (log10 copies/ml) | 0.29 (−0.10, 0.60; 0.143) | 1.16 (0.22, 2.11) | 0.205 | 4.6/37.8 | −0.45 |
| Aware viral load (log10 copies/ml) | 0.59 (0.27, 0.79; 0.001) | 1.33 (0.42, 2.24) | 0.265 | 4.5/35.7 | −0.37 |
| Population viral load (log10 copies/ml) | 0.51 (0.16, 0.74; 0.007) | 1.19 (0.27, 2.12) | 0.220 | 4.6/37.3 | −0.49 |
| Prevalence of viremia | 0.81 (0.62, 0.91; <0.001) | 1.51 (0.70, 2.32) | 0.372 | 4.4/31.5 | −4.34 |
| Proportion on ART | −0.54 (−0.76, −0.20; 0.004) | −1.16 (−2.08, 0.23) | 0.209 | 4.6/37.7 | 19.52 |
Spearman correlation coefficient; CI - confidence interval
Figure 1.
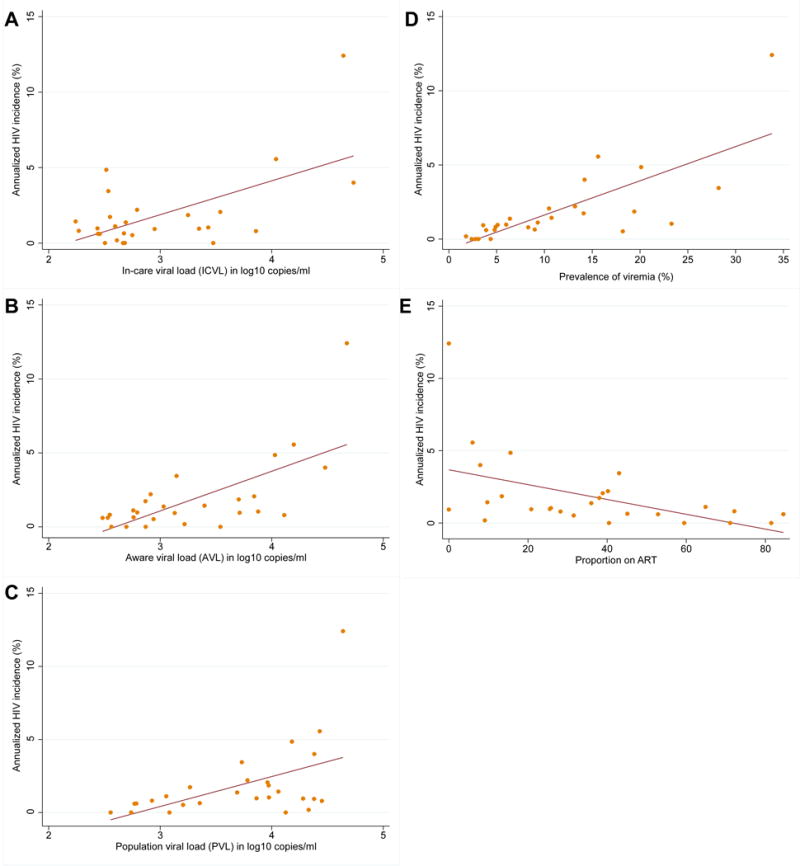
Scatterplots with fitted linear regression lines showing the associations of the various community level measures and HIV incidence among MSM and IDU in 27 sites in India (n=26,503; 27 samples). Panel A: In-care viral load (ICVL); Panel B: Aware viral load (AVL); Panel C: Population viral load (PVL); Panel D: Prevalence of viremia; Panel E: Proportion on ART
HIV incidence was statistically significantly more correlated with prevalence of viremia than with the other three community viral load measures and with proportion on ART (Table 4). Additionally, AVL was significantly more strongly correlated with HIV incidence than ICVL.
Table 4.
Statistical comparison of Spearman correlation coefficients for community-level measures and HIV incidence
| Measure | In-care viral load | Aware viral load | Population viral load | Prevalence of viremia | Proportion on ART |
|---|---|---|---|---|---|
| In-care viral load | X | 0.010 | 0.080 | 0.001 | 0.084 |
| Aware viral load | X | 0.136 | 0.029 | 0.336 | |
| Population viral load | X | 0.016 | 0.339 | ||
| Prevalence of viremia | X | 0.024 | |||
| Proportion on ART | X |
All values reported are p-values for the comparison of two correlation coefficients; p<0.05 indicates a statistically significant difference between the two correlation coefficients; ART – antiretroviral therapy
Regression analyses
Model-based estimates were standardized to reflect the change in HIV incidence per standard deviation change to facilitate direct comparison (Table 3). Prevalence of viremia demonstrated the strongest association with HIV incidence. A one standard deviation increase in prevalence of viremia was associated with a 1.51% increase in HIV incidence (95% CI: 0.70, 2.32). Metrics of discrimination (R2, AIC and BIC) further support that prevalence of viremia best discriminated communities with high and low HIV incidence. The R2 for prevalence of viremia was 0.37 implying that prevalence of viremia explained 37% of the variability in the incidence – the next highest R2 was 0.27 for AVL.
Using these model-based estimates, we estimated that in order to reduce the HIV incidence by 1%, prevalence of viremia in a community would need to be reduced by 4.34% (Table 3). Similarly, to reduce HIV incidence by 1%, ART use among HIV-infected individuals in the community would need to increase 19.5%.
Sensitivity analyses
Inferences were unchanged in sensitivity analyses. In RDS-weighted analyses, prevalence of viremia remained the most strongly correlated viral load measure with HIV incidence followed by AVL, PVL, population ART coverage and ICVL. However, the correlation between prevalence of viremia and HIV incidence was no longer statistically significantly different from the correlations of AVL, PVL, and population ART coverage with HIV incidence (Supplementary Table 4). Results did not change when alternate cutoffs for prevalence of viremia (HIV RNA>1000 copies/ml and HIV RNA>5000 copies/ml) were used. Prevalence of viremia was superior to HIV prevalence alone as a correlate of incidence (ρ=0.81 vs. ρ=0.62; p=0.001).
INTERPRETATION
The concept of community viral load - as a modifiable public health measure of the HIV care cascade and biologic driver new infections within populations - has attracted substantial attention.5–8 However, observed longitudinal correlations between community viral load and HIV incidence may be subject to ecologic fallacy because both exposure and outcome are measured at a community rather than individual-level, and rigorous empirical assessment of these measures across multiple sites is needed for corroboration.5 Moreover, several studies have used new HIV diagnoses as a surrogate of HIV incidence,7,8 although the average lag time between HIV infection and diagnosis is substantial and newly diagnosed infections can be influenced by case finding efforts. Our large, multi-city, epidemiologic survey of key populations in India provided a unique opportunity to compare the association between multiple measures of community viral load and HIV incidence. We found that prevalence of viremia was most strongly associated with HIV incidence, reinforcing the importance of incorporating not just information on viral load in infected persons but also HIV prevalence in the underlying population.
In studies to date, the most commonly cited measure of community viral load is the in-care viral load (ICVL). Compared with other measures, the data necessary to calculate ICVL may be relatively easy to obtain from administrative/surveillance databases, as has been performed in studies from San Francisco, British Columbia, and Washington DC.7,8,20 However, this construct of community viral load does not account for viral load data of HIV-infected persons who are not engaged in care – individuals who are likely both to have higher viral loads and higher HIV transmission risk behaviors.5,6 Aware viral load (AVL) and population viral load (PVL) take these individuals into account in their estimation.6 We found that the correlation of AVL and PVL with HIV incidence were stronger than that of ICVL and HIV incidence.
Conceptually, two major components determine HIV transmission in a community: (1) frequency of engaging in risk-behaviors/coming into contact with someone who is HIV infected (HIV prevalence); and (2) transmission potential of HIV-infected individual. Clinical trials and observational studies have demonstrated the rarity of HIV transmission events resulting from HIV-infected persons with very low or undetectable HIV RNA levels.1,21 We used 150 copies/ml, which was the limit of detection in our HIV RNA assay, as the cut-off for viremic individuals. Prevalence of viremia combines both HIV prevalence and individuals’ transmission potential. Settings with a high prevalence of viremia are reflective of a high probability of coming into contact with an individual who could transmit HIV infection compared to settings with a low prevalence of viremia, where transmission is less likely to occur. The other three community viral load measures, ICVL, AVL and PVL, while accounting for transmission potential do not account for the probability of coming into contact with an HIV-infected person.5 In our study, these measures were less strongly associated with HIV incidence compared with prevalence of viremia in the community. These findings are consistent with a small study of MSM from Atlanta where a higher longitudinal HIV incidence was observed in a sub-group of Black MSM where the baseline probability of coming into contact with an individual with transmission potential was higher.22
Similar to a large study from South Africa,2 we also identified an inverse association between population ART coverage and HIV incidence. However, prevalence of viremic individuals in a community was a significantly stronger predictor of HIV incidence compared with population ART coverage. This difference may reflect the imperfect correlation between ART use data and successful suppression, which could result either from misreporting or sub-optimal adherence. Interestingly, ART coverage performed similarly to other measures of CVL including aware and population VL and was actually superior to the most commonly used measure, in-care VL (ICVL). In settings where calculating prevalence of viremia is not feasible, ART coverage should be considered as another option. The ease of collection of this self-reported measure makes it an attractive alternative in resource-limited settings.
Identification of the optimal measure for program effectiveness involves not only how well it tracks with HIV incidence but its ease of implementation and measurement in resource-limited settings. On the one hand, the multi-assay algorithm used in this study to measure incidence could be considered the optimal measure; however, widespread use of this algorithm may be challenging because some tests need to be performed in real-time (e.g., CD4+ cell count) and others require laboratory infrastructure and training (e.g., BED, avidity) that may not be readily available in all settings. HIV viral load is also not always available, but the likelihood of a low-cost point-of-care viral load assay is increasing23–25 and HIV RNA can be measured using dried blood spots (DBS), which can facilitate implementation.26,27 While the lower limit of detection of DBS derived viral load is 1000 copies/ml,26,27 our sensitivity analyses demonstrated that prevalence of viremia defined as >1000 or >5000 copies/ml were just as strongly correlated with HIV incidence as a lower threshold (>150 copies/ml).
There are important limitations to consider. First, our analyses were based on cross-sectional data measured at one point in time so we cannot demonstrate a temporal relationship between community viral load and HIV incidence. Similarly, we used a cross-sectional method for estimating HIV incidence that is based on characterizing individuals with recent infections using a multi-assay algorithm and applying an empirically derived window period for detectability of recent infection. While cross-sectional estimation of HIV incidence is an evolving field, the algorithm that we used has been validated in longitudinal cohorts for subtype C,13 the primary subtype in India.17 It is worth noting that the gold-standard method of estimating incidence from cohort studies may have drawbacks as well. Risk behaviors may be affected by cohort follow-up itself (Hawthorne effect) and retention issues may lead to increasing selection biases over time. Second, we also estimated several of our measures (ICVL, AVL, ART coverage) using self-reported data on HIV status awareness, access to care, and ART use. Several studies have demonstrated that people may misrepresent their HIV and/or ART status in surveys, which could affect our estimates.28–30 Third, while a random sample of the target population might be best-suited to arrive at community-level estimates of HIV incidence, population ART coverage and the various CVL measures, recruiting a random sample of MSM or PWID is always challenging as no underlying sampling frame exists. RDS, when implemented appropriately and critical assumptions are met, should generate estimates representative of the underlying population.15,16 While it is not possible to verify all RDS assumptions (e.g., whether participants accurately report network size), our samples achieved sufficient depth and were accrued rapidly from just 2–3 seeds supporting that the assumptions of reciprocity and networking of participants were met. Further, we have previously demonstrated that homophily values for HIV prevalence and other associated factors were between 0.20 and −0.20 for the majority of sites supporting that recruitment from individuals networks was random with respect to these factors.
Our study demonstrated prevalence of viremia was the strongest correlate of HIV incidence within MSM and PWID communities, and steps should be taken to assess the longitudinal utility of this measure to monitor the regional effectiveness of test and treat programs targeted to key populations via serial cross-sectional studies. Further, prevalence of viremia should also be considered as an outcome in implementation studies of combination HIV prevention.
PANEL
Evidence before this study
We conducted PubMed searches on January 19, 2016 corresponding to the major objective of our paper, assessing the relationships between community viral load, ART coverage and HIV incidence. We used HIV Mesh terms (i.e., “HIV” or “HIV infections/transmission”) in addition to terms for community viral load (e.g., “population viral load” or “population surveillance” and “viral load”) or terms for population ART coverage (e.g., “Antiretroviral Therapy, Highly Active” Mesh term and “coverage”). This search identified a total of 112 publications. There were reports that used administrative data and cohort studies as well as review articles/perspectives that reported on the relationship between community viral load, ART coverage and HIV incidence. Administrative data from San Francisco and Washington, DC in the US, and British Columbia, Canada demonstrated an association between decreasing community viral load among HIV-infected people seeking care (in-care viral load [ICVL]) and new HIV diagnoses in the communities. Similarly, a cohort study from Vancouver among drug users demonstrated an association between decreasing community viral load enrolled in a cohort and HIV incidence in the same cohort. Only a single study from South Africa demonstrated an association between increased population ART coverage (measured using administrative data) and decreased HIV incidence. Subsequent editorials and reports including one from the Centers for Disease Control and Prevention (CDC), US have highlighted gaps in the traditionally used metrics of community viral load assessment and have called for measures that incorporate not only the viral load of HIV-infected persons who are aware of their status but also of those who are infected but unaware of their HIV status as these individuals represent a group that are not enrolled in care and hence, more likely to transmit HIV infection. Most recently, a new metric that incorporates both HIV prevalence and viral load has been suggested as overcoming some of the limitations of the traditionally used methods that do not incorporate burden of HIV infection in the community and probability of coming into contact with a HIV-infected person. Given that community viral load has been incorporated into National and International HIV/AIDS strategies as a measure of program effectiveness, it is critical that these various proposed constructs of community viral load be examined using empirical data.
Added value of this study
Our study identified at least two important findings that are critical to the monitoring of program effectiveness. First, in our study, prevalence of viremia appeared to be superior to all other metrics in predicting HIV incidence providing empirical support for what has been hypothesized by others. Unlike the other measures of community viral load, prevalence of viremia incorporates information on the HIV viral load of an individual as well as the prevalence of HIV in the community. Collectively, these represent the probability of coming into contact with an infected individual with transmission potential. The next most strongly correlated measure was population viral load, which represents the average viral load of all HIV-infected individuals in the community regardless of whether they were aware of their status or in care. Second, population ART coverage measured via self-report, though inferior to prevalence of viremia, was significantly associated with cross-sectional HIV incidence and was more strongly correlated with HIV incidence than in-care viral load, the most commonly used community viral load measure. In settings with minimal to no access to HIV RNA testing, self-reported population ART coverage can be considered as a measure of program effectiveness.
Implications of all the available evidence
Prevalence of viremia, a measure that takes into account both HIV viral load and HIV prevalence in its calculation, was the most correlated community viral load measure with HIV incidence and should be strongly considered in the measurement of program effectiveness. With advances in low-cost viral load monitoring and the potential to measure prevalence of viremia even using dried blood spots, our data support the inclusion of prevalence of viremia as a key outcome for evaluating the impact of HIV prevention and treatment interventions.
Supplementary Material
Acknowledgments
This research was supported by the National Institutes of Health, R01 MH 89266, R01 DA032059, R01 AI095068, K24 DA035684, DP2 DA040244 and the Johns Hopkins Center for AIDS Research (P30 AI094189). Additional support was provided by the Division of Intramural Research of the National Institute of Allergy and Infectious Diseases and the Elton John AIDS Foundation.
We thank the National AIDS Control Organization (NACO), India, all of our partner non-governmental organizations throughout India, who assisted with the recruitment of the study sample. Most importantly, we would like to thank our participants, without whom this research would not have been possible.
Sunil Solomon, Shruti Mehta and Gregory Lucas were responsible for the design of the study, data collection, interpretation of data and drafting the manuscript. Allison McFall was responsible for data analysis. Aylur Srikrishnan led data collection. David Celentano and Suniti Solomon were involved in the design of the study. Shanmugam Saravanan and Oliver Laeyendecker were involved in the laboratory testing procedures and interpretation of laboratory data. All authors read and approved the final manuscript. Sunil Solomon and Allison McFall had full access to all the data in the study and take responsibility for the integrity of the data and the accuracy of the data analysis.
Footnotes
Publisher's Disclaimer: This is a PDF file of an unedited manuscript that has been accepted for publication. As a service to our customers we are providing this early version of the manuscript. The manuscript will undergo copyediting, typesetting, and review of the resulting proof before it is published in its final citable form. Please note that during the production process errors may be discovered which could affect the content, and all legal disclaimers that apply to the journal pertain.
The authors have no conflicts of interest to disclose.
References
- 1.Cohen MS, Chen YQ, McCauley M, et al. Prevention of HIV-1 infection with early antiretroviral therapy. N Engl J Med. 365(6):493–505. doi: 10.1056/NEJMoa1105243. [DOI] [PMC free article] [PubMed] [Google Scholar]
- 2.Tanser F, Barnighausen T, Grapsa E, Zaidi J, Newell ML. High coverage of ART associated with decline in risk of HIV acquisition in rural KwaZulu-Natal, South Africa. Science. 2013;339(6122):966–71. doi: 10.1126/science.1228160. [DOI] [PMC free article] [PubMed] [Google Scholar]
- 3.UNAIDS. Global Report: UNAIDS Report on the Global AIDS Epidemic 2013. 2013 http://www.unaids.org/en/media/unaids/contentassets/documents/epidemiology/2013/gr2013/UNAIDS_Global_Report_2013_en.pdf (accessed November 10, 2015)
- 4.Brookmeyer R. Measuring the HIV/AIDS epidemic: approaches and challenges. Epidemiol Rev. 2010;32:26–37. doi: 10.1093/epirev/mxq002. [DOI] [PubMed] [Google Scholar]
- 5.Miller WC, Powers KA, Smith MK, Cohen MS. Community viral load as a measure for assessment of HIV treatment as prevention. The Lancet infectious diseases. 2013;13(5):459–64. doi: 10.1016/S1473-3099(12)70314-6. [DOI] [PMC free article] [PubMed] [Google Scholar]
- 6.Centers for Disease Control and Prevention. Guidance on Community Viral Load: A Family of Measures, Definitions, and Methods for Calculation. 2011 Available at: http://www.ct.gov/dph/lib/dph/aids_and_chronic/surveillance/statewide/community_viralload_guidance.pdf (accessed January 16, 2016)
- 7.Montaner JS, Lima VD, Barrios R, et al. Association of highly active antiretroviral therapy coverage, population viral load, and yearly new HIV diagnoses in British Columbia, Canada: a population-based study. Lancet. 376(9740):532–9. doi: 10.1016/S0140-6736(10)60936-1. [DOI] [PMC free article] [PubMed] [Google Scholar]
- 8.Das M, Chu PL, Santos GM, et al. Decreases in community viral load are accompanied by reductions in new HIV infections in San Francisco. Plos One. 2010;5(6):e11068. doi: 10.1371/journal.pone.0011068. [DOI] [PMC free article] [PubMed] [Google Scholar]
- 9.Wood E, Kerr T, Marshall BD, et al. Longitudinal community plasma HIV-1 RNA concentrations and incidence of HIV-1 among injecting drug users: prospective cohort study. BMJ. 2009;338:b1649. doi: 10.1136/bmj.b1649. [DOI] [PMC free article] [PubMed] [Google Scholar]
- 10.Xia Q, Wiewel EW, Torian LV. Revisiting the methodology of measuring HIV community viral load. J Acquir Immune Defic Syndr. 2013;63(2):e82–4. doi: 10.1097/QAI.0b013e318282d2a4. [DOI] [PubMed] [Google Scholar]
- 11.Solomon SS, Mehta SH, Srikrishnan AK, et al. High HIV prevalence and incidence among MSM across 12 cities in India. AIDS. 2015;29(6):723–31. doi: 10.1097/QAD.0000000000000602. [DOI] [PMC free article] [PubMed] [Google Scholar]
- 12.Lucas GM, Solomon SS, Srikrishnan AK, et al. High HIV burden among people who inject drugs in 15 Indian cities. AIDS. 2015;29(5):619–28. doi: 10.1097/QAD.0000000000000592. [DOI] [PMC free article] [PubMed] [Google Scholar]
- 13.Laeyendecker O, Kulich M, Donnell D, et al. Development of Methods for Cross-Sectional HIV Incidence Estimation in a Large, Community Randomized Trial. PLoS One. 2013;8(11):e78818. doi: 10.1371/journal.pone.0078818. [DOI] [PMC free article] [PubMed] [Google Scholar]
- 14.Solomon SS, Lucas GM, Celentano DD, Sifakis F, Mehta SH. Beyond surveillance: a role for respondent-driven sampling in implementation science. Am J Epidemiol. 2013;178(2):260–7. doi: 10.1093/aje/kws432. [DOI] [PMC free article] [PubMed] [Google Scholar]
- 15.Heckathorn DD. Respondent-driven sampling: a new approach to the study of hidden populations. Social Problems. 1997;44:174–99. [Google Scholar]
- 16.Heckathorn DD. Respondent Driven Sampling II: deriving valid population estimates from chain-referral samples of hidden populations. Social Problems. 2002;49:11–34. [Google Scholar]
- 17.Hemelaar J, Gouws E, Ghys PD, Osmanov S, Isolation W-UNfH, Characterisation Global trends in molecular epidemiology of HIV-1 during 2000–2007. AIDS. 2011;25(5):679–89. doi: 10.1097/QAD.0b013e328342ff93. [DOI] [PMC free article] [PubMed] [Google Scholar]
- 18.Steiger J. Tests for comparing elements of a correlation matrix. Psychologica Bulletin. 1980;87(2):245–51. [Google Scholar]
- 19.Volz E, Heckathorn DD. Probability based estimation theory for respondent driven sampling. J Off Stat. 2008;24:79–97. [Google Scholar]
- 20.Castel AD, Befus M, Willis S, et al. Use of the community viral load as a population-based biomarker of HIV burden. AIDS. 2012;26(3):345–53. doi: 10.1097/QAD.0b013e32834de5fe. [DOI] [PubMed] [Google Scholar]
- 21.Quinn TC, Wawer MJ, Sewankambo N, et al. Viral load and heterosexual transmission of human immunodeficiency virus type 1. Rakai Project Study Group. N Engl J Med. 2000;342(13):921–9. doi: 10.1056/NEJM200003303421303. [DOI] [PubMed] [Google Scholar]
- 22.Kelley CF, Rosenberg ES, O’Hara BM, et al. Measuring population transmission risk for HIV: an alternative metric of exposure risk in men who have sex with men (MSM) in the US. PLoS One. 2012;7(12):e53284. doi: 10.1371/journal.pone.0053284. [DOI] [PMC free article] [PubMed] [Google Scholar]
- 23.Reid SD, Fidler SJ, Cooke GS. Tracking the progress of HIV: the impact of point-of-care tests on antiretroviral therapy. Clin Epidemiol. 2013;5:387–96. doi: 10.2147/CLEP.S37069. [DOI] [PMC free article] [PubMed] [Google Scholar]
- 24.Jain V, Liegler T, Kabami J, et al. Assessment of population-based HIV RNA levels in a rural east African setting using a fingerprick-based blood collection method. Clin Infect Dis. 2013;56(4):598–605. doi: 10.1093/cid/cis881. [DOI] [PMC free article] [PubMed] [Google Scholar]
- 25.Ceffa S, Luhanga R, Andreotti M, et al. Comparison of the Cepheid GeneXpert and Abbott M2000 HIV-1 real time molecular assays for monitoring HIV-1 viral load and detecting HIV-1 infection. J Virol Methods. 2015;229:35–9. doi: 10.1016/j.jviromet.2015.12.007. [DOI] [PubMed] [Google Scholar]
- 26.Smit PW, Sollis KA, Fiscus S, et al. Systematic review of the use of dried blood spots for monitoring HIV viral load and for early infant diagnosis. PLoS One. 2014;9(3):e86461. doi: 10.1371/journal.pone.0086461. [DOI] [PMC free article] [PubMed] [Google Scholar]
- 27.Parkin NT. Measurement of HIV-1 viral load for drug resistance surveillance using dried blood spots: literature review and modeling of contribution of DNA and RNA. AIDS Rev. 2014;16(3):160–71. [PubMed] [Google Scholar]
- 28.Marzinke MA, Clarke W, Wang L, et al. Nondisclosure of HIV status in a clinical trial setting: antiretroviral drug screening can help distinguish between newly diagnosed and previously diagnosed HIV infection. Clin Infect Dis. 2014;58(1):117–20. doi: 10.1093/cid/cit672. [DOI] [PMC free article] [PubMed] [Google Scholar]
- 29.Fogel JM, Wang L, Parsons TL, et al. Undisclosed antiretroviral drug use in a multinational clinical trial (HIV Prevention Trials Network 052) J Infect Dis. 2013;208(10):1624–8. doi: 10.1093/infdis/jit390. [DOI] [PMC free article] [PubMed] [Google Scholar]
- 30.Kahle EM, Kashuba A, Baeten JM, et al. Unreported antiretroviral use by HIV-1-infected participants enrolling in a prospective research study. J Acquir Immune Defic Syndr. 2014;65(2):e90–4. doi: 10.1097/QAI.0b013e3182a2db02. [DOI] [PMC free article] [PubMed] [Google Scholar]
Associated Data
This section collects any data citations, data availability statements, or supplementary materials included in this article.