Abstract
The desire to understand normal and disordered human brain function of upright, moving persons in natural environments motivates the development of the ambulatory micro-dose brain PET imager (AMPET). An ideal system would be light weight but with high sensitivity and spatial resolution, although these requirements are often in conflict with each other. One potential approach to meet the design goals is a compact brain-only imaging device with a head-sized aperture. However, a compact geometry increases parallax error in peripheral lines of response, which increases bias and variance in region of interest (ROI) quantification. Therefore, we performed simulation studies to search for the optimal system configuration and to evaluate the potential improvement in quantification performance over existing scanners. We used the Cramér–Rao variance bound to compare the performance for ROI quantification using different scanner geometries. The results show that while a smaller ring diameter can increase photon detection sensitivity and hence reduce the variance at the center of the field of view, it can also result in higher variance in peripheral regions when the length of detector crystal is 15 mm or more. This variance can be substantially reduced by adding depth-of- interaction (DOI) measurement capability to the detector modules. Our simulation study also shows that the relative performance depends on the size of the ROI, and a large ROI favors a compact geometry even without DOI information. Based on these results, we propose a compact ‘helmet’ design using detectors with DOI capability. Monte Carlo simulations show the helmet design can achieve four-fold higher sensitivity and resolve smaller features than existing cylindrical brain PET scanners. The simulations also suggest that improving TOF timing resolution from 400 ps to 200 ps also results in noticeable improvement in image quality, indicating better timing resolution is desirable for brain imaging.
Keywords: positron emission tomography, system evaluation, brain imaging
1. Introduction
Positron emission tomography (PET) can produce three dimensional images of biochemical processes in the human body by using radioactive tracers. It has wide applications in oncology (Beyer et al 2000), cardiac imaging (Machac 2005) and brain imaging (Gunn et al 2015). With the developments of specific radiotracers, various applications of PET in neurology have been found during the past two decades, such as dopamine neurotransmitter imaging in Parkinson’s disease (Wagner et al 1983), β-amyloid (Klunk et al 2004) and tau imaging (Fodero-Tavoletti et al 2011) in Alzheimer’s disease, translocator protein (TSPO) imaging (Scarf and Kassiou 2011) related to microglial activation as an indication of brain damage. Efforts have been made to find novel radiaotracers with higher binding affinity and specificity to produce functional images with higher signal-to-noise ratio (SNR), accurately representing the activity in the brain.
Apart from developing new radiotracers, developments in PET instrumentation, system modeling and pharmacokinetics modeling are also of importance. Though PET has high specificity and sensitivity compared with other imaging modalities, the SNR of PET image is still low due to the limited resolution and low coincident-photon counts detected during a given scan time. The low SNR also limits the achievable temporal resolution in dynamic PET studies, because one has to either use long frame durations or apply temporal smoothing to reduce noise, which makes it hard to capture fast dynamic changes (Villien et al 2014). In other applications, such as imaging of multiple sclerosis using TSPO tracer [11C]PK11195, the SNR is poor also due to low brain penetration and high nonspecific binding of the tracer (Colasanti and Piccini 2014). Therefore, improving PET sensitivity is important for brain imaging. In addition, higher sensitivity allows reduction of radiation dose so that longitudinal studies, such as those employed in Alzheimer’s disease early prediction (Mosconi et al 2008), become more feasible, making the technique potentially acceptable for screening of vulnerable patient population.
One way to improve the sensitivity of PET is increasing the solid angle coverage. This can be achieved by extending the axial field of view (FOV) (Poon et al 2012). For brain imaging, it is more economical to use a compact design (Tashima et al 2013). However, a compact design also increases parallax error in peripheral lines of response, which will increase the variance in region of interest (ROI) quantification. Therefore, a careful study is required to determine the optimal design tradeoff. Another recent advancement that has been exploited in clinical PET scanners to reduce noise is time of flight (TOF) capability (Moses and Derenzo 1999, Conti et al 2005, Surti et al 2007, Karp et al 2008). TOF imaging does not increase the number of photons detected by a PET scanner, but provides more accurate localization information of the position annihilation points, which can reduce the noise amplification in the image reconstruction process. Additionally, reconstruction artifacts due to missing sectors in the angular coverage are substantially reduced (Surti and Karp 2007, Gong et al 2015a). Both approaches are being investigated for the development of an ambulatory micro-dose brain PET imager (AMPET) (Majewski et al 2011, Bauer et al 2014, Kinahan et al 2015, Gong et al 2015b). The objective of the AMPET is to understand normal and disordered human brain of upright, moving persons in natural environments. Three possible designs are illustrated in figure 1. In this study, we focus on the seated AMPET design, which does not place a hard constraint on the scanner weight. We use computer simulations to examine different scanner configurations to determine which configuration has the best performance in terms of sensitivity and resolution. The geometry of an existing dedicated brain PET scanner (Kolb et al 2012) and a clinical whole-body scanner (Jakoby et al 2011) were used for reference comparisons.
Figure 1.
The three proposed working designs for the ambulatory micro-dose brain PET imager (AMPET).
The rest of this paper is organized as follows. In section 2 we describe the methods for data simulation, image reconstruction and performance evaluation. The results are presented in section 3. Section 4 discusses some implications of our findings. Finally conclusion is drawn in section 5.
2. Methods
2.1. Simulation study of different ring geometries
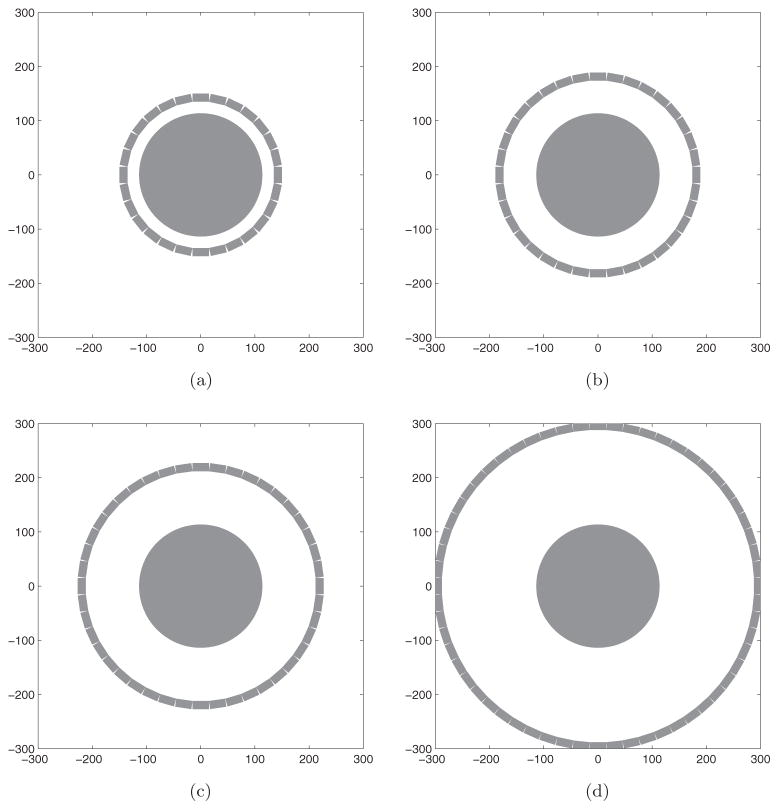
We performed a simulation study to examine the effect of a compact geometry on image quality. We simulated four single-ring scanners with different diameters. The main parameters are listed in table 1 and the scanner geometries are illustrated in figure 2. Each detector is made of an array of 12(transaxial)×1(axial) LSO crystals. The size of each crystal is 2.5×2.5×15 mm3. When modeling detector with depth-of-interaction (DOI) capability, the crystals were divided into multiple layers in the radial direction with equal length. The projection matrix P for each scanner was calculated using numerical integration of the solid angle effect with an accurate modeling of the photon penetration (Huesman et al 2000). To compare the performance of these four scanners, we computed the Cramér–Rao (CR) bound, which is the lower bound of the variance for an unbiased estimator (DeGroot and Schervish 2002). We used 2.5 mm square image pixels and an image matrix size of 101×101. The activity distribution was a uniform cylinder with diameter of 225 mm.
Table 1.
The main parameters of the simulated scanner configurations.
| Scanner | Radius (mm) | Number of detectors | Crystal length (mm) |
|---|---|---|---|
| 1 | 135 | 28 | 15 |
| 2 | 174 | 36 | 15 |
| 3 | 212 | 44 | 15 |
| 4 | 288 | 60 | 15 |
Figure 2.
Illustration of the four different scanner geometries. The FOV is fixed at 225 mm. (a) Scanner 1 (R = 135 mm). (b) Scanner 2 (R = 174 mm). (c) Scanner 3 (R = 212 mm). (d) Scanner 4 (R = 288 mm).
The Fisher information matrix was computed by
| (1) |
where ȳ = Px is the expectation of the PET data and x is the image of the uniform cylinder. The inverse of the Fisher information matrix, F−1, is the CR variance bound of an unbiased estimate of the image. Using the above configurations, the resulting Fisher information matrix for every scanner is invertible and thus provides a finite CR lower bound.
The variance of the total uptake in an ROI can be calculated by
| (2) |
where f is the ROI indicator function, whose ith element fi is equal to one if voxel i is inside the ROI, and zero otherwise (Qi and Huesman 2006). We computed the variance bound for a 2.5 mm ROI and 10 mm ROI at increasing radial positions.
2.2. Geometry of the proposed helmet PET scanner
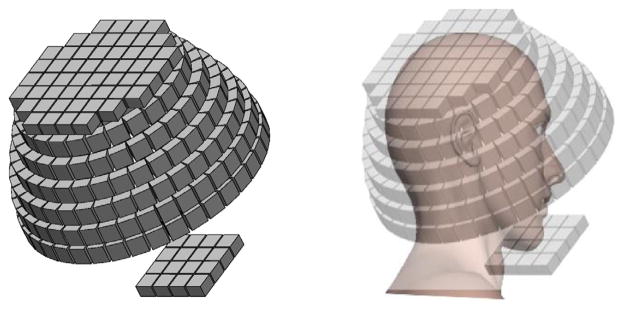
Guided by the CR bound study, we proposed a helmet scanner design with DOI detectors as shown in figure 3, which is similar to the design in (Tashima et al 2013). The helmet scanner has three components: a top panel, six side rings with varying diameters, and a bottom panel. The detector block parameters and the diameter of the bottom ring of the helmet scanner are the same as those in the Siemens brain MR-PET brain scanner (Kolb et al 2012). Parameters of the helmet scanner are listed in table 2 in comparison with those of the brain PET and mCT scanner (Jakoby et al 2011). The number of blocks and the diameter in each side ring of the helmet scanner were chosen to approximate a hemisphere. The bottom panel contains 4×4 detector blocks and the top panel contains 52 detector blocks. Distance between the bottom panel and the bottom ring is about 160 mm and the axial gap between the top panel and the top ring is 2.5 mm. GATE V6.2 (Jan et al 2004) was used for the simulations because of its flexibility in modeling irregular scanner geometries. The ‘generic repeater’ function in GATE was used to construct the helmet scanner. To cross validate our GATE simulation results, we also simulated the cylindrical brain PET and the helmet scanner with only side rings using SimSET (Harrison et al 2002).
Figure 3.
Geometry of the proposed helmet PET scanner.
Table 2.
Geometric parameters of the simulated helmet PET scanner.
| Helmet scanner | Cylindrical brain scanner | mCT | |
|---|---|---|---|
| Crystal size (mm) | 2.5×2.5×20 | 2.5×2.5×20 | 4×4×20 |
| Number of crystals per block | 12×12 | 12×12 | 13×13 |
| Number of transaxial blocks | [38, 38, 36, 33, 29, 26] | 32 | 48 |
| Ring diameter (mm) | [376.5, 366.4, 346.4, 316.8, 282.7, 248] | 376.5 | 849 |
| Number of axial blocks | 6 | 6 | 4 |
| Axial gap (mm) | 2.5 | 2.5 | 4 |
| Axial FOV (mm) | 190 | 190 | 218 |
2.3. Sensitivity evaluation
A uniform water cylinder phantom with radius 12.25 cm and 19 cm long was first simulated to compare the photon detection efficiency among different scanners. The attenuation coefficient of the cylinder material was 0.0095 mm−1. True and scattered events were simulated using both the GATE and SimSET. The overall sensitivity was calculated as the ratio between the number of detected true events and the total number of annihilations in the phantom. The spatial variation in sensitivity was also calculated for every voxel based on the source location from the root file in the GATE simulation.
In addition, we used a 3D Hoffman phantom (Hoffman et al 1990) to mimic an activity distribution in brain imaging and examined the effective sensitivity as a function of axial position. The activity ratio of the grey matter:white matter:cerebrospinal fluid (CSF) was set to 5 : 1 : 0. The attenuation image in each slice was a uniform ellipse fitted to cover the emission activity with an attenuation coefficient of 0.0095 mm−1. True events in each slice were collected based on the source location. The sensitivity in each slice was computed by dividing the number of detected true events originated in the slice by the total activity in the slice and the results were compared across different scanners. Three helmet configurations were evaluated to understand the contribution from each component of the helmet PET: helmet with only side detectors, helmet with side and top detectors, and helmet with side, top and bottom detectors.
2.4. Image variance comparison
Since sensitivity measures the overall coincident-photon detection efficiency, we also compared directly the variance in reconstructed images at matched spatial resolution. The variance and spatial resolution were estimated using the theoretical formula derived by Qi and Leahy (2000) as well as Monte Carlo reconstruction of multiple datasets. The theoretical formula allows us to study a wide range of reconstruction parameters, while Monte Carlo reconstructions provide validation for the theoretical predictions at selected points.
The reconstruction method was in the penalized likelihood framework with a quadratic penalty function:
| (3) |
where L(y|x) is the Poisson log-likelihood function, β is the regularization parameter that controls the strength of the regularization, and R is a semi-positive definite matrix. Following the previous work (Fessler and Rogers 1996), the local impulse response at pixel j can be expressed by
| (4) |
and the covariance matrix by
| (5) |
We used the peak intensity of the local impulse response, which is referred to as the contrast recovery coefficient (CRC) of a point source, to measure the spatial resolution. Using locally shift-invariant approximation and fast Fourier transform, the CRC at pixel j and the pixel variance can be quickly evaluated by Qi and Leahy (2000)
| (6) |
| (7) |
where vectors λ and μ are the Fourier transform of the image formed by the jth column of F and R, respectively. Readers are referred to (Qi and Leahy 2000) for more details.
In the Monte Carlo validation process, a 3D phantom was created by replicating one slice of the Hoffman phantom (figure 4) in the axial direction. We used a cylindrical object to reduce the variability caused by the activity distribution when evaluating the performance in different axial slices. In order to perform the Monte Carlo reconstructions within a reasonable amount of time7, the voxel size was set to 5×5×10 mm3 and the image matrix size was 49×49×19. The projection matrix P was computed using a single-ray tracing method. While we would use smaller voxels and more sophisticated projection model in practice (see next section), we expect that the relative performance between different geometries remains similar. We evaluated the system performance with and without TOF. The simulated TOF resolution was 200 ps and the time bin width was 40 ps. The resulting time window function was a convolution between a Gaussian function (FWHM = 200 ps) and a rectangular function (width = 40 ps), which is given by
Figure 4.
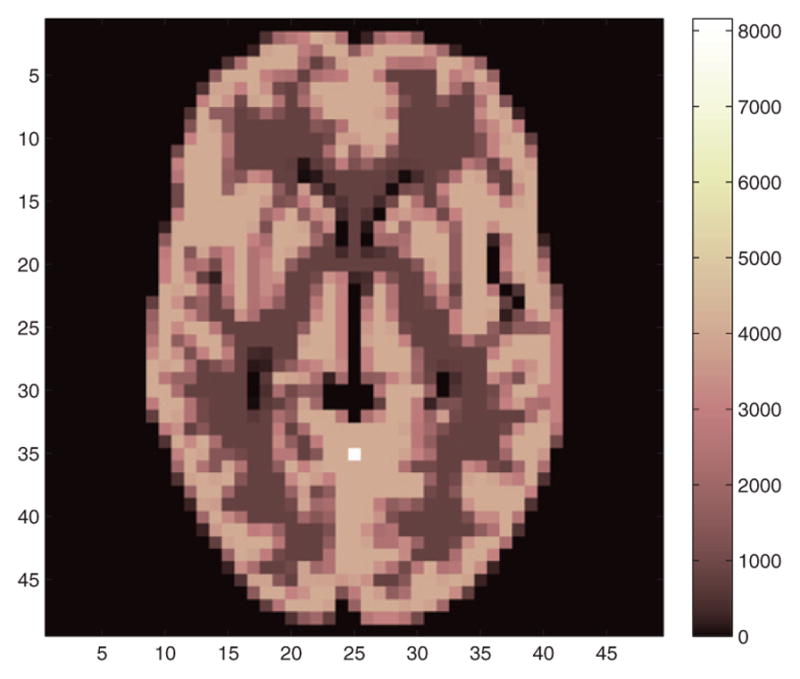
One slice of the Hoffman phantom image used in the CRC-variance evaluation. The hot spot indicates the location for CRC and variance calculation.
| (8) |
where x is the distance in mm from the voxel to the spatial center of the time bin, s=40×0.15 mm is the spatial width of the time bin, is the standard deviation of the Gaussian function, and erf(·) denotes the error function.
For data generation, a histogram was first created by forward projecting the phantom using the projection matrix, and then 200 independent and identically distributed (i.i.d) realizations were generated by introducing Poisson noise to the histogram. For CRC calculation, a single-voxel source with a contrast of 2 was added to the phantom at a radial offset of 5 cm from the center (see the hot spot in figure 4). Each data set was reconstructed independently using a maximum a posteriori-expectation maximization (MAP-EM) algorithm (De Pierro 1994) with 200 iterations and three different β values.
2.5. Image quality comparison via list-mode reconstruction
For image quality evaluation, GATE simulations were used to generate list mode data of the 3D Hoffman brain phantom and a mini Derenzo phantom. The tracer was Fluorine-18. Since the Hoffman phantom has only 19 slices, the image matrix size was set to 196×196×19 with a voxel size of 1.25×1.25×10 mm3 in both cases. List-mode reconstruction was used for the helmet reconstruction because of the large number of lines of response and lack of symmetry for storing a pre-computed projection matrix. Single-ray tracing method (Siddon 1985) is often preferred for on-the-fly calculations due to its fast speed and simple implementation, but it does not account for the parallax error caused by photon penetration. To model the detector response, image-domain point spread function (PSF) can be used in conjunction with the single-ray tracing method (Zhou and Qi 2011). However due to the lack of rotational symmetry of the helmet scanner, it requires measuring the PSF for a huge number of voxels, which is very difficult. Hence we adopted an on-the-fly multi-ray tracing method (Huesman et al 2000) with a crystal division of 2 (transaxial)×1 (axial)×6 (radial) to model the solid angle and crystal penetration effect. The axial division was set to 1 because the image voxel size in the axial direction is larger than the detector crystal size. For DOI detectors, three crystal layers were simulated. The division for each crystal layer was 2×1×2 to match that for the non-DOI detector. All list-mode data were reconstructed using an ordered subset expectation maximization (OSEM) algorithm with 10 subsets and 2 iterations.
3. Results
3.1. Simulation of four different geometries
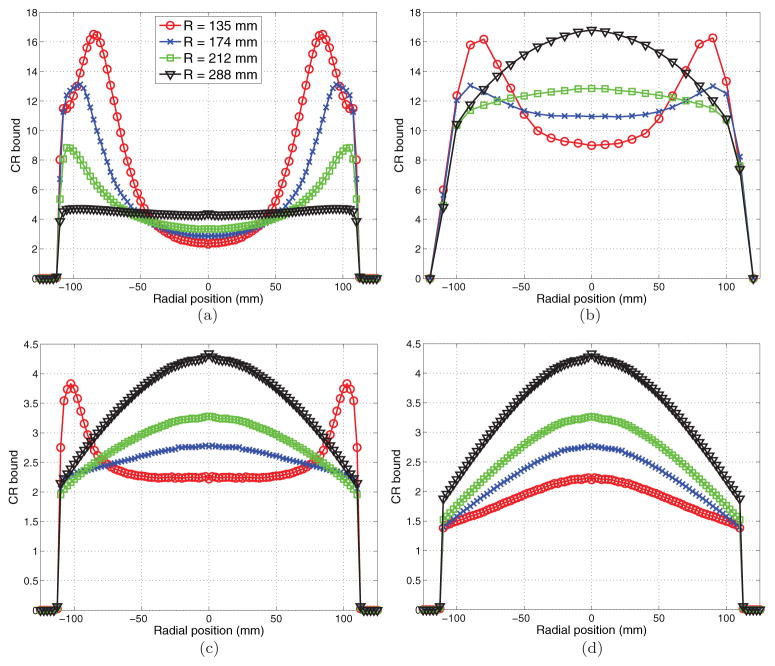
Figure 5 compares the CR bound for the four scanners with different ring diameters. As expected, a more compact geometry can improve photon detection sensitivity and reduce variance of ROI quantification at the center of the field of view. However, it also results in higher variance near the edge of the scanner without DOI information and the effect is more pronounced for the smaller ROI (figure 5(a)). Note that when there is no DOI, the ROI variance at large radial offsets in the most compact geometry is almost the same for 2.5 mm ROI and 10 mm ROI because the neighboring pixels are highly correlated. Using crystals longer than 15 mm in a compact geometry increases the variance in the peripheral regions even further. This indicates that without DOI measurement, a compact geometry is not suitable for quantifying uptake in small peripheral regions (e.g. cortical surface). When the scanners are equipped with DOI detectors, a compact scanner can outperform a large scanner (figures 5(c) and (d)) and thus reducing the material cost and weight. Comparing the plots in figures 5(c) and (d), we can see that higher DOI resolution has a minimal effect on the largest scanner (scanner 4, R = 288 mm), but is more critical for the most compact scanner (scanner 1, R = 135 mm).
Figure 5.
Plots of the CR variance bounds for ROI quantification at different radial positions. (a) 2.5 mm ROI without DOI measurements. (b) 10 mm ROI without DOI measurements. (c) 2.5 mm ROI with 2-layer DOI. (d) 2.5 mm ROI with 3-layer DOI. Curve with circles denotes R = 135 mm; curve with crosses denotes R = 174 mm; curve with boxes denotes for R = 212 mm; curve with triangles denotes R = 288 mm.
3.2. Sensitivity comparison
For the cylinder phantom simulation, the sensitivity comparisons between the GATE and SimSET for true events are shown in table 3. The difference between the GATE and SimSET results are within 2–3%. The results show that the sensitivity of the full helmet scanner is about 4.2 times that of the cylindrical brain PET, and 5.4 times that of the mCT scanner. The helmet PET with only side rings has a sensitivity improvement of 73% over the cylindrical brain PET. Comparing the brain PET with the mCT scanner, the brain PET has 30% higher sensitivity even though the diameter of the mCT scanner is about twice that of the brain PET. The improvement factor is less than two because the mCT has a longer axial FOV and smaller gaps in each ring.
Table 3.
True coincidence sensitivity comparison.
| Model | mCT scanner (%) | Cylinder brain PET (%) | Helmet (side only) (%) | Helmet (%) |
|---|---|---|---|---|
| SimSET | (0.6692±0.0002) | (0.8705±0.0002) | (1.5072±0.0002) | |
| GATE | (0.6610±0.0092) | (0.8554±0.0105) | (1.4813±0.0138) | (3.5830±0.0214) |
Note: GATE results have greater uncertainty because fewer number of events were simulated.
Table 4 compares the scatter fractions for all simulated scanners. The values for the mCT and the cylindrical brain PET are very close to those reported in the literature, 33.2±0.7% for the mCT (Jakoby et al 2011) and 38% for the Siemens brain PET (Kolb et al 2012). The cylindrical brain PET and helmet with only side rings have higher scatter fractions than the mCT scanner because of their larger solid angle coverage in the axial direction. Adding the top and bottom panel reduces the scatter fraction in the helmet scanner because a large number of lines of response formed by the top panel with side detectors are short in length and thus have lower-than-average scatter fractions.
Table 4.
Scatter fraction comparison.
| Model | mCT scanner (%) | Cylinder brain PET (%) | Helmet (side only)(%) | Helmet (%) |
|---|---|---|---|---|
| SimSET | 31.7 | 37.4 | 37.4 | |
| GATE | 31.1 | 37.0 | 36.9 | 31.2 |
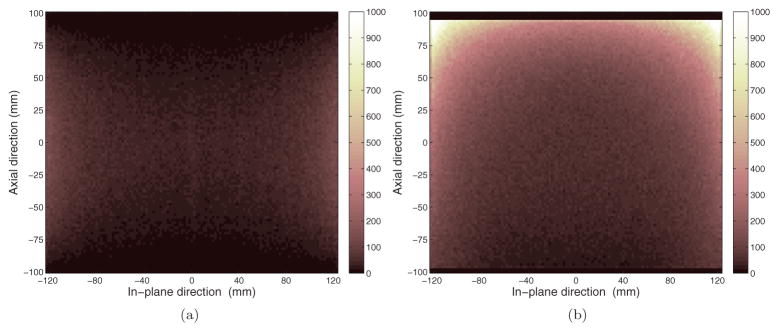
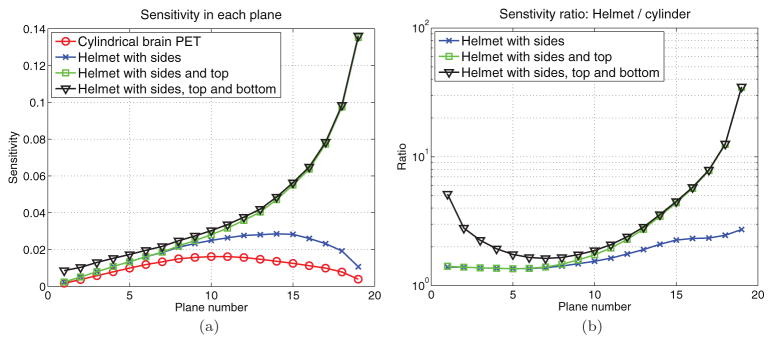
To visualize the spatial variant sensitivity, figure 6 shows a sagittal view of the sensitivity image for the cylinder brain PET and the helmet scanner. We can see that the helmet scanner substantially increases the sensitivity in the upper FOV; however, the largest improvements occur near the peripheral regions that may be less valuable in practice. To further examine the sensitivity improvement for brain imaging, we computed the sensitivity for each axial slice (19 slices in total) using the Hoffman phantom simulation data. The results are plotted in figure 7(a) for four different scanners: the cylindrical brain PET, helmet with only side detectors, helmet with side and top detectors, and the full helmet. The ratios between these scanners with respect to the cylindrical brain PET are plotted in figure 7(b). The results show that the maximum improvement is near the top FOV with the maximum sensitivity ratio between the full helmet and the cylindrical PET being 35, while the minimum improvement is near the lower middle FOV (planes 7–8) with a sensitivity ratio of 1.6. The bottom panel mainly improves the sensitivity in the lower FOV (planes 1–5), while the top panel mainly increases the sensitivity in the upper FOV (planes 13–19). Therefore, if we are interested only in the top part of the brain, the bottom panel is not needed; if we care about the lower part of the brain, such as the cerebellum and the hippocampus, then bottom panel can help to improve the sensitivity.
Figure 6.
Sagittal slice of the sensitivity images for the cylindrical brain scanner (a) and the helmet scanner (b).
Figure 7.
(a) Sensitivity for each image plane. (b) The sensitivity ratio between different helmet configurations and the cylindrical brain scanner. Plane 1 is at the bottom and plane 19 is at the top of the Hoffman phantom.
3.3. Image variance comparison
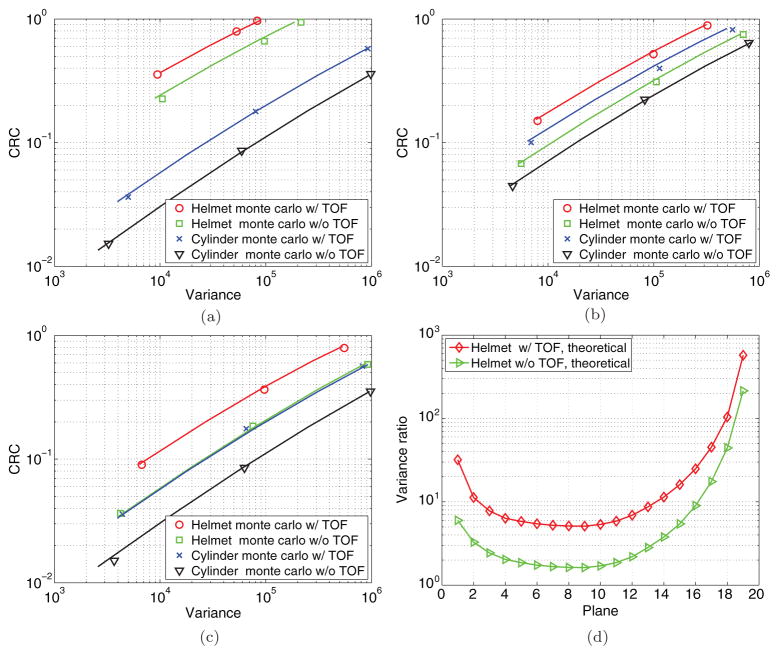
Figures 8(a)–(c) show the theoretical predicted CRC-variance curves and the Monte Carlo results for three axial slices (top, center, and bottom). The curves are plotted on a log–log scale to show the variance reduction over a large range of CRC (a measure of spatial resolution). For all locations and all three β values, the Monte Carlo results match the theoretical predictions very well. The fact that the CRC-variance curves in each plot are almost parallel to each other in the log–log scale indicates that the variance reduction factor is nearly independent of CRC. Therefore, we used the theoretical results to calculate the variance reduction ratio (cylindrical brain PET/helmet PET) at a fixed CRC value of 0.2 and plotted the results in figure 8(d). We can see that the variance reduction is the greatest in the top planes and is the lowest near plane 8, which is consistent with the sensitivity ratio plot in figure 7. Adding 200 ps TOF information provides relatively uniform improvement across all axial slices. The very top planes (planes 16–19) have a slightly less TOF benefit because the LORs formed between the top panel and side detectors are shorter in length than those formed between the side detectors and TOF gain in each LOR is nearly proportional to the length of the LOR.
Figure 8.
The theoretical predicted CRC-variance curves (solid lines) and Monte Carlo results for the cylindrical brain PET and helmet PET with and without TOF. (a) Top, plane 18. (b) Middle, plane 10. (c) Bottom, plane 2. (d) The theoretical predicted variance ratio between the cylindrical brain PET and helmet PET when CRC = 0.2.
3.4. Hoffman phantom tests
For the hoffman phantom data, the total simulated activity was 1.6e9 annihilations, which resulted in 18 million detected true events for the cylindrical brain scanner and 46 million events for the helmet scanner. The count level is comparable to a 10 min scan of a patient with 5 mCi injection in terms of the noise equivalent counts. Figure 9 compares the reconstructed images using the single-ray tracing projector and multi-ray tracing projector for both the cylindrical brain PET and the helmet PET. The multi-ray tracing projector reduces image noise and reveals more structure details and the improvements are more pronounced for the cylindrical brain PET. Based on these results, the multi-ray tracing projector was used for all reconstructions hereinafter.
Figure 9.
Reconstructed images (plane 15) using the single-ray tracing projector and multi-ray tracing projector. (a) Cylindrical brain PET with single-ray tracing. (b) Cylindrical brain PET with multi-ray tracing. (c) Helmet PET with single-ray tracing. (b) Helmet brain PET with multi-ray tracing.
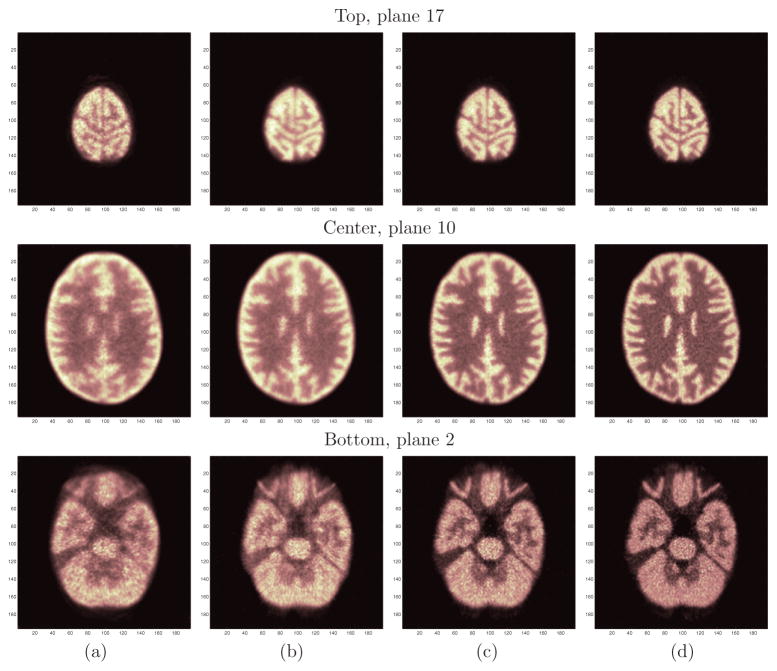
Figures 10(a) and (b) compare three representative (top, middle and bottom) slices of the Hoffman phantom reconstructions for the cylindrical brain PET and the helmet PET using the multi-ray tracing projector. In general, the helmet PET produces images with higher contrast and lower noise than the cylindrical brain PET. The most obvious improvement is in the top planes which have far less noise. This is consistent with the sensitivity improvement discussed earlier. In addition, we investigated the effect of TOF on the image quality. Figures 10(c) and (d) show the reconstructed images of the helmet PET with 400 ps TOF resolution and 200 ps TOF resolution, respectively. We see that TOF information further improves the image resolution and reduces noise with the same number of OSEM iterations. Improving timing resolution from 400 ps to 200 ps also results in noticeable improvement in image quality, indicating better timing resolution is desirable for brain imaging.
Figure 10.
The top (first row), center (second row) and bottom (third row) slices of the reconstructed Hoffman phantom images. (a) Cylinder brain PET. (b) Helmet PET without TOF. (c) Helmet PET with 400 ps TOF. (d) Helmet PET with 200 ps TOF. Images were reconstructed using OSEM with 10 subsets and 2 iterations.
3.5. Derenzo phantom tests
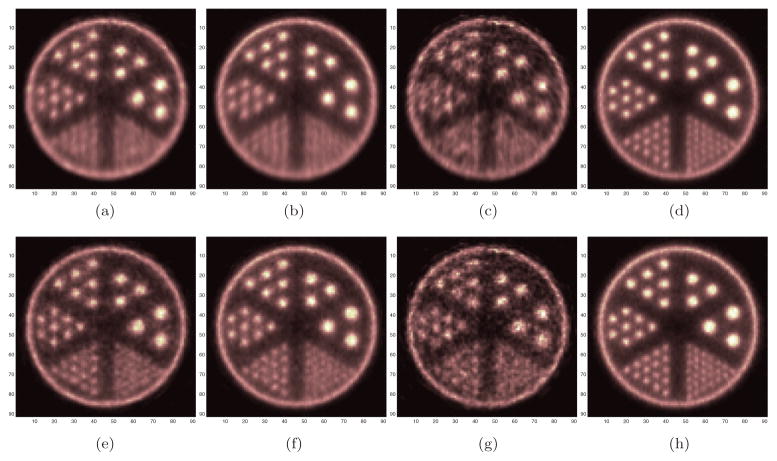
The number of detected true events for the cylindrical brain scanner was 3.3 million and for the helmet scanner was 10.1 million. The reconstructed Derenzo phantom images are shown in figure 11. We compared one center slice and one top slice between the cylindrical brain PET and helmet PET. For the center slice, the helmet PET has a similar spatial resolution to the cylindrical brain PET, but with lower noise. Neither scanner can resolve the smallest rods because of the parallax error at the radially off-center location. For the top slice, the helmet PET has much better resolution and one can resolve the smallest rods. The improved resolution in the top slice is partly because the LORs formed by the top panel and the side blocks do not suffer as much parallax error in the radial direction as the LORs formed by detectors in the side rings and as a result, the radial resolution in the top planes is improved. Figures 11(e)–(h) show the reconstructed images with 3-layer DOI. Vertical profiles through the smallest rods are plotted in figure 12 with the ground truth. The added DOI information improves the spatial resolution of both scanners. However, the images from cylindrical brain PET appear to be limited by noise and cannot take full advantage of the higher resolution offered by the DOI detectors. In comparison, the images from the helmet scanner are much clearer with far less noise. This also illustrates the importance of high sensitivity in achieving high-resolution PET imaging.
Figure 11.
The reconstructed Derenzo phantom images without DOI (top row) and with DOI (bottom row) information. (a), (e) Center slice of the cylindrical brain PET. (b), (f) center slice of the helmet PET. (c), (g) Top slice of the cylindrical brain PET. (d), (h) Top slice of the helmet PET. The center of the Derenzo phantom is 6 cm away from the radial center. The smallest rods are 2.7 mm in diameter. Three layers of crystal arrays were used in the DOI cases.
Figure 12.
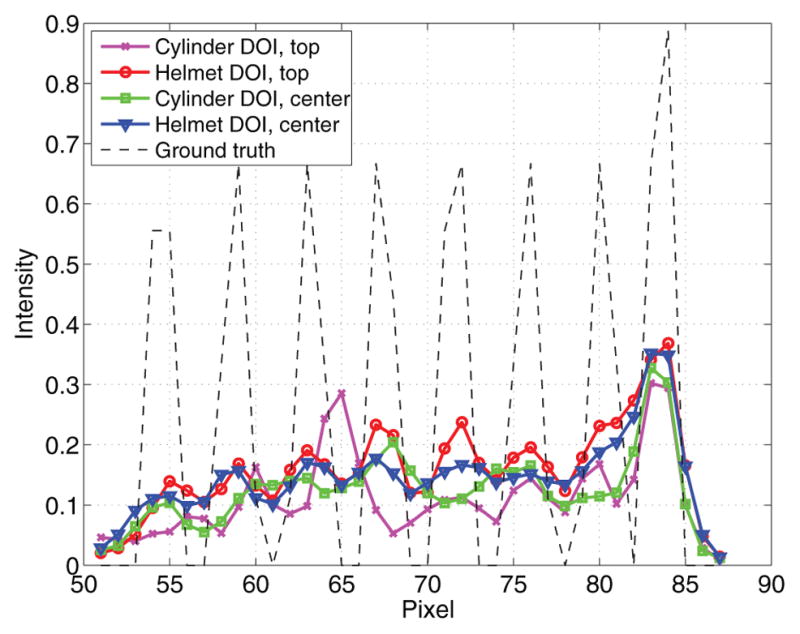
Vertical profiles through the smallest rods in the reconstructed images with DOI. The dashed line denotes the ground truth.
4. Discussion
From the CR bound comparison, we know that DOI is critical for small ROI quantification with a compact PET scanner. Without DOI, the compact PET may result in higher variance even though it has higher sensitivity, because spatial resolution is a limiting factor for imaging a small ROI. For a ROI that is larger than the spatial resolution, the performance is more determined by the sensitivity. Therefore, the most cost-effective design can be highly dependent on the specific application (small lesion imaging versus pattern imaging) and sizes of the regions of interest.
Our simulation studies show that the helmet PET has about 4.2 × sensitivity compared with the cylindrical brain PET. From the slice sensitivity comparison shown in figure 7, we know that the bottom panel mainly improves the sensitivity in the lower FOV and the top panel mainly improves the sensitivity in the upper FOV. To put this into context, we estimated the distances from the skull to some targets of interest based on a MRI image. If the helmet PET is tilted by 45 degree, the distance from the skull to the corpus callosum is about 7.5 cm and the distance from the skull to the hypothalamus is about 12 cm. Matching these distances to figure 7, they are mapped to plane 13 and plane 7, respectively. Therefore, the bottom panel is not needed for the corpus callosum, but can increase the sensitivity for the hypothalamus region.
In the CRC-variance study we found that for a given β value, the helmet scanner always achieves a higher contrast than the cylindrical brain PET. However, the relationship between the variances of the two scanners is not consistent. In the cases with the largest β, the helmet scanner also produces higher variance than the cylindrical brain PET. However, at a matched CRC value, the variance ratio is nearly independent of the β value. This underscores the point that when comparing penalized likelihood reconstructions from different scanners, we need to adjust the regularization parameter to match the resolution before computing the variance reduction factor; otherwise, the result may not be meaningful.
5. Conclusion
We have performed simulation studies to evaluate the expected performance of a helmet PET scanner for brain imaging. Our study shows that the helmet geometry can improve the overall sensitivity by a factor of 4.2 compared with the Siemens brain PET geometry and by a factor of 5.4 compared with the whole-body mCT scanner. Reconstructed phantom images demonstrated the improvement in image quality as a result of the higher sensitivity of the helmet scanner. Adding DOI and TOF information further improved the image contrast and reduced noise. Future work will examine the performance of the helmet PET for specific applications in brain imaging.
Acknowledgments
This work was supported by the National Institutes of Health under grants R24 MH106057, R01 CA164371, R01 CA042593 and R01 EB00194. The authors would like to thank Verna Lim of Vida Studios for creating the graphic in figure 1.
Footnotes
Using the settings described here, the total computation time to complete the Monte Carlo reconstructions was about 822 h on one Dell R720 server with dual 8-core Intel Xeon E5-2650 CPUs.
References
- Bauer C, Brefczynski-Lewis J, Lewis JW, Mandich MB, Majewski S. A novel upright low-dose brain imager: a new tool in neuroscience and its potential applications. Soc Neurosci. 2014;658:13/VV16. [Google Scholar]
- Beyer T, et al. A combined PET/CT scanner for clinical oncology. J Nucl Med. 2000;41:1369–79. [PubMed] [Google Scholar]
- Colasanti A, Piccini P. PET and SPECT in Neurology. New York: Springer; 2014. pp. 757–73. [Google Scholar]
- Conti M, Bendriem B, Casey M, Chen M, Kehren F, Michel C, Panin V. First experimental results of time-of-flight reconstruction on an LSO PET scanner. Phys Med Biol. 2005;50:4507. doi: 10.1088/0031-9155/50/19/006. [DOI] [PubMed] [Google Scholar]
- DeGroot MH, Schervish MJ. Probability and Statistics. Reading, MA: Addison Wesley; 2002. [Google Scholar]
- De Pierro AR. A modified expectation maximization algorithm for penalized likelihood estimation in emission tomography. IEEE Trans Med Imaging. 1994;14:132–7. doi: 10.1109/42.370409. [DOI] [PubMed] [Google Scholar]
- Fessler J, Rogers WL. Spatial resolution properties of penalized-likelihood image reconstruction: space-invariant tomographs. IEEE Trans Image Process. 1996;5:1346–58. doi: 10.1109/83.535846. [DOI] [PubMed] [Google Scholar]
- Fodero-Tavoletti MT, et al. 18F-THK523: a novel in vivo tau imaging ligand for Alzheimers disease. Brain. 2011;134:1089–100. doi: 10.1093/brain/awr038. [DOI] [PubMed] [Google Scholar]
- Gong K, Majewski S, Kinahan PE, Harrison R, Elston B, Manjeshwar R, Dolinsky S, Stolin A, Brefczynski-Lewis J, Jinyi Q. Simulation study for designing a compact brain PET scanner. IEEE Nuclear Science Symp. and Medical Imaging Conf. Record; 2015b. pp. 1–3. [Google Scholar]
- Gong K, Wu Y, Daghighian F, Qi J. Study of a novel-geometry PET scanner. Int. Meeting on Fully Three-Dimensional Image Reconstruction in Radiology and Nuclear Medicine; Newport, RI. 2015a. pp. 562–5. [Google Scholar]
- Gunn RN, Slifstein M, Searle GE, Price JC. Quantitative imaging of protein targets in the human brain with PET. Phys Med Biol. 2015;60:R363. doi: 10.1088/0031-9155/60/22/R363. [DOI] [PubMed] [Google Scholar]
- Harrison RL, Dhavala S, Kumar PN, Shao Y, Manjersshwar R, Lewellen TK, Jansen FP. Acceleration of SimSET photon history generation. IEEE Nuclear Science Symp. Conf. Record; 2002. pp. 1835–8. [Google Scholar]
- Hoffman E, Cutler P, Digby W, Mazziotta J. 3D phantom to simulate cerebral blood flow and metabolic images for PET. IEEE Trans Nucl Sci. 1990;37:616–20. [Google Scholar]
- Huesman RH, Klein GJ, Moses WW, Qi J, Reutter BW, Virador PR. List-mode maximum-likelihood reconstruction applied to positron emission mammography (PEM) with irregular sampling. IEEE Trans Med Imaging. 2000;19:532–7. doi: 10.1109/42.870263. [DOI] [PubMed] [Google Scholar]
- Jakoby B, Bercier Y, Conti M, Casey M, Bendriem B, Townsend D. Physical and clinical performance of the mCT time-of-flight PET/CT scanner. Phys Med Biol. 2011;56:2375. doi: 10.1088/0031-9155/56/8/004. [DOI] [PubMed] [Google Scholar]
- Jan S, et al. GATE: a simulation toolkit for PET and SPECT. Phys Med Biol. 2004;49:4543. doi: 10.1088/0031-9155/49/19/007. [DOI] [PMC free article] [PubMed] [Google Scholar]
- Karp JS, Surti S, Daube-Witherspoon ME, Muehllehner G. Benefit of time-of-flight in PET: experimental and clinical results. J Nucl Med. 2008;49:462–70. doi: 10.2967/jnumed.107.044834. [DOI] [PMC free article] [PubMed] [Google Scholar]
- Kinahan PE, Majewski S, Elston B, Harrison R, Qi J, Manjeshwar R, Dolinsky S, Stolin A, Brefczynski-Lewis J. Design considerations for AMPET: the ambulatory micro-dose, wearable PET brain imager. J Nucl Med. 2015;56(suppl 3):1540. [Google Scholar]
- Klunk WE, et al. Imaging brain amyloid in Alzheimer’s disease with Pittsburgh compound-B. Ann Neurol. 2004;55:306–19. doi: 10.1002/ana.20009. [DOI] [PubMed] [Google Scholar]
- Kolb A, et al. Technical performance evaluation of a human brain PET/MRI system. Eur Radiol. 2012;22:1776–88. doi: 10.1007/s00330-012-2415-4. [DOI] [PubMed] [Google Scholar]
- Machac J. Cardiac positron emission tomography imaging. Semin Nucl Med. 2005;35:17–36. doi: 10.1053/j.semnuclmed.2004.09.002. [DOI] [PubMed] [Google Scholar]
- Majewski S, et al. HelmetPET: a silicon photomultiplier based wearable brain imager. IEEE Nuclear Science Symp. and Medical Imaging Conf; 2011. pp. 4030–4. [Google Scholar]
- Mosconi L, De Santi S, Li J, Tsui WH, Li Y, Boppana M, Laska E, Rusinek H, de Leon MJ. Hippocampal hypometabolism predicts cognitive decline from normal aging. Neurobiol Aging. 2008;29:676–92. doi: 10.1016/j.neurobiolaging.2006.12.008. [DOI] [PMC free article] [PubMed] [Google Scholar]
- Moses WW, Derenzo S. Prospects for time-of-flight PET using LSO scintillator. IEEE Trans Nucl Sci. 1999;46:474–8. [Google Scholar]
- Poon JK, Dahlbom ML, Moses WW, Balakrishnan K, Wang W, Cherry SR, Badawi RD. Optimal whole-body PET scanner configurations for different volumes of LSO scintillator: a simulation study. Phys Med Biol. 2012;57:4077. doi: 10.1088/0031-9155/57/13/4077. [DOI] [PMC free article] [PubMed] [Google Scholar]
- Qi J, Huesman RH. Theoretical study of penalized-likelihood image reconstruction for region of interest quantification. IEEE Trans Med Imaging. 2006;25:640–8. doi: 10.1109/TMI.2006.873223. [DOI] [PubMed] [Google Scholar]
- Qi J, Leahy RM. Resolution and noise properties of MAP reconstruction for fully 3d PET. IEEE Trans Med Imaging. 2000;19:493–506. doi: 10.1109/42.870259. [DOI] [PubMed] [Google Scholar]
- Scarf AM, Kassiou M. The translocator protein. J Nucl Med. 2011;52:677–80. doi: 10.2967/jnumed.110.086629. [DOI] [PubMed] [Google Scholar]
- Siddon RL. Fast calculation of the exact radiological path for a three-dimensional CT array. Med Phys. 1985;12:252–5. doi: 10.1118/1.595715. [DOI] [PubMed] [Google Scholar]
- Surti S, Karp JS. Design considerations for a limited-angle, dedicated breast, TOF PET scanner. IEEE Nuclear Science Symp. and Medical Imaging Conf. Record; 2007. pp. 3667–72. [DOI] [PMC free article] [PubMed] [Google Scholar]
- Surti S, Kuhn A, Werner ME, Perkins AE, Kolthammer J, Karp JS. Performance of Philips Gemini TF PET/CT scanner with special consideration for its time-of-flight imaging capabilities. J Nucl Med. 2007;48:471–80. [PubMed] [Google Scholar]
- Tashima H, Ito H, Yamaya T. A proposed helmet-PET with a jaw detector enabling high-sensitivity brain imaging. IEEE Nuclear Science Symp. and Medical Imaging Conf. Record; 2013. pp. 1–3. [Google Scholar]
- Villien M, et al. Dynamic functional imaging of brain glucose utilization using fPET-FDG. Neuroimage. 2014;100:192–9. doi: 10.1016/j.neuroimage.2014.06.025. [DOI] [PMC free article] [PubMed] [Google Scholar]
- Wagner HN, et al. Imaging dopamine receptors in the human brain by positron tomography. Science. 1983;221:1264–6. doi: 10.1126/science.6604315. [DOI] [PubMed] [Google Scholar]
- Zhou J, Qi J. Fast and efficient fully 3D PET image reconstruction using sparse system matrix factorization with GPU acceleration. Phys Med Biol. 2011;56:6739. doi: 10.1088/0031-9155/56/20/015. [DOI] [PMC free article] [PubMed] [Google Scholar]


