Abstract
Study Objectives:
Our study aims to explore the associations between outdoor nighttime lights (ONL) and sleep patterns in the human population.
Methods:
Cross-sectional telephone study of a representative sample of the general US population age 18 y or older. 19,136 noninstitutionalized individuals (participation rate: 83.2%) were interviewed by telephone. The Sleep-EVAL expert system administered questions on life and sleeping habits; health; sleep, mental and organic disorders (Diagnostic and Statistical Manual of Mental Disorders, Fourth Edition, Text Revision; International Classification of Sleep Disorders, Second Edition; International Classification of Diseases, 10th Edition). Individuals were geolocated by longitude and latitude. Outdoor nighttime light measurements were obtained from the Defense Meteorological Satellite Program's Operational Linescan System (DMSP/OLS), with nighttime passes taking place between 19:30 and 22:30 local time. Light data were correlated precisely to the geolocation of each participant of the general population sample.
Results:
Living in areas with greater ONL was associated with delayed bedtime (P < 0.0001) and wake up time (P < 0.0001), shorter sleep duration (P < 0.01), and increased daytime sleepiness (P < 0.0001). Living in areas with greater ONL also increased the dissatisfaction with sleep quantity and quality (P < 0.0001) and the likelihood of having a diagnostic profile congruent with a circadian rhythm disorder (P < 0.0001).
Conclusions:
Although they improve the overall safety of people and traffic, nighttime lights in our streets and cities are clearly linked with modifications in human sleep behaviors and also impinge on the daytime functioning of individuals living in areas with greater ONL.
Citation:
Ohayon MM, Milesi C. Artificial outdoor nighttime lights associate with altered sleep behavior in the american general population. SLEEP 2016;39(6):1311–1320.
Keywords: circadian rhythms, outdoor lights, sleep duration, sleepiness, sleep-wake schedule
Significance.
The aim of this study was to quantify the relationship between the intensity of artificial Outdoor Nighttime Lights, the sleep wake schedule and the sleep disturbances in the general population of the United States. We found that Outdoor Nighttime Lights clearly impact human sleep and have consequences also on the daytime functioning of human beings.
INTRODUCTION
The introduction of electric lights at the start of the 20th century was the beginning of a revolution in the urbanized world. With electric lights, humans have modified the spectrum, the intensity and timing of their light exposure compared to the conditions under which they have evolved over the course of several thousand years since the first large human settlements were established.
Since the early 1970s, nighttime light emissions have been measured by the Defense Meteorological Satellite Program's Operational Linescan System (DMSP/OLS), which recorded nighttime light data on earth. In a nonurban environment, away from artificial lights, night light levels range from approximately 1 × 10⁻⁴ lux in typical moonlight to 0.1–0.3 lux during the week around the full moon.1 The artificial light of a common street light is approximately 5 lux and a parking lot light in a shopping mall is approximately 20 lux.
Physiologically, light exposure plays a fundamental biological role entraining the circadian clock. It does this in a way that promotes physical activity and energy intake during the day and sleep and related processes at night.2 This disruption bears important consequences on a number of circadian rhythms that regulate our physiology and overall health. Light entrains the suprachiasmatic nucleus (SCN), regulating the secretion of melatonin, which naturally increases during darkness and decreases during exposure to light (or daytime light).3 In patients with primary sleep disorders, melatonin has been demonstrated to decrease sleep onset latency, increase total sleep time, and improve overall sleep quality.4
Laboratory studies have shown that exposure to a polychromatic white light intensity as small as 100 lux can depress melatonin secretion, delay the internal biological rhythm, and reduce sleepiness at bedtime.5,6 It is therefore possible that exposure to greater outdoor nighttime lights (ONL) may significantly delay the increase in melatonin secretion and consequently delay sleep. Most of the US population lives in urbanized areas, exposed to high levels of ONL, but the effects of this exposure on sleep have yet to be evaluated in nonlaboratory conditions.
In this study, we examine the effects of living in areas with greater ONL on the sleep habits of a sample representative of the US adult population. More specifically, the study aims to assess the relationship between ONL of different intensities and the sleep/wake schedule and sleep disturbances.
METHODS
Nighttime Light Emissions Recorded by Satellites
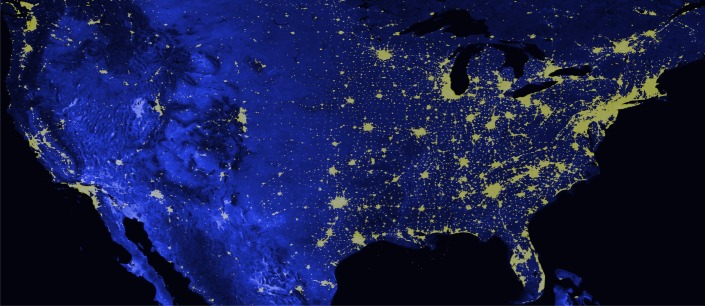
DMSP/OLS sensors were used to map nighttime light emissions from the Earth's surface. We used the DMSP global radiance calibrated nighttime lights7 product for the year closest to the interview; an example is shown in Figure 1. The OLS sensor is an oscillating scan radiometer that acquires global imageries four times a day in two broad spectral bands, namely the visible-near infrared (VIS) and thermal infrared (TIR) bands. The VIS band is a panchromatic band that extends between 0.5 and 0.9 μm (visible to near-infrared), which is intensified at night by means of a photomultiplier tube (PMT) allowing the detection of very low intensity lights, with radiance emissions as low as 10−9 watts/cm2/sr.8,9 Along with city lights, the OLS sensor also detects gas flares, lightning, lightning-illuminated clouds and aerosols, fires, fishing boats, bioluminescence, and auroras.
Figure 1.
Distribution of nighttime radiance calibrated lights. Distribution of the nighttime radiance calibrated lights composited from Defense Meteorological Satellite Program's Operational Linescan System acquisitions collected during the periods when the interviews were conducted.
The DMSP nighttime passes take place between 19:30 and 22:30 local time, depending on the mission. The data collected by the OLS sensor have a 6-bit quantization, with digital numbers ranging between 1 and 63. The 6-bit quantization greatly limits the dynamic range of the data, which tend to saturate over most bright city centers. The OLS acquires data on a daily basis but not all acquisitions are included in the nighttime ONL product. The OLS measurements are all carefully analyzed and excluded from the nighttime lights products when the images are taken in the presence of daylight, twilight, and moonlight, in addition to stray light, fires, etc., so as to avoid contamination from lights other than artificial lights from human settlements.
Since 1996, to enhance the utility of the sensor for monitoring of nighttime lights distribution studies, OLS acquisitions during a limited set of the dark moon nights each year are obtained at reduced gain settings (at gains 100 times lower than the normal acquisitions). Merging of these sparse low gain acquisitions with images acquired at normal gain settings has allowed deriving nighttime light products that do not saturate over bright city lights. Compositing of acquisitions taken over several months also allows distinguishing stable light sources, such as those from human settlements and gas flares, and from transient lights that may be caused by short-lived sources, such as lightning. Cloud–screening is done based on the detection of clouds in the thermal band.5 The nominal spatial resolution of the OLS data is 2.7 km, which is resampled on a grid with a spatial resolution of 1 km during the creation of the temporal image composite.7 These global radiance calibrated nighttime lights are unitless.
Address Geocoding
The address of each interviewee was geocoded to the corresponding latitude and longitude using the Google Geocoding API service. Addresses were checked for geocoding accuracy comparing them to address locations returned by Google Earth and MapQuest for many randomly selected locations. Location of the addresses were mapped and visually inspected for consistency.
We extracted the average radiance calibrated nighttime lights for the period closest to the date of the interview for a 3 × 3 pixels window centered on each coordinate corresponding to an interview address. The ONL data from the OLS sensor are available as pixel based digital images where each pixel is gridded to a 1 × 1 km pixel. To reduce the influence of geolocation errors that may occur when compositing time series of satellite data and to capture the average illumination conditions of the area in which the interviewees lived at the time of the interview, we averaged the value of the ONL over a 3 × 3 pixels window, which corresponds to a 3 × 3 km2 area.
The Sleep-EVAL General Population Survey
The interviews were carried out by phone between 2003 and 2011 using the Sleep-EVAL system.10,11 The target population was adults (18 y and older) living in 15 states: Arizona, California, Colorado, Florida, Idaho, Missouri, New York, North Carolina, North Dakota, Oregon, Pennsylvania, South Dakota, Texas, Washington, and Wyoming. The final sample included 19,136 individuals representative of the general population of these states (138 million). Of 19,136 eligible adults, 15,863 completed interviews were obtained, providing an 83.2% cooperation rate using CASRO (Council of American Survey Research Organizations) standards.
Interviewers explained the goals of the study to potential participants and requested verbal consent before conducting the interview. The participants had the option of calling the principal investigator if they wanted further information. Subjects who declined to participate or who gave up before completing half of the interview were classified as refusals. Excluded from the study were 781 subjects because they were not fluent in English or Spanish, or suffered from a hearing or speech impairment, or had an illness (such as dementia or Alzheimer disease, or a terminal disease) that precluded them from being interviewed. The interviews lasted on average 62.1 (± 32.2) min.
The study was reviewed and approved by the Stanford University Institutional Review Board (IRB).
Information collected by the system included sociodemographic information, sleep/wake schedule, sleeping habits, sleep disturbance symptoms, Diagnostic and Statistical Manual of Mental Disorders, Fourth Edition (DSM-IV) mental disorders12 and the International Classification of Sleep Disorders sleep disorders.13 International Classification of Diseases was also included in the knowledge base of the system.
The system has been tested in various contexts: in clinical psychiatry and sleep disorders clinics.14–17 In psychiatry, kappas have ranged from 0.44 (schizophrenia disorders) to 0.78 (major depressive disorder). Agreement for insomnia diagnoses was obtained in 96.9% of cases (kappa 0.78); kappa for the presence of insomnia symptoms was 0.61. Overall agreement on any breathing-related sleep disorder was 96.9% (kappa 0.94). Kappa for snoring was 0.51, and was 0.65 for breathing pauses during sleep. For excessive sleepiness as a symptom and circa-dian rhythm disorders as a diagnosis, kappas between Sleep-EVAL and three sleep specialists ranged from 0.62 to 0.70 with an overall sensitivity of 98.3% and a specificity of 62.5%. For narcolepsy with cataplexy, kappas between sleep specialists on the presence of narcolepsy ranged from 0.83 to 0.93, whereas kappas between Sleep-EVAL and each sleep specialist were 0.89, 0.93, and 1.0. Greater details on the methodology and validation can be found elsewhere.18–22
Variables
Bedtime was obtained by asking the subjects at what time they went to bed with the intention of sleeping. The sleep latency was obtained by asking the subjects how long it took them to fall asleep once they went to bed with the intention of sleeping. The nighttime sleep duration was obtained by asking the participants how long they slept during the night. Another question was asked about sleep duration during the day. Wake-up time was obtained by asking the subjects at what hour they awakened in the morning. This information was obtained for the week and the year prior to the interview. For this study, we used the sleep/wake schedule of the previous year.
Other sources of light at bedtime assessed were:
The need to sleep with a light on (always or often from a five-point Likert scale ranging from always to never)
Bedroom considered too bright (yes/no)
Watching TV in bed at least 4 to 5 nights/week (from every day to never)
Other environmental factors that might influence sleep/wake schedule:
Presence of young children in the household. It was divided into four categories: no underage child; age 5 y or younger; age 6 to 12 y; age 7 to 17 y
Population density of the area where the participants lived
Place where the subject sleeps: bed, sofa, sofabed, on a mattress on the floor
Level of noise of the sleeping place: never noisy, noisy in the daytime, noisy at night
Excessive sleepiness was defined according to the DSM-5: a complaint of excessive sleepiness associated with recurrent periods of irrepressible need to sleep within the same day; occurring at least 3 days per week for at least 3 mo. The excessive sleepiness was accompanied by impairment of occupational or sociofamily functioning or caused significant distress. The threshold for excessive sleepiness was moderate to severe somnolence, that is, occurrence ≥ 3 days/week for ≥ 1 mo.
The variables related to the work done by the respondent (type of job/job title), work schedule/arrangement in the previous month, number of hours worked/week, and level of satisfaction with current employment were also assessed. The means and duration of the daily commute to/from work constituted additional variables. Those not working a fixed schedule were also asked about the number of off-days between shifts and the number of consecutive days worked on the same shift. A history of shift work was also ascertained (i.e., duration and number of years since leaving shift work and motives for changing the work arrangement).
Another series of questions assessed the frequency of somnolence in different situations. These situations were divided into two groups: situations of low attention, such as when reading, watching TV, sitting, relaxing, and riding as a passenger in a car or on public transportation; and situations of moderate to high attention, such as when working, engaging in conversation, visiting friends/relatives, or driving a motor vehicle.
Participants were also asked how frequently they were dozing off or falling asleep for each of the aforementioned situations.
Sleep attacks are sudden episodes of falling asleep, occurring at any time and place without warning (i.e., in the absence of feeling drowsy) that are nearly impossible to prevent and control. Sleep attacks were considered to be present if they occurred ≥ 3 days/week.
Statistics
The following statistical analyses were used: For bivariate analyses, one-way analysis of variance and Bonferroni post hoc analysis or unpaired two-sided Student t-test were used to compare between ONL and multiple or two group variables, respectively. Logistic regressions were used to compute the odds of ONL being associated with (1) short sleep duration (< 6 h per night); (2) late bedtime (> 24:00); (3) late wake-up time (08:00); (4) sleep dissatisfaction; (5) excessive sleepiness; and (6) circadian rhythm disorder. Colinearity of variables was tested by the Belsey–Khu–Welsh test with conditioning index < 15. A logarithmic transformation was performed on ONL to reduce the skewness of the data. Transformed ONL data were used for the analyses and nontransformed data were used to draw the graphs for greater readability.
Reported differences were significant at the 0.01 level or less (determined using the Holm-Bonferroni method for multiple comparisons).
RESULTS
Population Distribution with Respect to Nighttime Light Intensity
Subjects of the sample were between 18 and 99 y of age. Women represented 51.3% of the sample. Table 1 describes the demographic characteristics of the sample in relationship to ONL. Males, younger participants, employees, single, and graduate school individuals were living in areas with greater ONL. Population size correlated with the intensity of ONL (r = 0.609; P < 0.0001) (Figure 2). Individuals living in areas with fewer than 50,000 inhabitants received only 33.62 (± 49.80) of ONL whereas those living in larger areas (more than three million inhabitants) received 559.86 (± 261.01) of ONL (F = 33.801; P < 0.0001). A total of 7.4% of the sample reported that their bedroom was too bright at night and 3.9% said they needed a light on in order to sleep. Sleeping in a too-bright bedroom was significantly associated with living in areas with greater ONL (t = −7.974; P < 0.0001), which suggests that part of the brightness of the bedroom might come from ONL. Individuals needing a light on were living in areas with greater ONL compared to the rest of the sample (t = −2.320; P = 0.02). Sleeping in a noisy bedroom at night was reported by 8.1% of the sample. Individuals sleeping in a noisy bedroom during night were living in areas with greater ONL than subjects who were sleeping in a never noisy bedroom (f = 142.612; P < 0.0001). The overwhelming majority of the participants reported sleeping in a bed (96.6%). The remaining of the sample was sleeping on a sofa (1.2%) or on a light mattress on the floor (2.3%).
Table 1.
Characteristics of the sample by intensity of the nighttime radiance.
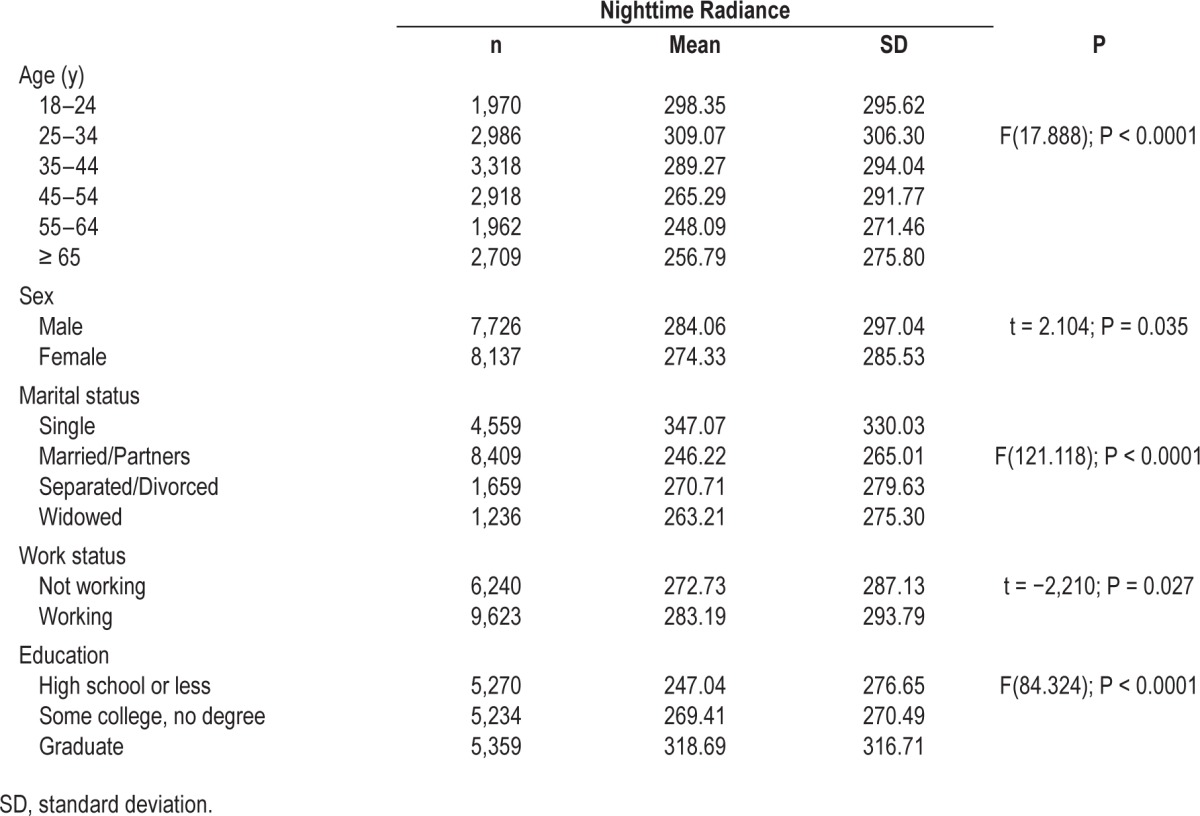
Figure 2.
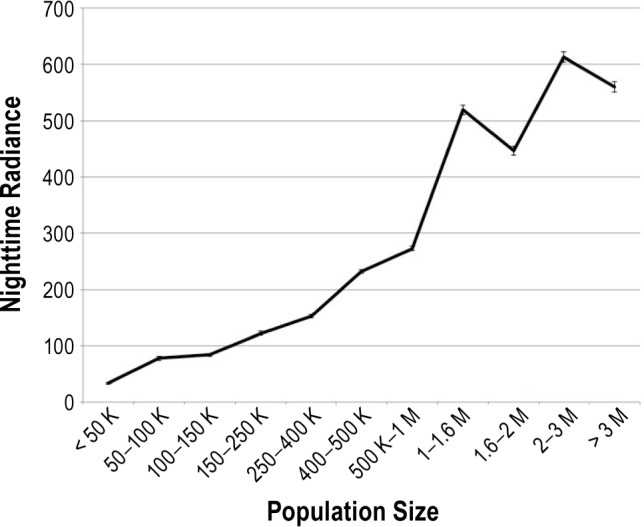
Population size by nighttime radiance. Nighttime radiance was obtained using Defense Meteorological Satellite Program's Operational Linescan System light brightness from a 3 km × 3 km window over the geolocated address. The light brightness has been calculated based on the product called “Global Radiance Calibrated Nighttime Lights.” It composites acquisitions at high and low satellite gain. f = 1190.691; P < 0.0001.
Effects of Nighttime Light on Sleep/Wake Schedule
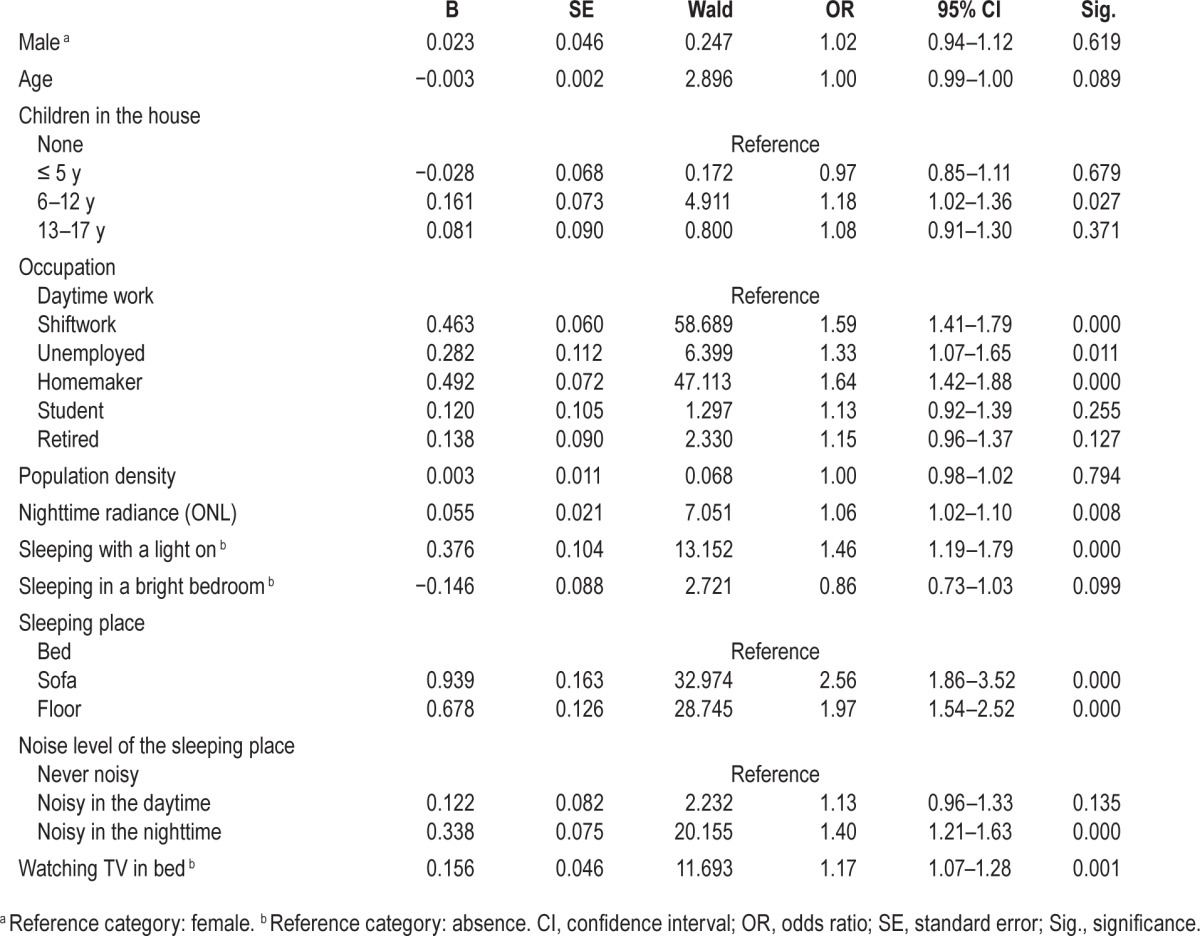
The intensity of nighttime lights strongly influences sleep duration, bedtime, and wakeup time. Sleep/wake schedule analyses excluded night workers and shift workers who had their main sleep period during the daytime at the time of the interview. Individuals sleeping less than 6 h per night were living in areas with greater ONL than those sleeping 6 h or more (t = −5.445; P < 0.0001) (Figure 3A). A logistic regression was performed to ascertain the effects of age, sex, occupation, ONL, and other environmental factors on the likelihood that participants have shorter sleep duration. The model was statistically significant (χ2(19) = 252.870, P < 0.0001) and explained 2.9% (Nagelkerke R2) of the variance in short sleep duration. After adjusting for the effects of population density, age, sex, occupation, living with children, a bright bedroom, sleeping with a light on, noise level in the bedroom, watching TV in bed, and type of bed, increase in ONL was associated with an increased likelihood of sleeping less than 6 h per night (P = 0.008) (Table 2). As seen in Table 2, sex, population density, and sleeping in a bright bedroom were unrelated to shorter sleep duration. In addition of ONL, being a shift worker, unemployed or a homemaker, watching TV in bed, sleeping with a light on, sleeping in a noisy place at night, and sleeping on a sofa or on the floor were associated with a greater likelihood of sleeping less than 6 h per night.
Figure 3.
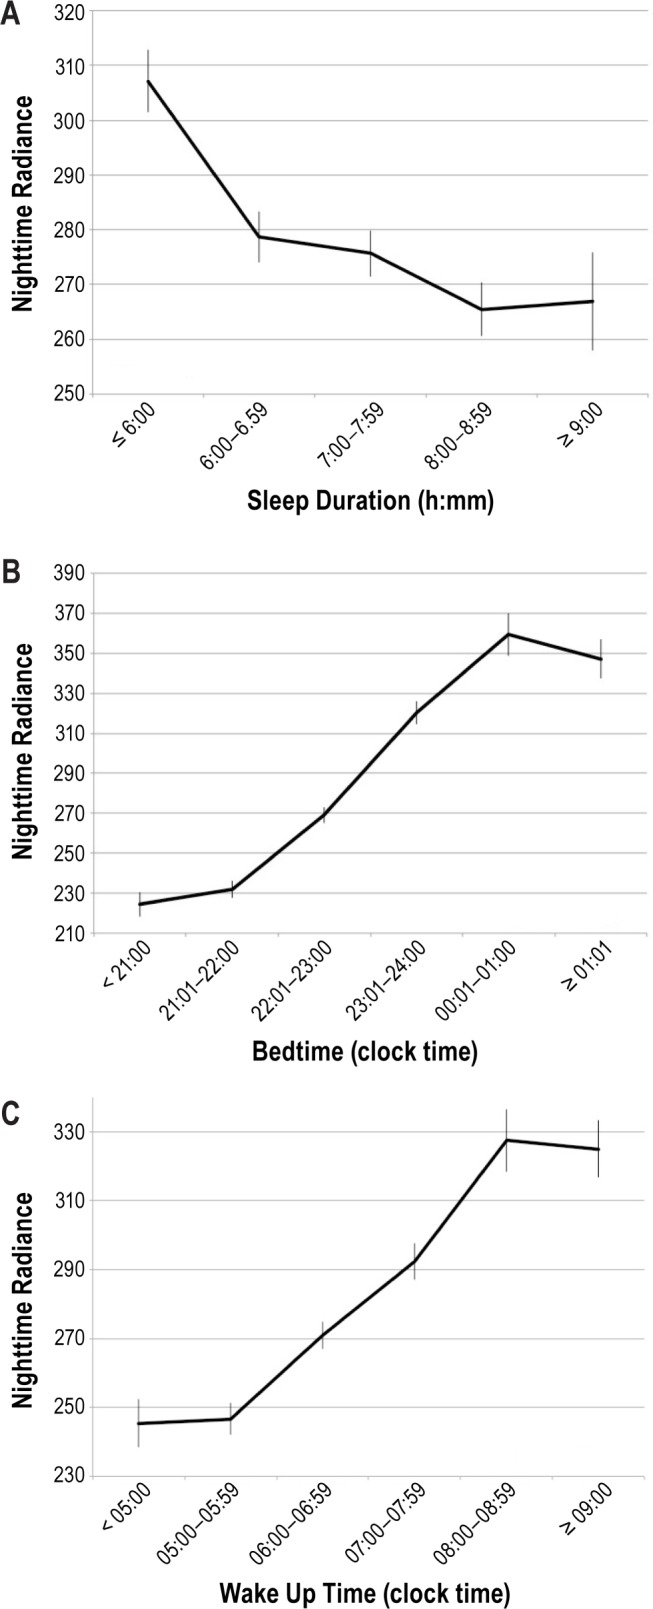
Nighttime radiance. (A) Sleep duration by nighttime radiance. f = 10.017; P < 0.0001. (B) Bedtime hour by nighttime radiance. f = 172.985; P < 0.0001. (C) Wake up time by nighttime radiance. f = 29.102; P < 0.0001. Nighttime radiance was obtained using Defense Meteorological Satellite Program's Operational Linescan System light brightness from a 3 km × 3 km window over the geolocated address. The light brightness has been calculated based on the product called “Global Radiance Calibrated Nighttime Lights.” It composites acquisitions at high and low satellite gain.
Table 2.
Logistic regression predicting likelihood of sleep duration < 6 h based on age, sex, occupation, and environmental factors.
Bedtime hour linearly increases with the intensity of ONL (Figure 3B): the later a subject went to bed, the greater the ONL was at his or her address. Another logistic regression was performed to ascertain the effects of age, sex, occupation, ONL, and other environmental factors on the probability that participants have a tardier bedtime (later than 24:00). The model was statistically significant (χ2(15) = 1154.171, P < 0.0001) and explained 13.7% (Nagelkerke R2) of the variance in late bedtime. Table 3 presents the results of the model.
Table 3.
Logistic regression predicting likelihood of bedtime after 24:00 based on age, sex, occupation, and environmental factors.
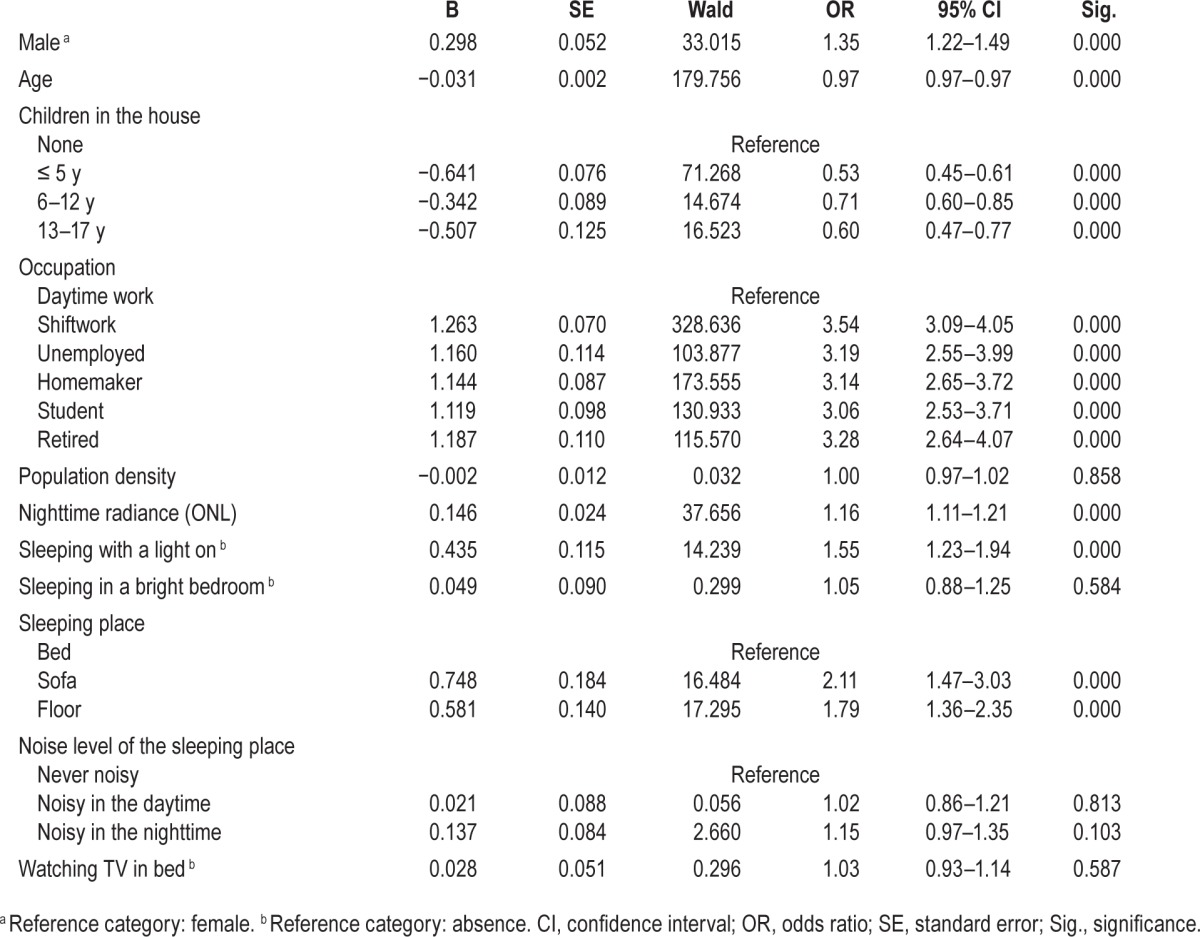
Population density, bright bedroom, noisy bedroom, and watching TV in bed were unrelated to later bedtime. As it is shown, each rise in ONL significantly increases the likelihood of a late bedtime. Age was negatively associated with late bedtime (i.e., likelihood of a late bedtime decreased with age). Presence of children in the household was also negatively associated with later bedtime. Other factors positively associated with late bedtime were being a man, occupation, sleeping with a light on, and sleeping on a sofa or on the floor.
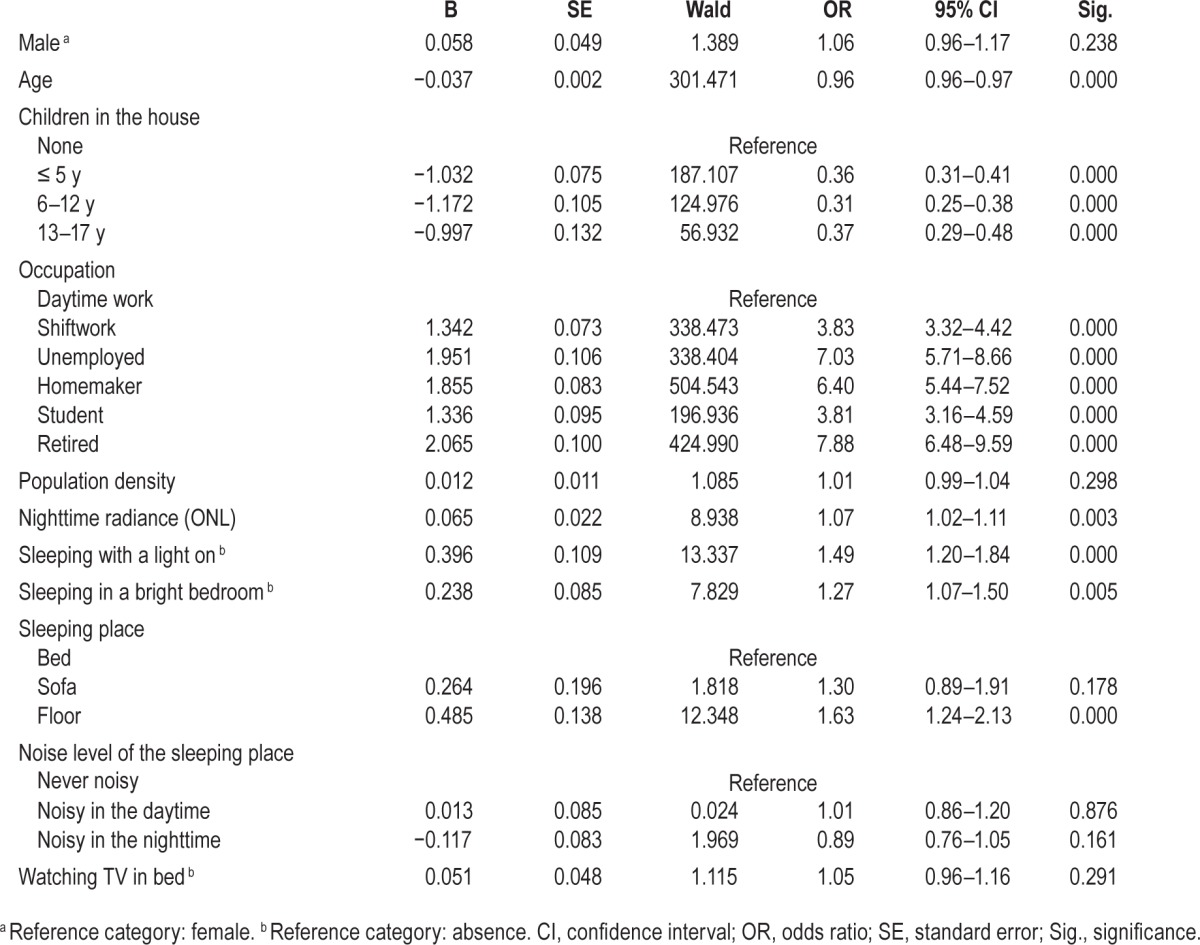
As with bedtime, wake up time became progressively later as the ONL increased (Figure 3C). A similar logistic regression was run with a later wake up time (past 08:00) as the dependent variable (Table 4). The model was statistically significant (χ2(15) = 1782.441, P < 0.0001) and explained 19.2% (Nagelkerke R2) of the variance in late wake up time. Age was negatively associated with later wake up time as was the presence of children. Each rise in ONL significantly increases the likelihood of a late wakeup time. Other variables significantly associated with a later wake up time were occupation, sleeping with a light on, or sleeping in a bright bedroom and sleeping on the floor.
Table 4.
Logistic regression predicting likelihood of wakeup time after 08:00 based on age, sex, occupation, and environmental factors.
Additional models were conducted to verify if insomnia disorders, having a diagnostic profile congruent with a circadian rhythm disorder, or the presence of a mental disorder would increase the proportion of explained variance because people with these disorders often have a later bedtime and/or wake up time. These additions added 9.2% of explained variance for sleep duration; 1.3% for bedtime and 0.9% for wake up time. In all the models, ONL remained significantly associated with shorter sleep, late bedtime and late wake up time.
Sleep latency and extra sleeping times on weekends and days off were unrelated to ONL.
Sleep Disturbances
We found that ONL increased the risk of being dissatisfied with sleep quality and/or quantity (Table 5). This association remained significant in a logistic regression assessing the effects of age, sex, occupation, ONL, and other environmental factors (χ2(19) = 485.999, P = 0.0001) on global sleep dissatisfaction and explained 5.8% of the variance in dissatisfaction with sleep. In this model, ONL was significantly associated with global sleep dissatisfaction (odds ratio [OR]: 1.05 [1.02– 1.09]). Global sleep dissatisfaction accompanied with whether difficulty initiating sleep, nocturnal awakenings, or early morning awakenings were not significantly associated with ONL. Individuals living in areas with greater ONL were more likely to have having a diagnostic profile congruent with a circadian rhythm disorder (Table 5). A similar logistic regression was carried on. The model explained 5.4% of the variance (χ2(19) = 93.714, P < 0.0001). ONL remained significantly associated with circadian rhythm disorder (OR: 1.28 [1.11–1.48]). DSM-5 insomnia disorders diagnosis, sleep-related breathing disorders, and restless legs syndrome were unrelated to ONL. Confusional arousals were also significantly associated with an increased ONL (Table 5). Again, a logistic regression was performed to ascertain the effects of age, sex, occupation, ONL, and other environmental factors on the probability that participants have confusional arousals. The model was significant χ2(19) = 841.183, P < 0.0001 and explained 7.1% of the variance in confusional arousals. ONL was significantly associated with confusional arousals (OR: 1.07 [1.02–1.12]; P = 0.007).
Table 5.
Sleep disturbances and disorders by intensity of the nighttime radiance.
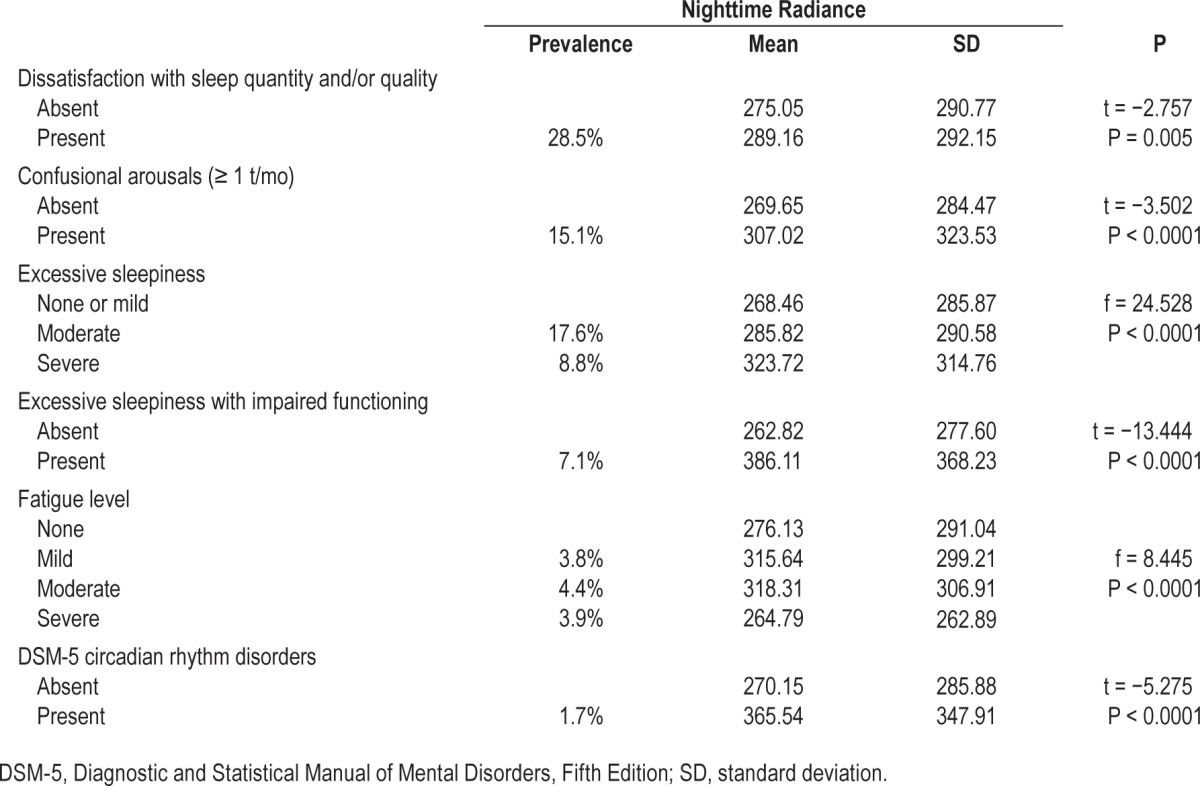
Excessive sleepiness accompanied with impaired functioning (e.g., the individual had difficulty performing daily tasks or had difficulty in his or her sociofamily relationships) was significantly associated with an increased ONL (Table 5). The association remained significant in the logistic regression model. ONL was significantly associated with excessive sleepiness (OR: 1.20 [1.12–1.29]; P < 0.0001).
DISCUSSION
The results of this study show that individuals living in areas with greater ONL were at greater risk of reporting symptoms consistent with a circadian rhythm sleep disorder. These symptoms manifested into delayed bedtime, delayed wakeup time, and reduced nighttime sleep. Living in areas with greater ONL was also associated with greater dissatisfaction with sleep quality and/or quantity and a greater likelihood of a diagnostic profile congruent with a circadian rhythm disorder. As a consequence, individuals living in areas with greater ONL are more likely to be sleepy during the day.
The effects of increased ONL on delaying both bedtime and wakeup time and decreasing sleep duration are consistent with an expected suppression of melatonin secretion caused by light exposure.23–27 Interestingly, these associations remained strongly significant even after controlling for possible confounders such as age, sex, population density, light in the bedroom, and noise.
Laboratory studies have shown that the use of a bedside light was sufficient to alter sleep patterns in healthy subjects by increasing stage 1 sleep, decreasing slow wave sleep (stages 3 and 4) and increasing the arousal index.28 In our study, both sleeping with a light on and external artificial light appeared to play a significant part in the alteration of the sleep cycle even after we included other environmental factors such as noise, population density, bright bedroom, and watching TV in bed. Several experimental studies have demonstrated that exposure to bright light at night provokes a phase delay of the brain's pacemaker ranging from 1 to 3 h depending on the experimental conditions (light intensity and duration of the exposure).29–31 Since 2013, the cardinal symptom for insomnia has been defined by DSM-5 as a global dissatisfaction with sleep quantity or quality.32–34 This symptom can be accompanied by difficulty initiating sleep, nocturnal awakenings, or early morning awakenings.16 Some studies have suggested that greater exposure to light at night increases the presence of insomnia, especially in elderly people.35 We found that ONL increased the risk of being dissatisfied with sleep quality and/ or quality but was unrelated to insomnia disorder. Short sleep was also associated with greater ONL. However, short sleep can be observed in various sleep disorders, not just with insomnia. Individuals with a circadian rhythm disorder often complain of insomnia symptom(s) and/or excessive sleepiness. We did find that individuals living in areas with greater ONL were associated with a greater risk of having a diagnostic profile congruent with a circadian rhythm disorder. Excessive sleepiness and fatigue reported by individuals living in areas with greater light at night can be the result of shorter sleep but can also be the result of bad quality sleep. As Cho et al.28 have demonstrated, individuals exposed to light at night spent less time in slow wave sleep, which is associated with the restorative function of sleep.
The satellite data show that changes in light intensity alone are associated with widespread effect on sleep patterns, likely through a suppression of early evening secretion of melatonin, electroencephalographic activation, and decreased sleepiness. Suppression of melatonin is regulated by the nonimageforming photoreceptors, a type of photoreceptor that unlike rods and cones do not contribute to vision but to perceiving illumination conditions. Our study suggests that ambient light outside the home is playing a greater role than the simple act of keeping a light on in the bedroom for the night. Ambient radiance explained a significant amount of variance in bedtime and sleep duration after controlling for a bright room, using a light at night or watching TV in bed. ONL and population density are clearly correlated and certainly have both an effect on sleep behaviors. In our results, ONL outweighed population density in terms of importance on sleep behaviors: when ONL and population density were entered together in regression models, population density was always nonsignificant. Bedroom brightness was also associated with living in areas with greater outdoor nighttime lights, pointing to the importance of properly darkening a bedroom at night for improved sleep quality.
However, it has to be kept in mind that this study is purely observational: We found several significant associations with outdoor nighttime lights and sleep behaviors but because of the nature of this study, actual level of lights could not be assessed. We did not ask for the presence of curtains in the bedroom windows and the opacity of the curtains nor for the use of a sleeping mask. As our results show, there are also other environmental factors than outdoor lights that were associated with alterations in sleep behaviors; for example, the presence of young children or occupation status. It should also be kept in mind that all of our models explained only partially the modifications in sleep/wake behaviors. One could have expected that different sleep/wake patterns would have been associated with living in urban or rural areas. In all our multivariate models, population density was not significantly related to sleep/wake schedule, which means that other factors played a greater role.
The satellite data used in this study did not allow for measuring the changes in spectrum introduced by different types of light fixtures because the OLS sensor is a panchromatic straddling the visible and near-infrared portions of the electromagnetic spectrum. However, it is possible that changes in spectrum associated with the evolution of lighting technology may also affect the sleep patterns of the population. Selective effects of the light spectrum on sleep indicators have been documented in laboratory studies. How the effects of changes in light spectrum manifest themselves in the general population under environmental conditions should be studied with the design of multispectral nighttime sensors.
As cities grow and new developments are added, the number of street lights increases, brightening our neighborhoods even more. Because of enhanced effects with traditional lighting technology such as high-pressure sodium lights, lighting has an effect beyond the simple illumination of streets.36
DISCLOSURE STATEMENT
This was not an industry supported study. This study was supported by the Arrillaga Foundation and by the Philip Stein Foundation (MMO). The authors have no other financial relationships or commercial interests with the sponsors. The sponsors had no role in the design and conduct of the study, nor the collection, management, analysis and interpretation of the data. There was no editorial direction or censorship from the sponsors. The sponsors have not seen the manuscript and had no role in the decision to submit the paper for publication. No writing assistance was provided. The authors had access to all data from the study, both what is reported and what is unreported, and they also had complete freedom to direct the analysis and the reporting, without influence from the sponsors. Dr. Ohayon has received research support from Jazz Pharmaceuticals. Dr. Milesi has indicated no financial conflicts of interest.
ACKNOWLEDGMENTS
Author contributions: The two authors have participated sufficiently in the work to take public responsibility for the content. More specifically, the two authors were involved in the conception OR design OR analysis and interpretation of data; have contributed to the drafting and revisions of the manuscript; and have approved the submitted version. MMO was the PI of this study and was doing the data collection. CM was in charge of collecting the nighttime light radiance data.
REFERENCES
- 1.Falchi F, Cinzano P, Elvidge CD, Keith DM, Haim A. Limiting the impact of light pollution on human health, environment and stellar visibility. J Environ Manage. 2011;92:2714–22. doi: 10.1016/j.jenvman.2011.06.029. [DOI] [PubMed] [Google Scholar]
- 2.Pittendrigh CS. Temporal organization: reflections of a Darwinian clock-watcher. Annu Rev Physiol. 1993;55:17–54. doi: 10.1146/annurev.ph.55.030193.000313. [DOI] [PubMed] [Google Scholar]
- 3.Wright KP, Jr, McHill AW, Birks BR, Griffin BR, Rusterholz T, Chinoy ED. Entrainment of the human circadian clock to the natural light-dark cycle. Curr Biol. 2013;23:1554–8. doi: 10.1016/j.cub.2013.06.039. [DOI] [PMC free article] [PubMed] [Google Scholar]
- 4.Ferracioli-Oda E, Qawasmi A, Bloch MH. Meta-analysis: melatonin for the treatment of primary sleep disorders. PLoS One. 2013;8:e63773. doi: 10.1371/journal.pone.0063773. [DOI] [PMC free article] [PubMed] [Google Scholar]
- 5.Glickman G, Levin R, Brainard GC. Ocular input for human melatonin regulation: relevance to breast cancer. Neuro Endocrinol Lett. 2002;23(Suppl 2):17–22. [PubMed] [Google Scholar]
- 6.Zeitzer JM, Dijk DJ, Kronauer R, Brown E, Czeisler C. Sensitivity of the human circadian pacemaker to nocturnal light: melatonin phase resetting and suppression. J Physiol. 2000;526(Pt 3):695–702. doi: 10.1111/j.1469-7793.2000.00695.x. [DOI] [PMC free article] [PubMed] [Google Scholar]
- 7.Elvidge CD, Baugh KE, Dietz JB, Bland T, Sutton PC, Kroehl HW. Radiance calibration of DMSP-OLS low-light imaging data of human settlements. Remote Sens Environ. 1999;68:77–88. [Google Scholar]
- 8.Elvidge CD, Baugh KE, Hobson VR, et al. Satellite inventory of human settlements using nocturnal radiation emissions: a contribution for the global toolchest. Global Change Biol. 1997;3:387–95. [Google Scholar]
- 9.Elvidge CD, Baugh KE, Kihn EA, Kroehl HW, Davis ER. Mapping city lights with nighttime data from the DMSP operational linescan system. Photogramm Eng Remote Sens. 1997;63:727–34. [Google Scholar]
- 10.Ohayon MM. Ottawa: Industry Canada; 1994. Sleep-EVAL, Knowledge Based System for the Diagnosis of Sleep and Mental Disorders. Copyright Office, Canadian Intellectual Property Office. [Google Scholar]
- 11.Ohayon MM. Improving decision-making processes with the fuzzy logic approach in the epidemiology of sleep disorders. J Psychosom Res. 1999;47:297–311. doi: 10.1016/s0022-3999(99)00010-0. [DOI] [PubMed] [Google Scholar]
- 12.American Psychiatric Association. Washington, DC: American Psychiatric Association; 2000. Diagnostic and Statistical Manual of Mental Disorders, Fourth Edition. [Google Scholar]
- 13.American Academy of Sleep Medicine. Westchester, IL: American Academy of Sleep Medicine; 2005. The International Classification of Sleep Disorders, 2nd ed.: Diagnostic and Coding Manual. [Google Scholar]
- 14.Ohayon MM, Guilleminault C, Zulley J, Palombini L, Raab H. Validation of the Sleep- EVAL system against clinical assessments of sleep disorders and polysomnographic data. Sleep. 1999;22:925–30. doi: 10.1093/sleep/22.7.925. [DOI] [PubMed] [Google Scholar]
- 15.Ohayon M. Validation of expert systems: examples and considerations. Medinfo. 1995;8:1071–5. [PubMed] [Google Scholar]
- 16.Hosn R, Shapiro CM, Ohayon MM. Diagnostic concordance between sleep specialists and the Sleep-EVAL system in routine clinical evaluations. J Sleep Res. 2000;9(suppl 1):86. [Google Scholar]
- 17.Black J, Ohayon MM, Okun M, Guilleminault C, Mignot E, Zarcone V. The narcolepsy diagnosis: comparison between the Sleep-EVAL system and clinicians. Sleep. 2001;24:A328. (Abstract Suppl) [Google Scholar]
- 18.Ohayon MM, Reynolds CF, 3rd, Dauvilliers Y. Excessive sleep duration and quality of life. Ann Neurol. 2013;73:785–94. doi: 10.1002/ana.23818. [DOI] [PMC free article] [PubMed] [Google Scholar]
- 19.Ohayon MM, Mahowald MW, Leger D. Are confusional arousals pathological? Neurology. 2014;83:834–41. doi: 10.1212/WNL.0000000000000727. [DOI] [PubMed] [Google Scholar]
- 20.Ohayon MM, Smolensky MH, Roth T. Consequences of shiftworking on sleep duration and sleep attacks. Chronobiol Int. 2010;27:575–89. doi: 10.3109/07420521003749956. [DOI] [PubMed] [Google Scholar]
- 21.Ohayon MM, Lemoine P, Arnaud-Briand V, Dreyfus M. Prevalence and consequences of sleep disorders in a shift worker population. J Psychosom Res. 2002;53:577–83. doi: 10.1016/s0022-3999(02)00438-5. [DOI] [PubMed] [Google Scholar]
- 22.Ohayon MM, Reynolds CF., 3rd Epidemiological and clinical relevance of insomnia diagnosis algorithms according to the DSM-IV and the International Classification of Sleep Disorders (ICSD) Sleep Med. 2009;10:952–60. doi: 10.1016/j.sleep.2009.07.008. [DOI] [PMC free article] [PubMed] [Google Scholar]
- 23.Chellappa SL, Steiner R, Blattner P, et al. Non-visual effects of light on melatonin, alertness and cognitive performance: can blue-enriched light keep us alert? PLoS One. 2011;6:e16429. doi: 10.1371/journal.pone.0016429. [DOI] [PMC free article] [PubMed] [Google Scholar]
- 24.Chellappa SL, Viola AU, Schmidt C, et al. Human melatonin and alerting response to blue-enriched light depend on a polymorphism in the clock gene PER3. J Clin Endocrinol Metab. 2012;97:E433–7. doi: 10.1210/jc.2011-2391. [DOI] [PubMed] [Google Scholar]
- 25.Lockley SW, Evans EE, Scheer FA, et al. Short-wavelength sensitivity for the direct effects of light on alertness, vigilance, and the waking electroencephalogram in humans. Sleep. 2006;29:161–8. [PubMed] [Google Scholar]
- 26.Hattar S, Liao HW, Takao M, et al. Melanopsin-containing retinal ganglion cells: architecture, projections, and intrinsic photosensitivity. Science. 2002;295:1065–70. doi: 10.1126/science.1069609. [DOI] [PMC free article] [PubMed] [Google Scholar]
- 27.Ruger M, Gordijn MC, Beersma DG, et al. Weak relationships between suppression of melatonin and suppression of sleepiness/fatigue in response to light exposure. J Sleep Res. 2005;14:221–7. doi: 10.1111/j.1365-2869.2005.00452.x. [DOI] [PubMed] [Google Scholar]
- 28.Cho JR, Joo EY, Koo DL, Hong SB. Let there be no light: the effect of bedside light on sleep quality and background electroencephalographic rhythms. Sleep Med. 2013;14:1422–5. doi: 10.1016/j.sleep.2013.09.007. [DOI] [PubMed] [Google Scholar]
- 29.Zeitzer JM, Dijk DJ, Kronauer RE, Brown EN, Czeisler CA. Sensitivity of the human circadian pacemaker to nocturnal light: melatonin phase resetting and suppression. J Physiol. 2000;526:695–702. doi: 10.1111/j.1469-7793.2000.00695.x. [DOI] [PMC free article] [PubMed] [Google Scholar]
- 30.Canton JL, Smith MR, Choi HS, Eastman CI. Phase delaying the human circadian clock with a single light pulse and moderate delay of the sleep/dark episode: no influence of iris color. J Circad Rhythms. 2009;7:8. doi: 10.1186/1740-3391-7-8. [DOI] [PMC free article] [PubMed] [Google Scholar]
- 31.Khalsa SBS, Jewett ME, Cajochen C, Czeisler CA. A phase response curve to single bright light pulses in human subjects. J Physiol. 2003;549:945–52. doi: 10.1113/jphysiol.2003.040477. [DOI] [PMC free article] [PubMed] [Google Scholar]
- 32.American Psychiatric Association. Arlington, VA: American Psychiatric Publishing; 2013. Diagnostic and Statistical Manual of Mental Disorders, 5th Edition. [Google Scholar]
- 33.Ohayon MM, Caulet M, Priest RG, Guilleminault C. DSM-IV and ICSD-90 insomnia symptoms and sleep dissatisfaction. Br J Psychiatry. 1997;171:382–8. doi: 10.1192/bjp.171.4.382. [DOI] [PubMed] [Google Scholar]
- 34.Ohayon M, Riemann D, Morin C, Reynolds CF. Hierarchy of insomnia criteria based on daytime consequences. Sleep Med. 2012;13:52–7. doi: 10.1016/j.sleep.2011.06.010. [DOI] [PMC free article] [PubMed] [Google Scholar]
- 35.Obayashi K, Saeki K, Kurumatani N. Association between light exposure at night and insomnia in the general elderly population: the HEIJO-KYO cohort. Chronobiol Int. 2014;15:1–7. doi: 10.3109/07420528.2014.937491. [DOI] [PubMed] [Google Scholar]
- 36.Cinzano P, Falchi F. The propagation of light pollution in the atmosphere. Mon Not R Astron Soc. 2012;427:3337–57. [Google Scholar]


