Kleinknecht, L., Wang, F., Stübe, R., Philippar, K., Nickelsen, J., and Bohne, A.-V. (2014). RAP, the sole octotricopeptide repeat protein in Arabidopsis, is required for chloroplast 16S rRNA maturation. Plant Cell 26: 777–787.
In the course of on-going work, the authors realized that there were mistakes in the design of primers used to generate templates for in vitro transcription of RNA probes by the T7 RNA polymerase. Templates were generated by annealing primers with incorrectly positioned T7 promoter sequence elements in reverse primers. Therefore, no RNA synthesis should have occurred. However, as observed in native agarose gels as well as in the analysis of synthesized RNAs by RNase T1 digestion, misdesigned primers had a strong self-annealing capacity leading to undefined RNAs of expected sizes. As even correctly designed primers showed self-annealing, new experiments were performed either with PCR products used as templates for in vitro transcription or synthetic RNA oligos.
While the general conclusion on the function of RAP in 16S rRNA maturation is not affected by these errors, their consequence is that the determination of the RAP binding site within the 16S precursor RNA (Figure 4C) as well as in vitro RAP binding affinities to RNAs (Figure 6) were not correctly resolved, for which the authors apologize. The corrected experiments do not support binding of RAP to FP1 as stated before. Instead, rRAP showed a higher affinity to the FP2 probe compared with the two other reported footprint sequences. However, the affinity of rRAP for FP2 seems to be only moderately increased compared with FP1 and FP3, for which no distinct footprint was detected (corrected Figures 4C and 6). Therefore, it is also possible that RAP binds to another sequence within the 16S rRNA precursor or that additional determinants like overall rRNA structure or other trans-acting factors enhance selective binding of RAP to FP2 in vivo. Nonetheless, additional data provided in Figure 9 support a role of RAP in precise trimming of the mature 16S 5′ end.
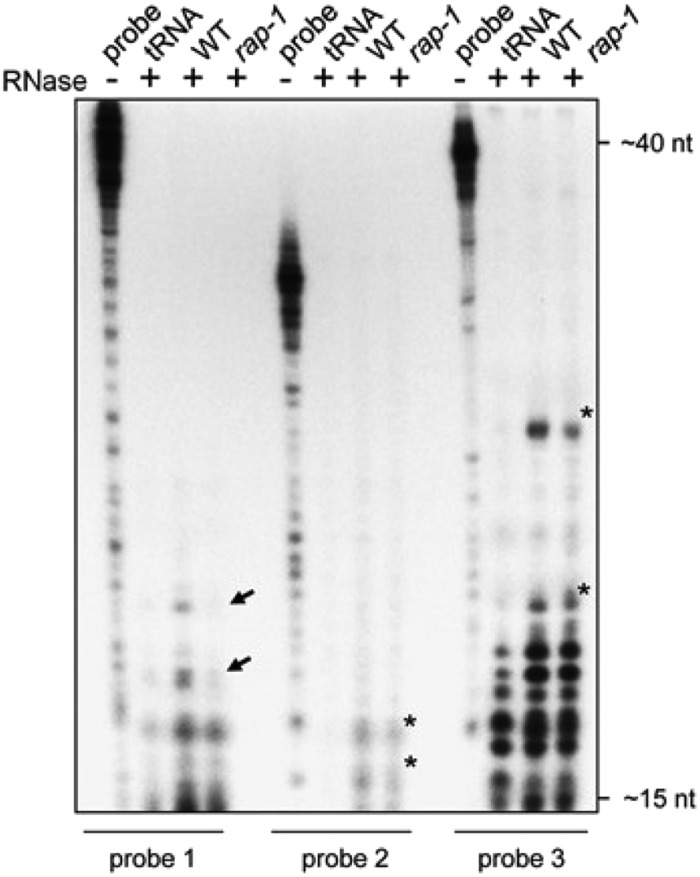
Figure 4C.
Original: RNase Protection Assay.
Total RNAs from wild-type or rap-1 plants were hybridized with the respective radiolabeled probe indicated below the panel (cf. [A]) and treated with single-strand specific RNases A and T1. Protected fragments were analyzed on a sequencing gel alongside 1/30 of the respective undigested hybridization probe (probe). Probes incubated with yeast tRNA before RNase digestion (lane “tRNA”) were used as a control. Black arrows mark fragments that are less abundant in rap-1 and asterisks major fragments protected in both the wild type and rap-1. Expected sizes of fragments were estimated from the running fronts of xylene cyanol (∼40 nucleotides) and bromophenol blue (∼15 nucleotides) indicated on the right.
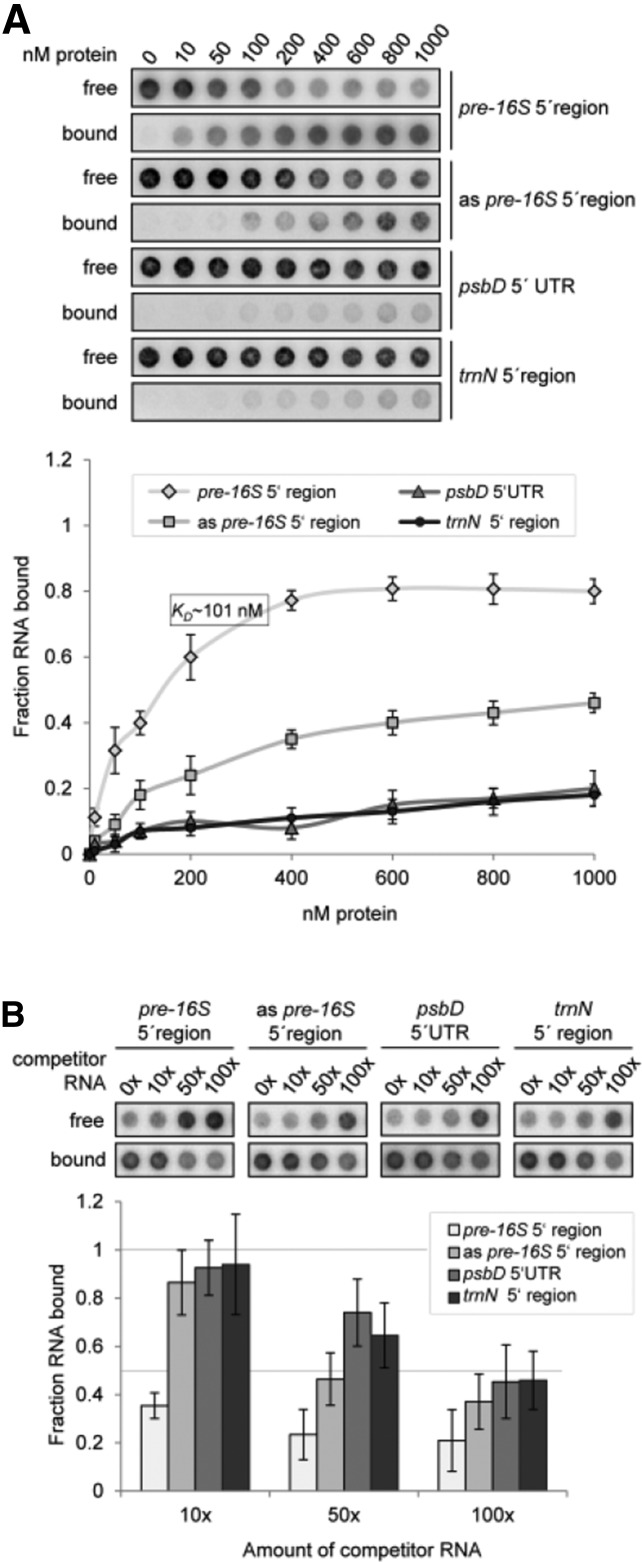
Figure 6.
Original: rRAP Binds Preferentially to the 5′ Region of the 16S Precursor Transcript.
(A) Determination of RNA binding curves. Binding reactions containing 6 pM 32P-labeled RNA of each indicated RNA and increasing molarities of rRAP were filtered through stacked nitrocellulose and nylon membranes using a dot-blot apparatus (top panel). Signal intensities for nitrocellulose bound protein-RNA complexes (bound) as well as nylon membrane–bound free RNAs (free) were quantified by phosphor imaging. The binding curves were determined from three experiments performed as triplicates with the same rRAP preparation (bottom panel). Calculated means are shown with standard deviations indicated by error bars. The equilibrium binding constant (Kd) of rRAP and the pre-16S 5′ region probe was determined to be 101 nM as indicated.
(B) Competition experiments. Binding reactions containing rRAP protein, 32P-labeled RNA of the pre-16S 5′ region, and the indicated molar excess of competitor RNAs representing the homologous RNA, sequences of the psbD 5′ UTR, the trnN 5′ noncoding region, or the antisense sequence of the radiolabeled pre-16S 5′ region (as pre-16S 5′ region), respectively, were treated as described in (A). Signal intensities obtained for each reaction without competitor RNA were set to 1. Three independent experiments were performed as triplicates for each reaction, and calculated means are shown with standard deviations indicated by error bars (bottom panel).
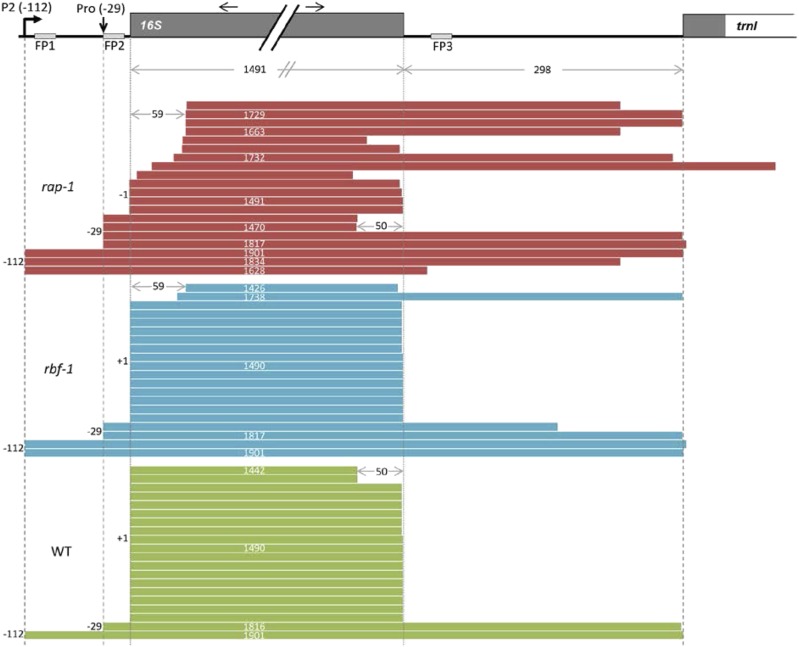
Figure 9.
cRT-PCR.
16S rRNA ends were deduced from cRT-PCR clones (n = 20). Each bar represents a single clone. A schematic representation of a part of the chloroplast rrn operon is shown above the diagram. Dark-gray boxes indicate exons, white boxes introns, and light-gray boxes predicted footprints. The P2 promoter is represented by a bent arrow. The vertical arrow indicates the mapped processing site at −29 with respect to the start of the mature 16S rRNA (previously annotated as “Pro-31” in Bisanz et al., 2003). Black horizontal arrows indicate the positions and directions of the cRT-PCR primer pair.
A brief description of the problems associated with each figure and corrections made is provided here, followed by side-by-side presentation of the original and corrected figures and the new methods (and associated references) used to prepare the corrected figures.
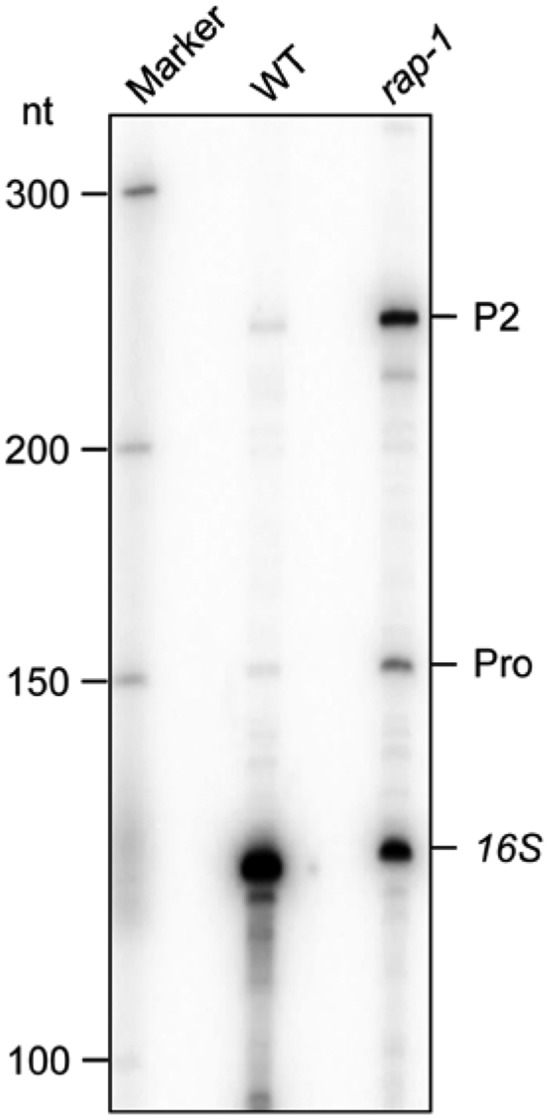
Figure 4B. The previously shown primer extension analysis in Figure 4B is correct and only replaced because an additional control mutant defective in 16S rRNA processing, rbf1-1 (Fristedt et al., 2014), is included in the analysis. Note the apparent extension of the “mature” 16S transcript in rap-1 compared with the wild-type and rbf1-1.
Figure 4B.
Original: Primer Extension Analysis of 16S rRNA 5′ Ends.
Total RNAs from wild-type and rap-1 plants were subjected to primer extension analysis using the primer depicted in (A). Known 5′ ends are indicated on the right. Sizes of bands of single-stranded DNA markers are indicated on the left.
Figure 4C. Due to the high self-annealing capacity of primers, an annealing strategy of in vitro transcription templates was considered unsuitable for the generation of specific RNA probes. Consequently, the RNase protection experiment has been replaced by a RNA gel blot analysis of respective footprints. These new data suggest that FP2 instead of the formerly described FP1 region represents the RAP-dependent RNA footprint.
Figure 5. The experiment was repeated using a PCR product as template for the generation of in vitro transcribed RNA. The results obtained are identical to those in the original figure and reveal an unspecific intrinsic RNA binding by rRAP.
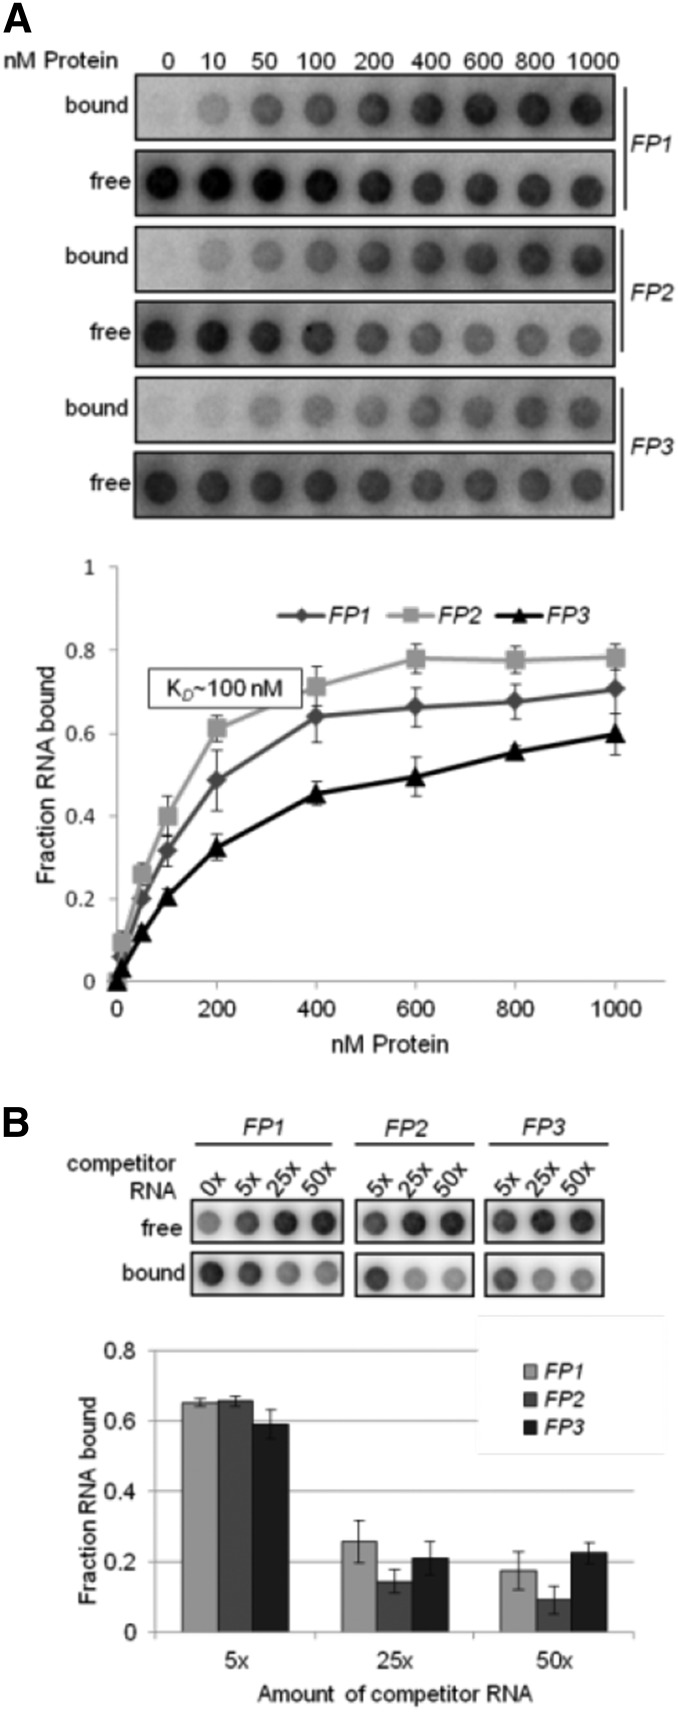
Figure 6. The experiment was repeated using synthetic FP1-FP3-specific RNA oligos. rRAP showed a slightly higher affinity to FP2 compared with the other tested RNA oligos.
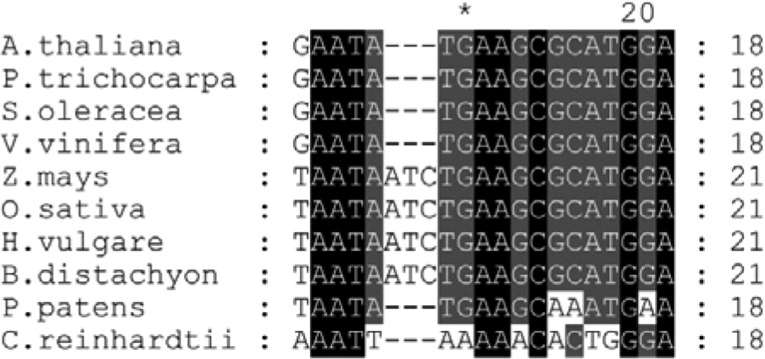
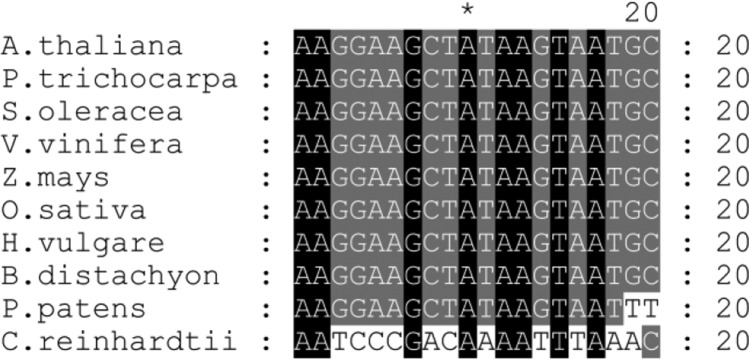
Figure 8. This figure is correct but represents an alignment of footprint 1 (FP1) sequences. As it is now possible that FP2 is the RAP binding site, a new alignment of FP2 related sequences is provided.
Figure 9. To confirm the 5′ extension of “mature” 16S transcripts in rap-1 observed in Figure 4C, we additionally mapped precise 5′ and 3′ ends of 16S-related transcripts by circular RT-PCR (cRT-PCR). In contrast to rbf1-1 and the wild type, we could not detect any transcript in rap-1 with a correct mature 5′ end. All transcripts started either at P2, Pro-29, or had a 1-nucleotide extension (starting at −1). In addition, we found many transcripts in rap-1 with truncated 5′ and 3′ ends. While 16S precursors starting at −112 (P2) or −29 (Pro) and with longer 3′ extensions/truncations were occasionally observed also in the wild type or rbf1-1, we never detected any 5′ 1-nucleotide extensions in these plants.
Figure 4C.
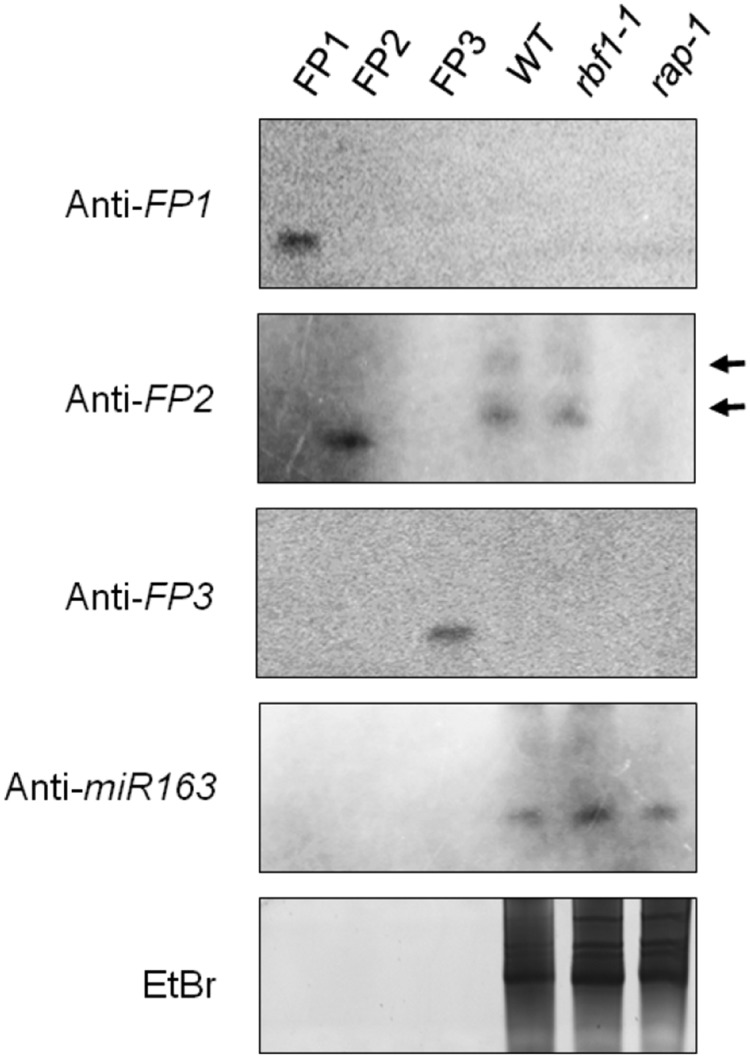
Corrected: Analysis of Small RNAs in rap-1.
RNA gel blot analyses of small RNAs from the wild type, rap-1, and an additional control RNA from the Arabidopsis rbf1-1 mutant, described to also reveal a defect in 16S rRNA processing (Fristedt et al., 2014). Thirty micrograms of total leaf RNA was fractionated in denaturing polyacrylamide gels and transferred to a charged nylon membrane. DNA oligonucleotides that mimic each sRNA (FP1-FP3) were run in adjacent lanes. DNA probes used, which are complementary to the respective small RNA, are indicated on the left. Note that single-stranded DNA migrates slightly faster than single-stranded RNA. As a positive control, we used microRNA miR163 (Ha et al., 2009). Two small RNAs specific to FP2 that were only detected in the wild type and rbf-1, but not in the rap-1 mutant, are indicated by black arrows. A representative ethidium bromide-stained gel is shown to demonstrate equal loading.
METHODS
RNA Preparation and Transcript Analysis
Frozen leaves from 3-week-old plants were ground in liquid nitrogen, and RNA was extracted using TRI Reagent (Sigma-Aldrich) according to the manufacturer’s instructions. RNA gel blot analysis of total RNA from rap-1 and wild-type plants was performed using standard methods. Specific transcripts were detected with digoxigenin-labeled PCR products.
RNA gel blots for detection of small RNAs were basically performed as described by Zhelyazkova et al. (2012). Before hybridization, RNAs were cross-linked to the membrane using 1-ethyl-3-(3-dimethylaminopropyl)carbodiimide hydrochloride according to Pall and Hamilton (2008). The oligonucleotides used as probes (FP1, 5′-TCCATGCGCTTCATATTC-3′; FP2, 5′-GCATTACTTATAGCTTCCTT-3′; FP3, 5′-ATACCCAAGAAGCATTAGCTCTCC-3′; miR163, 5′- ATCGAAGTTCCAAGTCCTCTTCAA-3′) were end-labeled with [γ-32P]ATP (Hartmann Analytic) using T4 polynucleotide kinase (New England Biolabs). Unincorporated nucleotides were removed with the QIAquick nucleotide removal kit (Qiagen) according to the manufacturer’s instructions. Three DNA oligonucleotides (FP1, 5′-GAATATGAAGCGCATGGA-3′; FP2, 5′-AAGGAAGCTATAAGTAATGC-3′; FP3, 5′-GGAGAGCTAATGCTTCTTGGGTAT-3′) that mimic each sRNA were run on the gel as controls.
Determination of RNA Binding Curves and Competition Experiments
The RNA binding curves and the Kd value for the specific RNA were determined as described by Bohne et al. (2013). Synthetic RNA oligos (Integrated DNA Technologies; FP1, 5′-CGAAUAUGAAGCGCAUGGAUACAA-3′; FP2, 5′-GAAGGAAGCUAUAAGUAAUGCAAC-3′; and FP3, 5′-GGAGAGCUAAUGCUUCUUGGGUAU-3′) were 5′-labeled as described above, and probes were gel purified according to Ostersetzer et al. (2005). Binding reactions were performed at room temperature for 15 min and contained 20 mM HEPES/KOH, pH 7.8, 5 mM MgCl2, 60 mM KCl, and 6 pM of the indicated 32P-labeled RNA probe. Further steps of the filter binding assays were performed as described for the Kd value determination by Bohne et al. (2013). Results were visualized on a Storm phosphor imager and quantified using ImageQuantTL (GE Healthcare).
For competition experiments, reactions containing rRAP (600 nM) and the 32P-labeled synthetic RNA oligo for FP2 (6 pM) premixed with increasing amounts of cold competitor RNA were incubated in binding buffer (20 mM HEPES/KOH, pH 7.8, 5 mM MgCl2, 60 mM KCl, and 0.5 mg/mL heparin) at room temperature for 15 min. Subsequent steps were performed as described for the binding curves.
cRT-PCR
The cRT-PCR method was basically performed as described previously (Zimmer et al., 2012; Hotto et al., 2015). Two and a half micrograms of circularized wild-type, rap-1, and rbf1-1 RNAs were reverse transcribed using SuperScript III with a gene-specific oligo (16S 5′ cRT-PCR F1, 5′-CACCCGTCCGCCACTGGAAACACCA-3′). Twenty percent of the RT reaction was used for amplification with the same oligo as before and an oligo binding close to the 3′ end of the 16S rRNA (16S 3′ cRT-PCR R1, 5′-CTTAACCGCAAGGAGGGGGGTGCCGAA-3′) using a Taq polymerase. Purified PCR products (NucleoSpin Gel and PCR clean-up; Macherey-Nagel) were cloned with the CloneJET PCR cloning kit (Thermo Fisher Scientific) and sequenced with custom primers.
Figure 4B.
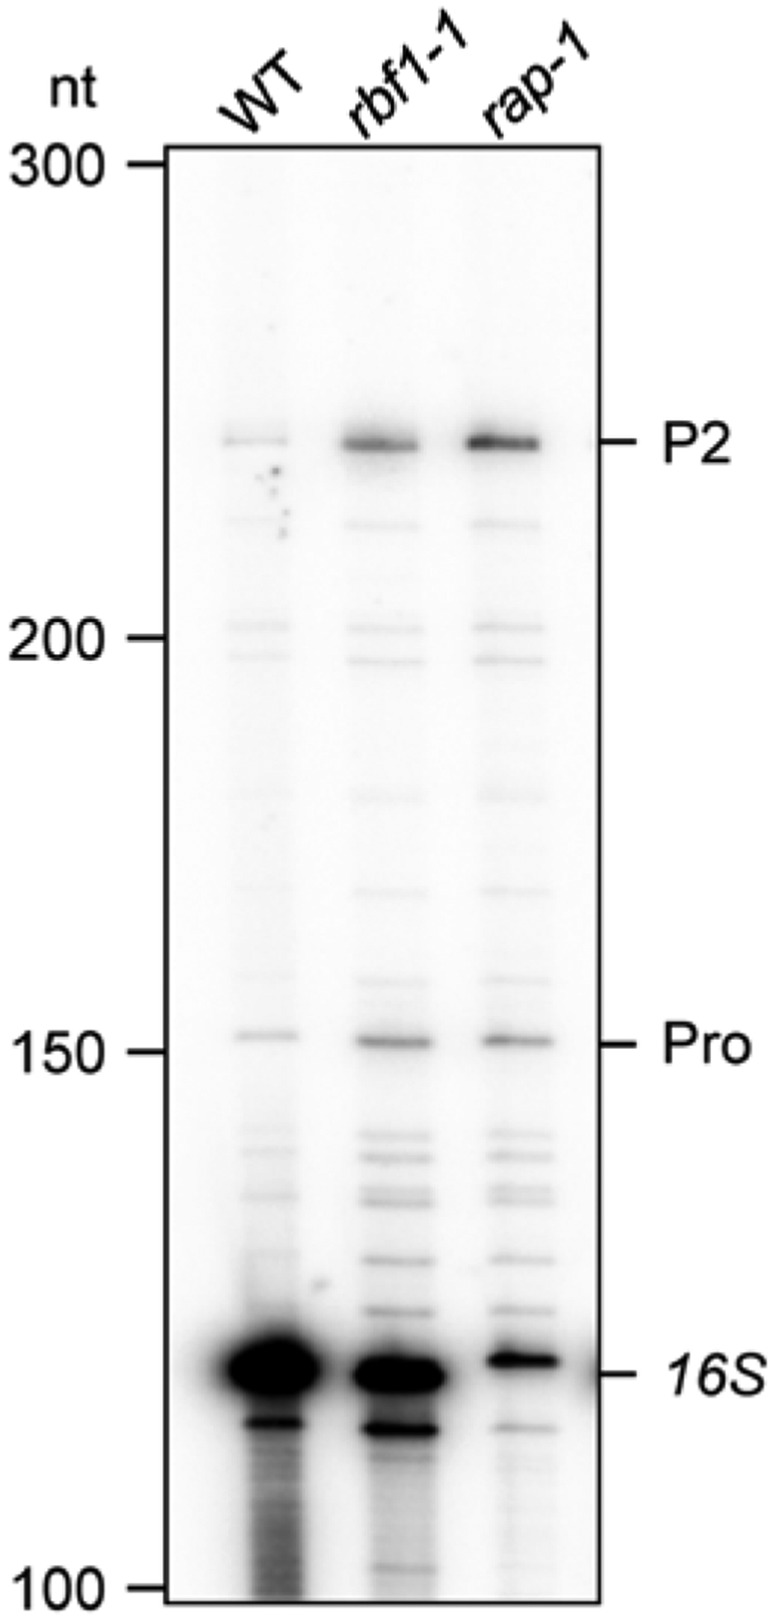
Corrected: Primer Extension Analysis of 16S rRNA 5′ Ends.
Total RNAs from wild-type, rbf1-1, and rap-1 plants were subjected to primer extension analysis using the primer depicted in (A). Known 5′ ends are indicated on the right. Sizes of bands of single-stranded DNA markers are indicated on the left.
Figure 5.
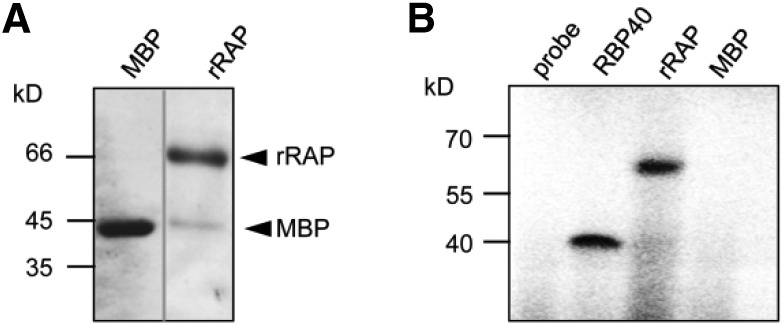
Original: rRAP Exhibits an Intrinsic RNA Binding Capacity.
(A) Purification of rRAP protein. Coomassie blue–stained SDS-PAGE gel showing the affinity-purified rRAP protein after removal of the maltose binding protein tag that was electrophoresed alongside authentic MBP. Mobilities of size markers are indicated on the left. Note that the two samples were electrophoresed on the same gel but not in adjacent lanes.
(B) UV cross-linking experiment. Purified rRAP protein, together with two control proteins (MBP and the RNA binding protein RBP40), was analyzed after UV cross-linking in the presence of a radiolabeled RNA probe corresponding to the 16S region spanning FP1 (pre-16S 5′ region). Sizes of marker bands are given in kilodaltons on the left.
Figure 5.
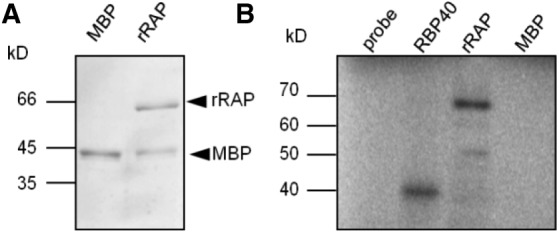
Corrected: rRAP Exhibits an Intrinsic RNA Binding Capacity.
(A) Purification of rRAP protein. Coomassie blue–stained SDS-PAGE gel showing the affinity-purified rRAP protein after removal of the maltose binding protein tag that was electrophoresed alongside authentic MBP. Mobilities of size markers are indicated on the left.
(B) UV cross-linking experiment. Purified rRAP protein, together with two control proteins (MBP and the RNA binding protein RBP40), was analyzed after UV cross-linking in the presence of a radiolabeled RNA probe corresponding to the 5′ pre-16S region. Sizes of marker bands are given in kilodaltons on the left.
The PCR product used as DNA template for in vitro synthesis of the 5′ pre-16S rRNA region was amplified using the following set of primers: 16S 5′ (−139) T7 forward (5′-taatacgactcactatagggGGTAGGGGTAGCTATATTTCTG-3′) and 16S 5′ (+57) reverse (5′-ATGTGTTAAGCATGCCGC-3′).
Figure 6.
Corrected: RNA Binding Specificity of rRAP to Footprint Regions within the 16S Precursor Transcript.
(A) Determination of RNA binding curves. Binding reactions containing 6 pM 32P-labeled RNA of each indicated RNA and increasing molarities of rRAP were filtered through stacked nitrocellulose and nylon membranes using a dot-blot apparatus (top panel). Signal intensities for nitrocellulose-bound protein-RNA complexes (bound) as well as nylon membrane–bound free RNAs (free) were quantified by phosphor imaging. The binding curves were determined from three experiments performed as triplicates (bottom panel). Calculated means are shown with standard deviations indicated by error bars. The equilibrium binding constant (Kd) of rRAP and the FP2 probe was determined to be ∼100 nM as indicated.
(B) Competition experiments. Binding reactions containing rRAP protein, 32P-labeled FP2 RNA, and the indicated molar excess of competitor RNAs representing unlabeled FP1, FP2, and FP3 RNA oligos, respectively, were treated as described in (A). Signal intensities obtained for each reaction without competitor RNA were set to 1. Three independent experiments were performed as triplicates for each reaction, and calculated means are shown with standard deviations indicated by error bars (bottom panel).
Figure 8.
Original: Conservation of the Putative RAP Binding Site.
Alignment of the 16S 5′ region corresponding to footprint 1 in Arabidopsis (Supplemental Figure 3) with respective segments of the 16S 5′ region of indicated species. Black shading represents 100% conservation and dark gray and gray 80 and 60%, respectively. For sequence accession numbers, see Methods.
Figure 8.
Corrected: Conservation of the Potential RAP Binding Site.
Alignment of the 16S 5′ region corresponding to footprint 2 in Arabidopsis (Supplemental Figure 3) with respective segments of the 16S 5′ region of indicated species. Black shading represents 100% conservation and dark gray and gray 80 and 60%, respectively. For sequence accession numbers, see Methods.
Footnotes
Editor’s note: the corrected figure and accompanying text were reviewed by members of The Plant Cell editorial board. Both the original and corrected figures are shown for ease of comparison.
Articles can be viewed online without a subscription.
References
- Bisanz C., Bégot L., Carol P., Perez P., Bligny M., Pesey H., Gallois J.-L., Lerbs-Mache S., Mache R. (2003). The Arabidopsis nuclear DAL gene encodes a chloroplast protein which is required for the maturation of the plastid ribosomal RNAs and is essential for chloroplast differentiation. Plant Mol. Biol. 51: 651–663. [DOI] [PubMed] [Google Scholar]
- Bohne A.-V., Schwarz C., Schottkowski M., Lidschreiber M., Piotrowski M., Zerges W., Nickelsen J. (2013). Reciprocal regulation of protein synthesis and carbon metabolism for thylakoid membrane biogenesis. PLoS Biol. 11: e1001482. [DOI] [PMC free article] [PubMed] [Google Scholar]
- Fristedt R., Scharff L.B., Clarke C.A., Wang Q., Lin C., Merchant S.S., Bock R. (2014). RBF1, a plant homolog of the bacterial ribosome-binding factor RbfA, acts in processing of the chloroplast 16S ribosomal RNA. Plant Physiol. 164: 201–215. [DOI] [PMC free article] [PubMed] [Google Scholar]
- Ha M., Lu J., Tian L., Ramachandran V., Kasschau K.D., Chapman E.J., Carrington J.C., Chen X., Wang X.-J., Chen Z.J. (2009). Small RNAs serve as a genetic buffer against genomic shock in Arabidopsis interspecific hybrids and allopolyploids. Proc. Natl. Acad. Sci. USA 106: 17835–17840. [DOI] [PMC free article] [PubMed] [Google Scholar]
- Hotto A.M., Castandet B., Gilet L., Higdon A., Condon C., Stern D.B. (2015). Arabidopsis chloroplast mini-ribonuclease III participates in rRNA maturation and intron recycling. Plant Cell 27: 724–740. [DOI] [PMC free article] [PubMed] [Google Scholar]
- Ostersetzer O., Cooke A.M., Watkins K.P., Barkan A. (2005). CRS1, a chloroplast group II intron splicing factor, promotes intron folding through specific interactions with two intron domains. Plant Cell 17: 241–255. [DOI] [PMC free article] [PubMed] [Google Scholar]
- Pall G.S., Hamilton A.J. (2008). Improved northern blot method for enhanced detection of small RNA. Nat. Protoc. 3: 1077–1084. [DOI] [PubMed] [Google Scholar]
- Zhelyazkova P., Hammani K., Rojas M., Voelker R., Vargas-Suárez M., Börner T., Barkan A. (2012). Protein-mediated protection as the predominant mechanism for defining processed mRNA termini in land plant chloroplasts. Nucleic Acids Res. 40: 3092–3105. [DOI] [PMC free article] [PubMed] [Google Scholar]
- Zimmer S.L., McEvoy S.M., Menon S., Read L.K. (2012). Additive and transcript-specific effects of KPAP1 and TbRND activities on 3′ non-encoded tail characteristics and mRNA stability in Trypanosoma brucei. PLoS One 7: e37639. [DOI] [PMC free article] [PubMed] [Google Scholar]


