

Abstract
Background:
The risk of cardiovascular diseases (CVDs) increases with age. The objective was to determine whether lifestyle and dietary behaviors and anthropometric measures, which are affected by these behaviors, contribute to the increase of CVD risk factors across age categories of 20–50-year-old.
Methods:
In a cross-sectional design, 437 adults aged 20–50-year-old were selected from households living in Shiraz. Risk factors of CVD, including body mass index (BMI), waist-to-height ratio (WHtR), blood pressure, fasting blood glucose (FBG), serum triglycerides, total cholesterol, and low- and high-density lipoprotein cholesterol (LDL-C and HDL-C, respectively) as well as lifestyle behaviors (physical activity and smoking), dietary habits, and food intakes were assessed across the age categories of 20–29, 30–39, and 40–50 years. Linear regression was used to examine the contribution of different variables to the age-related increase of CVD risk factors.
Results:
All CVD risk factors, except for HDL-C, significantly increased across age categories. Older subjects had healthier dietary habits and food intakes, but they possessed nonsignificantly lower physical activity and higher smoking rate compared to younger adults. Adjusting for physical activity, smoking, and BMI did not change the significant positive association between age and CVD risk factors but adjusting for WHtR disappeared associations for blood pressure, triglycerides, and metabolic syndrome although significant associations remained for FBG and total and LDL-C.
Conclusions:
Age-related increase of CVD risk factors occurred independent of lifestyle habits. WHtR, but not BMI, may partially contribute to the age-related increase in CVD risk factors.
Keywords: Age, cardiovascular diseases, dietary habits, waist-to-height ratio
INTRODUCTION
Cardiovascular diseases (CVDs) are the major cause of mortality in the world.[1] Among CVD risk factors, the age is blamed as the most important predictor of CVD events.[2] Although most of CVD events occur in age 75 and older,[3] the basis of CVD is constituted in early ages.[4] According to the Framingham risk algorithm, the age of 40 (for men) or 45 (for women) is the time in which the risk of coronary heart disease begins to increase.[5] However, evidence indicates that cardiovascular risk factors start to increase even earlier, for example, in 20s.[6]
Regardless of age and few other CVD risk factors such as sex and race that are unmodifiable, there are many risk factors that are manageable and can be controlled through correction of lifestyle.[7] These include, but not limited to, obesity, physical inactivity, unhealthy nutrition behaviors, and cigarette smoking. Healthy lifestyle and appropriate dietary habits can decelerate the progress or delay the onset of CVD.[8] However, there is little information about the alteration of lifestyle and dietary habits across ages and the relationship between these behaviors with an age-related increase of CVD risk factors. In other words, it is not clear whether the change of these modifiable risk factors plays a role in the age-related increase in CVD risk factors.
In the current study, we investigated risk factors of CVD in three age categories of 20–29 years, 30–39 years, and 40–50 years to see how these risk factors change as young people get older. We also investigated lifestyle behaviors, dietary habits, food intakes, and anthropometric measures (including body mass index [BMI] and waist circumference) across the age categories to investigate the contribution of these variables in the age-related alteration in CVD risk factors.
METHODS
Study design and participants
This was a cross-sectional study conducted on 437 adults aged 20–50-year-old in Shiraz, Iran. Because there is no report of dyslipidemia in Shiraz, the sample size was chosen with the assumption of 50% prevalence, the confidence level of 95%, and margin of error = 5%. Participants were selected by stratified multistage random sampling from households living in nine municipal districts of Shiraz. Sample size of each district was determined according to the population of the district. Using a city map, districts were then divided into blocks, from which samples were randomly selected. In each block, samples were also selected by random from streets and alleys. Samples were included in the study if they met inclusion criteria. Individuals with severe illnesses (e.g., cancer and organ failure), and individuals with special diets or diseases and medications that affect appetite or dietary intake were not included. All participants gave informed written consent. The project was approved by the Research Deputy of Shiraz University of Medical Sciences (Project ID: 92-6865).
Data collection
Data on demographic information, lifestyle, dietary habits, and food intakes were collected by trained interviewers. Family affluence scale was evaluated by a valid questionnaire using the criteria of the possessing personal bedroom, the number of cars and computers, and the frequency of traveling for vacations.[9] Physical activity was measured as Metabolic Equivalent Task (Met-min/wk) by the International Physical Activity Questionnaire.[10] Blood pressure was measured after 5 min rest with the use of a standing mercury sphygmomanometer (Alpk2, Japan). Participants were seated and blood pressure was measured twice with at least 1 min interval in between. The mean of two measurements was considered as the participant's blood pressure.
Anthropometric measurements
Weight was measured with minimal clothing to the nearest 0.1 kg using a digital scale (Glamor BS-801, Hitachi, China) and height was measured to the nearest 0.1 cm by using a nonstretchable tape fixed on a wall while the person was standing without shoes with heels, buttocks, and shoulders touching the wall. BMI was calculated by dividing weight in kilograms by the square of height in meters. Waist circumference was measured at the midpoint between the lowest rib and the iliac crest, and hip circumference was measured at the largest width of the buttocks over light clothing by using nonstretchable tape, without any pressure to body surface.[11]
Laboratory tests
Blood was taken on consecutive days from 8 to 10 a.m. after 12 h fast. Glucose, total triglycerides, total cholesterol, low-density lipoprotein cholesterol (LDL-C), and high-density lipoprotein cholesterol (HDL-C) were quantified by using enzymatic procedures (Pars-Azmun, Tehran, Iran) and an auto-analyzer (ChemWell autoanalyzer, Awareness Technology Inc., USA) on the same day of bleeding.
Metabolic syndrome was scored according to the criteria defined by the National Iranian Committee of Obesity (NICB) for the clinical diagnosis of metabolic syndrome in Iranian adults.[12] These criteria are the same as those defined by adult treatment panel III, except for waist circumference, which is suggested to be gender and ethnic group-specific.[13] However, the cut-off value which is proposed by NICB is identical for both genders in Iran. The criteria is as follows: Waist circumference ≥95 cm for men and women, serum triglyceride ≥150 mg/dl, HDL-C <40 mg/dl for men and <50 mg/dl for women, systolic blood pressure ≥130 mmHg or diastolic blood pressure ≥85 mmHg, and fasting blood glucose (FBG) ≥100 mg/dl. Each criterion scored as 1. Hence, 0 was designated to a person with none of the metabolic syndrome components, and 5 to an individual with all of the criteria.
Dietary intake
Dietary patterns were assessed by using a 168-item semi-quantitative food frequency questionnaire (FFQ), which was evaluated for validity and reliability in previous studies.[14] The FFQ comprised foods generally consumed by Iranians. Daily, weekly, or monthly consumption of foods for the duration of the past year was asked using specific serving sizes. The amounts of consumption were then converted to standard serving sizes by using household measure manual.[15] Nutrient composition of consumed foods was determined by the Nutritionist IV version 3.5.2 (Hearst Corp., San Bruno, CA).
Statistical analysis
Data were analyzed by SPSS software version 19.0 (SPSS Inc., Chicago, IL, USA). Data were checked for normality using the Kolmogorov-Smirnov test. The relationship between qualitative data, such as sex, marital status, education, and smoking, and three age categories was examined by Chi-square. The association between quantitative data including cardiovascular risk factors, dietary intakes, and physical activity, and age categories was examined by one-way ANOVA. Linear regression analysis was performed between cardiovascular risk factors and age categories, with physical activity, smoking, and BMI or waist-to-height ratio (WHtR) as the covariates. P < 0.05 was considered statistically significant.
RESULTS
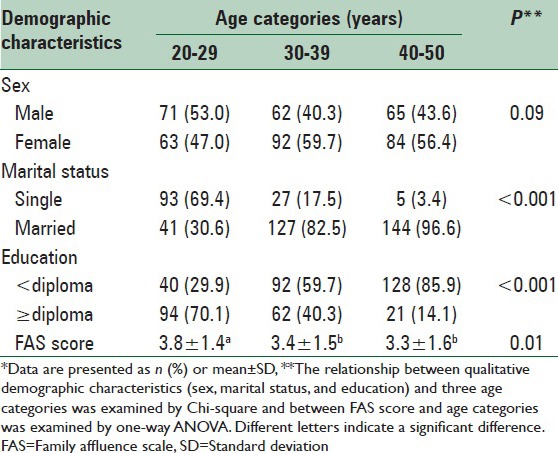
There was no significant difference in the distribution of males and females between the age categories of 20–29 years, 30–39 years, and 40–50 years [Table 1], but younger individuals were more frequently single and possessed higher levels of education and financial affluence.
Table 1.
Demographic characteristics of the participants by age categories*
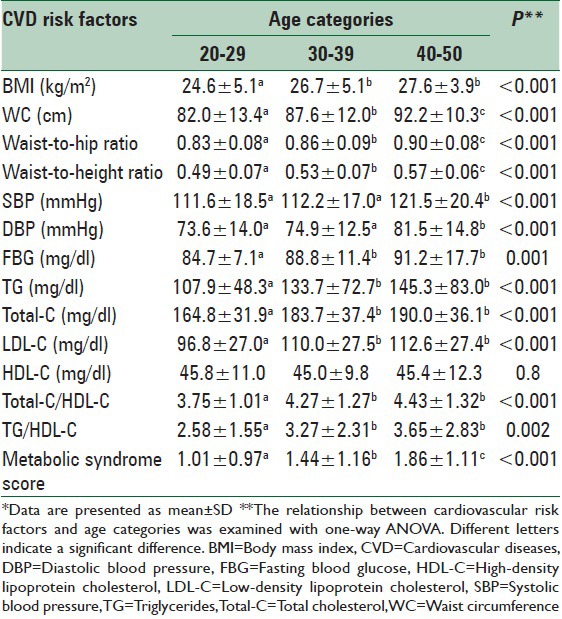
With the exception of HDL-C, all risk factors of CVDs, including BMI, waist circumference, waist-to-hip and WHtRs, blood pressure, triglycerides, total and LDL cholesterol, and score of metabolic syndrome significantly increased across the age categories [Table 2].
Table 2.
Anthropometric characteristics and risk factors of cardiovascular diseases by age categories*
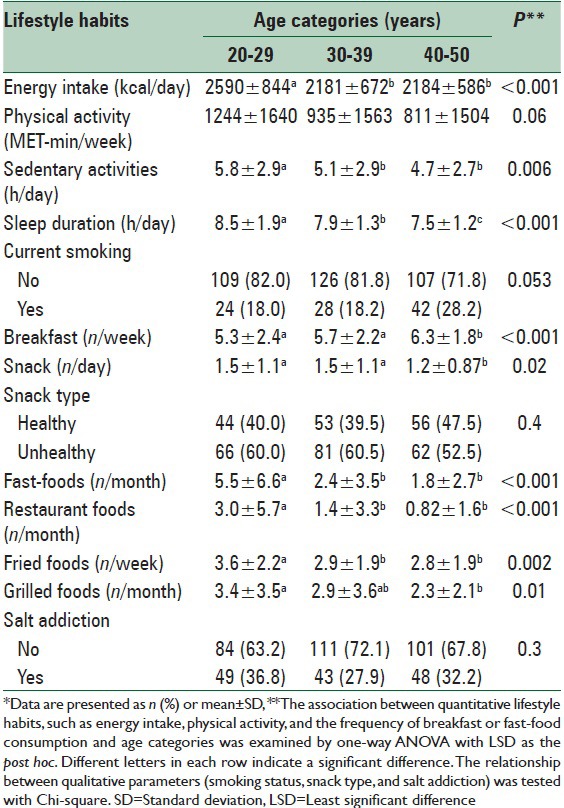
Daily energy intake, sedentary activities, and sleep duration significantly decreased across age categories [Table 3]. Consumption of breakfast is increased but consumption of snacks, fast foods, fried and grilled foods, and restaurant foods decreased as the age of the subjects increased. There was no significant difference between age categories regarding smoking habits, the type of snacks, and salt addiction.
Table 3.
Lifestyle and dietary habits by age categories*
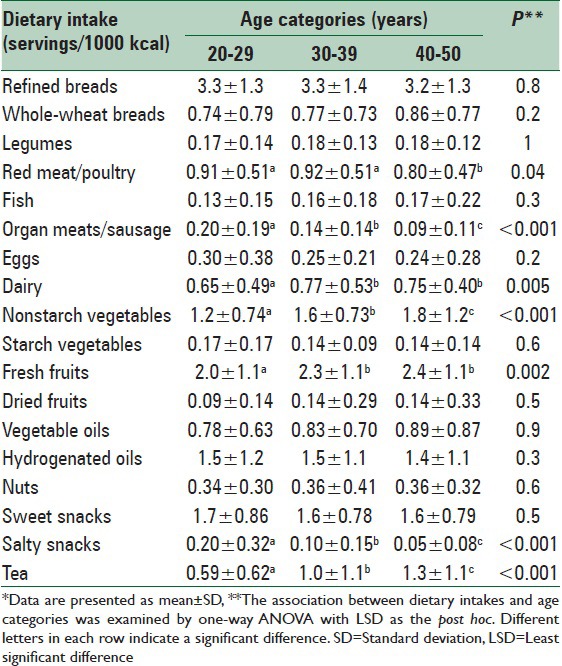
Analysis of FFQ revealed that ingestion of red meat/poultry, organ meats/sausage, and salty snacks decreased and that of dairy, nonstarch vegetables, fresh fruits, and tea increased across the age categories [Table 4]. Consumption of other food groups, such as fish, eggs, nuts, and sweet snacks did not significantly differ between the age groups.
Table 4.
Consumption of various food groups by the age categories*
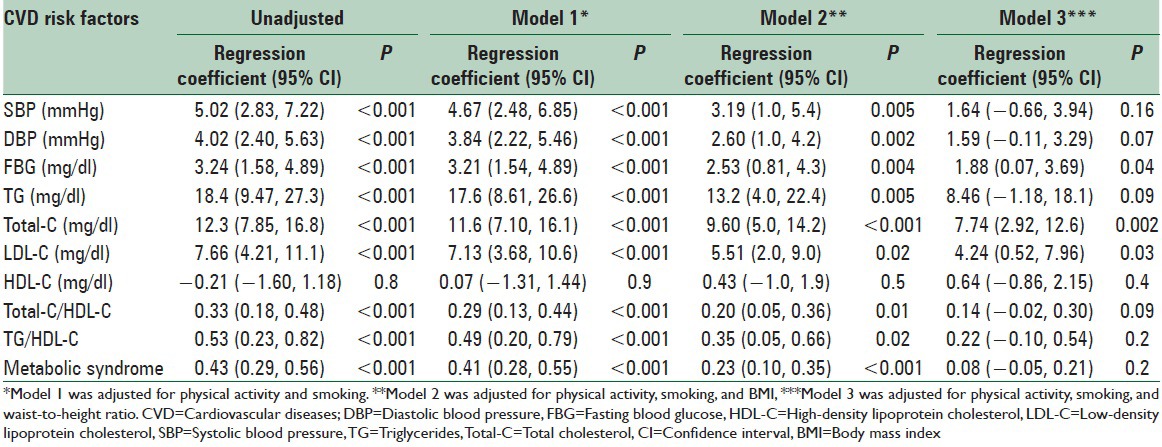
Because lower physical activity and higher smoking rate were common unhealthy habits among the older subjects, regression analysis was performed between CVD risk factors and age categories to determine whether such habits contributed to the age-related increase in CVD risk factors. Adjusting for physical activity and smoking did not change the significant positive association between age and CVD risk factors [Table 5]. Addition of BMI in the regression (model 2) also did not make a remarkable difference, but addition of WHtR (model 3) disappeared associations for blood pressure, triglycerides, and metabolic syndrome but significant associations remained for FBG, and total and LDL cholesterol [Table 5].
Table 5.
Linear regression of the association between age categories and cardiovascular risk factors
DISCUSSION
The results presented here showed that except for HDL-C, risk factors of CVD including BMI, waist circumference, systolic and diastolic blood pressure, serum glucose, triglycerides, and total and LDL-C increased with age. Older subjects seemed to be more concerned about their health and more encouraged to follow recommendations of a healthy diet, as evidenced by lower energy intake and less consumption of fast and fried foods, organ meat, red meat/poultry, and salty snacks and more consumption of dairy products, nonstarch vegetables, fruits, and tea.
We recognized age as an important contributor of the increase of CVD risk factors across the ages, independent of lifestyle, and dietary habits. Previous studies have also shown a positive relationship between age and CVD risk factors (e.g., waist circumference, WHtR, blood pressure, triglycerides, and LDL-C)[6] and also between age and CVD events.[16] In fact, age has been suggested as an inexpensive screening tool for detection of people at risk of future CVD events.[2] It is estimated that the risk of CVD doubles every 7.6 years of age.
Among individual risk factors, the greatest difference was related to triglycerides with 34.7% increase from the first to the third age category. Nonetheless, the score of metabolic syndrome showed 84.1% increase across these age categories. Previous studies have also found increases in rates of obesity and overweight[17,18] and in levels of triglyceride and glucose[19] along with increasing age. Decreased activity of 6-desaturase may be involved in the age-related alteration in blood lipids.[19]
Despite better adherence to healthy lifestyle and dietary habits, subjects in older ages possessed higher rates of CVD risk factors. The reason for this paradox is not clear. Among the investigated unhealthy habits, subjects of older ages exhibited lower level of physical activity (P = 0.06 for the difference between young and older subjects) and higher smoking rate (P = 0.053 for the difference between young and older subjects) but followed more strictly healthy dietary habits. Adjusting for physical activity and smoking habits did not change the significant difference in CVD risk factors across age categories, indicating that these factors did not contribute to the age-related increase in CVD risk factors. It is worth noting that although the age is an important factor in increasing risk of CVD and that following healthy dietary habits may not prevent increasing CVD risk factors, an appropriate diet and healthy lifestyle can result in the delay in the onset of diseases and higher health status in the elderly.[20]
We identified WHtR as an important contributor of the CVD risk. BMI was not an effective factor because adjusting for BMI did not considerably change the results while adjusting for WHtR changed the age-related increase of risk factors toward nonsignificant associations for some factors (blood pressure, triglycerides, and metabolic syndrome score) although associations for blood glucose, total cholesterol, and LDL-C remained significant, suggesting that the age-related increase in WHtR was not the only contributor of the increase of CVD risk factors across the age categories. Although both BMI and WHtR are factors that are affected by lifestyle and dietary habits because most of the lifestyle and dietary habits improved with age the reason of the age-related increase of BMI and waist circumference is not clear, although increasing age by itself may be an important factor. Future studies are needed to clarify why despite following healthy lifestyle and dietary habits BMI and waist circumference increase with age.
Previous reports are more or less in agreement with these results because both general obesity (which is assessed by BMI[16]) and abdominal obesity (which can be determined by waist circumference, WHtR[21,22]) have been suggested as predictors of CVD or CVD risk factors. However, abdominal obesity may be a better predictor of metabolic diseases because waist-to-hip and WHtRs have been associated with CVD risk even among subjects with normal weight.[22,23] Moreover, compared to BMI, waist circumference and WHtR have been found stronger predictors of diabetes and CVD, and their prediction occurs independent of BMI.[24]
Similar to our results regarding the positive trend toward following healthier diet in older adults, previous investigations have shown that consumption of unhealthy foods, such as meats, fast foods, and soft drinks is higher in young (20–39 years), while consumption of breads, dairy products, fruit, vegetables, cereals, and grains is higher in older ages (≥60 years).[25] In a similar study conducted on adults 25–74 years, consumption of total fat, saturated fatty acids, cholesterol, and sodium decreased and that of carbohydrates, Vitamins B1, B12, C, E, and folate, potassium, iron, magnesium, copper, and dietary fiber increased with age.[26] In another study, the score of unhealthy diet decreased in Finnish women aged 50-60 years over a 20-year period.[27]
This was the first study examining the association between age and CVD risk factors in younger ages while exploring lifestyle habits and dietary intakes. Our results showed that age is an important factor in increasing the risk of CVD even in young ages. Following healthy lifestyle and dietary habits may partially prevent age-related increase of CVD risk factors if these habits can prevent an age-related increase in abdominal obesity particularly WHtR.
CONCLUSIONS
Age-related increase of CVD risk factors occurred independent of lifestyle and dietary habits. WHtR, but not BMI, may partially contribute to the age-related increase in CVD risk factors.
Financial support and sponsorship
Nil.
Conflicts of interest
There are no conflicts of interest.
Acknowledgements
The present article was extracted from the thesis written by Majid Kamali and was approved by Research Deputy of Shiraz University of Medical Sciences (Approval No. 92-6865).
REFERENCES
- 1.World Health Organization. Cardiovascular diseases fact sheet. 2015. [Last updated on Jan 2015]. Available from: http://www.who.int/mediacentre/factsheets/fs317/en/
- 2.Wald NJ, Simmonds M, Morris JK. Screening for future cardiovascular disease using age alone compared with multiple risk factors and age. PLoS One. 2011;6:e18742. doi: 10.1371/journal.pone.0018742. [DOI] [PMC free article] [PubMed] [Google Scholar]
- 3.Go AS, Mozaffarian D, Roger VL, Benjamin EJ, Berry JD, Borden WB, et al. Heart disease and stroke statistics – 2013 update: A report from the American Heart Association. Circulation. 2013;127:e6–245. doi: 10.1161/CIR.0b013e31828124ad. [DOI] [PMC free article] [PubMed] [Google Scholar]
- 4.Singhal A. Early growth and later atherosclerosis. World Rev Nutr Diet. 2013;106:162–7. doi: 10.1159/000342580. [DOI] [PubMed] [Google Scholar]
- 5.Wilson PW, D’Agostino RB, Levy D, Belanger AM, Silbershatz H, Kannel WB. Prediction of coronary heart disease using risk factor categories. Circulation. 1998;97:1837–47. doi: 10.1161/01.cir.97.18.1837. [DOI] [PubMed] [Google Scholar]
- 6.Ghosh A, Bhagat M, Das M, Bala SK, Goswami R, Pal S. Prevalence of cardiovascular disease risk factors in people of Asian Indian origin: Age and sex variation. J Cardiovasc Dis Res. 2010;1:81–5. doi: 10.4103/0975-3583.64441. [DOI] [PMC free article] [PubMed] [Google Scholar]
- 7.Stoner L, Stoner KR, Young JM, Fryer S. Preventing a cardiovascular disease epidemic among Indigenous populations through lifestyle changes. Int J Prev Med. 2012;3:230–40. [PMC free article] [PubMed] [Google Scholar]
- 8.Herder R, Demmig-Adams B. The power of a balanced diet and lifestyle in preventing cardiovascular disease. Nutr Clin Care. 2004;7:46–55. [PubMed] [Google Scholar]
- 9.Cho HJ, Khang YH. Family affluence scale, other socioeconomic position indicators, and self-rated health among South Korean adolescents: Findings from the Korea youth risk behavior web-based survey (KYRBWS) J Public Health. 2010;18:169–78. [Google Scholar]
- 10.Lee PH, Macfarlane DJ, Lam TH, Stewart SM. Validity of the international physical activity questionnaire short form (IPAQ-SF): A systematic review. Int J Behav Nutr Phys Act. 2011;8:115. doi: 10.1186/1479-5868-8-115. [DOI] [PMC free article] [PubMed] [Google Scholar]
- 11.World Health Organization. Measuring Obesity. classification and Description of Anthropometric Data. Report on a WHO Consultation on the Epidemiology of Obesity, Warsaw, 21.23. October, 1987. Nutrition Unit. Document, EUR/ICP/NUT 125. Copenhagen, Denmark: WHO; 1989. [Google Scholar]
- 12.Azizi F, Hadaegh F, Khalili D, Esteghamati A, Hosseinpanah F, Delavari A, et al. Appropriate definition of metabolic syndrome among Iranian adults: Report of the Iranian National Committee of Obesity. Arch Iran Med. 2010;13:426–8. [PubMed] [Google Scholar]
- 13.Alberti KG, Zimmet P, Shaw J IDF Epidemiology Task Force Consensus Group. The metabolic syndrome – A new worldwide definition. Lancet. 2005;366:1059–62. doi: 10.1016/S0140-6736(05)67402-8. [DOI] [PubMed] [Google Scholar]
- 14.Esfahani FH, Asghari G, Mirmiran P, Azizi F. Reproducibility and relative validity of food group intake in a food frequency questionnaire developed for the Tehran lipid and glucose study. J Epidemiol. 2010;20:150–8. doi: 10.2188/jea.JE20090083. [DOI] [PMC free article] [PubMed] [Google Scholar]
- 15.Ghaffarpour M, Houshiar-Rad A, Kianfar H. The manual for household measures, cooking yields factors and edible portion of foods. Tehran, Iran: Keshaverzi Press; 1999. [Google Scholar]
- 16.Cardi M, Munk N, Zanjani F, Kruger T, Schaie KW, Willis SL. Health behavior risk factors across age as predictors of cardiovascular disease diagnosis. J Aging Health. 2009;21:759–75. doi: 10.1177/0898264309333312. [DOI] [PMC free article] [PubMed] [Google Scholar]
- 17.Ataíde Lima RP, de Carvalho Pereira D, Pordeus Luna RC, Gonçalves Mda C, de Lima RT, Filho MB, et al. BMI, overweight status and obesity adjusted by various factors in all age groups in the population of a city in Northeastern Brazil. Int J Environ Res Public Health. 2015;12:4422–38. doi: 10.3390/ijerph120404422. [DOI] [PMC free article] [PubMed] [Google Scholar]
- 18.Andreenko E, Mladenova S, Akabaliev V. Anthropometric obesity indices in relation to age, educational level, occupation and physical activity in Bulgarian men. Nutr Hosp. 2014;31:658–65. doi: 10.3305/nh.2015.31.2.8016. [DOI] [PubMed] [Google Scholar]
- 19.Sfar S, Laporte F, Braham H, Jawed A, Amor S, Kerkeni A. Influence of dietary habits, age and gender on plasma fatty acids levels in a population of healthy Tunisian subjects. Exp Gerontol. 2010;45:719–25. doi: 10.1016/j.exger.2010.05.003. [DOI] [PubMed] [Google Scholar]
- 20.Haveman-Nies A, de Groot LC, van Staveren WA. Dietary quality, lifestyle factors and healthy ageing in Europe: The SENECA study. Age Ageing. 2003;32:427–34. doi: 10.1093/ageing/32.4.427. [DOI] [PubMed] [Google Scholar]
- 21.Sung KC, Ryu S, Reaven GM Health Screening Group at Kangbuk Samsung Hospital. Relationship between obesity and several cardiovascular disease risk factors in apparently healthy Korean individuals: Comparison of body mass index and waist circumference. Metabolism. 2007;56:297–303. doi: 10.1016/j.metabol.2006.09.016. [DOI] [PubMed] [Google Scholar]
- 22.Shields M, Tremblay MS, Connor Gorber S, Janssen I. Abdominal obesity and cardiovascular disease risk factors within body mass index categories. Health Rep. 2012;23:7–15. [PubMed] [Google Scholar]
- 23.Ness-Abramof R, Apovian CM. Waist circumference measurement in clinical practice. Nutr Clin Pract. 2008;23:397–404. doi: 10.1177/0884533608321700. [DOI] [PubMed] [Google Scholar]
- 24.Browning LM, Hsieh SD, Ashwell M. A systematic review of waist-to-height ratio as a screening tool for the prediction of cardiovascular disease and diabetes: 0·5 could be a suitable global boundary value. Nutr Res Rev. 2010;23:247–69. doi: 10.1017/S0954422410000144. [DOI] [PubMed] [Google Scholar]
- 25.Bezerra IN, Goldman J, Rhodes DG, Hoy MK, Moura Souza AD, Chester DN, et al. Difference in adult food group intake by sex and age groups comparing Brazil and United States nationwide surveys. Nutr J. 2014;13:74. doi: 10.1186/1475-2891-13-74. [DOI] [PMC free article] [PubMed] [Google Scholar]
- 26.Schröder H, Marrugat J, Covas M, Elosua R, Pena A, Weinbrenner T, et al. Population dietary habits and physical activity modification with age. Eur J Clin Nutr. 2004;58:302–11. doi: 10.1038/sj.ejcn.1601782. [DOI] [PubMed] [Google Scholar]
- 27.Haapala I, Prättälä R, Patja K, Männikkö R, Hassinen M, Komulainen P, et al. Age, marital status and changes in dietary habits in later life: A 21-year follow-up among Finnish women. Public Health Nutr. 2012;15:1174–81. doi: 10.1017/S1368980012000602. [DOI] [PubMed] [Google Scholar]