Abstract
Introduction
Sézary Syndrome is one of the most common forms of CTCL. It is characterized by skin infiltration of malignant T-cells. We examined Interleukin-16, a potent T-cell chemoattractant and cell-cycle regulator, as a prospective marker of disease onset and stage.
Methods
The correlation of total intracellular Interleukin-16 and surface CD26 was studied by flow cytometry. Confocal microscopy was performed to determine localization of Interleukin-16 at different stages of the disease. The levels of Interleukin-16 in plasma and culture supernatants were examined by enzyme linked immunoassay. Additionally, lymphocytes from stage IB patients were cultured in the presence of Interleukin-16 alone and in combination with Interleukin-15, and their ability to survive and proliferate was determined by cell counts and [3H]TdR incorporation.
Results
The data indicate that loss of both nuclear and intracellular pro-Interleukin-16 highly correspond to disease stage, with a concomitant increase in secreted mature Interleukin-16 in both culture supernatants and patients’ plasma that peaks at stage IB. Loss of intracellular Interleukin-16 strongly corresponded to loss of surface CD26, which has been shown to occur with more advanced stage of CTCL. Nuclear translocation of pro-Interleukin-16 was not observed in late stages of Sézary Syndrome, indicating this loss is not reversible.
Conclusions
We propose that it is feasible to use plasma levels of IL-16 as a potential diagnostic marker of Sézary Syndrome, and to use loss of intracellular IL-16 as a prognostic indicator of disease severity and stage.
Keywords: Cutaneous T-cell lymphoma, Sézary Syndrome, Interleukin-16, caspase 3, CD26, malignant T-cells
Introduction
Cutaneous T-cell lymphoma (CTCL) is a rare T cell-malignancy affecting about 7.7 people per 1,000,000 in the United States (1). It belongs to a class of non-Hodgkin’s lymphomas, but is caused by malignant T cells and not B cells. In the U.S., there are about 58,870 new cases of non-Hodgkin lymphoma per year, and of these, approximately 1,500 are diagnosed as CTCL (2–5).
CTCL describes a spectrum of clinical variants characterized by a skin infiltration of malignant populations of T cells (6). These variants have been given subtype classifications. To alleviate confusion between different classification systems for CTCL subtypes, the World Health Organization (WHO) and the European Organization for Research and Treatment of Cancer (EORTC) recently combined their methodologies into what is now known as the WHO-EORTC classification (7). Under this system, there are 17 distinct CTCL subtypes. Recently, it has been described that different T cell subsets contribute to these different CTCL subtypes and pathologies (8). Further disease progression involves the recirculation compartments, including lymph nodes and peripheral blood, and the tumor may finally spread to the visceral organs. Of note, CTCL does not always progress, and some patients who do have progressive disease do not always follow the stage progression in a continuous fashion but can skip intermediate stages.
A definitive diagnosis of CTCL can be established when the atypical lymphoid infiltrate demonstrates clinical and histological features with evidence of T-cell clonality. The key event in the migratory patterns of the T-cells appears to be mediated by expression of the cutaneous lymphocyte antigen (CLA) marker (9). Naive (i.e., CD45Ra-positive) T-cells that encounter their specific antigen in draining lymph nodes of the skin differentiate into activated/memory (i.e., CD45Ro-positive) T-cells and express CLA. Once returned to the blood, CLA-positive T-cells can encounter their ligand E-selectin on dermal endothelial cells for recruitment back into the skin during an inflammatory response (10). CLA-positive T-cells mediate many inflammatory skin disorders, including psoriasis, atopic dermatitis, and cutaneous graft-versus-host disease (11). In more advanced stages of CTCL, the malignant T-cells usually lose their dependence on the skin environment, and more of them are found in the peripheral blood (i.e., “leukemic” CTCL) and lymph nodes (2). Chemokine receptors are involved in tissue-specific homing of T cells to the skin and play an important role in the pathophysiology of cutaneous lymphoma; for instance it has recently been reported that the chemokine CCL27 expressed by keratinocytes attracts lymphocytes bearing the chemokine receptor CCR10 (12, 13).
The immunophenotype of the T cell lymphomas may vary, but most often the tumors have an activated/memory T-helper cell phenotype; this is characterized by surface expression of CD3, CD4, CD8, CD45Ro, and T-cell receptor–alpha-beta (TCR-alpha-beta). CD26 has been shown to be downregulated in advanced stages of CTCL (13–15). CD7 loss has been shown as well, but its correlation with disease stage is controversial (16). Furthermore, upregulation of CD25, the high affinity IL-2 receptor, has been reported in advanced stages of CTCL (17). Previous reports have shown that IL-2, IL-7 and IL-15 function as growth and survival factors for CTCLs (18–23). Mutations associated with CTCL include Fas and pro-IL-16 (24); p53, p15, p16; JunB and PTEN mutations are also often found in CTCL, but these are thought to be secondary mutations (25, 26).
One of the most common CTCL subtypes is Mycosis Fungoides (MF), so named for the mushroom-like skin tumors that arise from the skin-resident malignant T cells (10). Approximately 10% of MF cases progress to peripheral involvement, while the majority of cases remain confined to the skin. The term Sézary Syndrome (SS) is used to describe another, more aggressive, CTCL subtype comprised of a combination of lymphocytic leukemia, lymphadenopathy, and generalized exfoliative erythroderma (2–5). New data demonstrate that SS is a malignancy of central memory T cells and MF is a malignancy of skin resident effector memory T cells, not two stages of the same disease as was postulated earlier (8).
Interleukin-16 (IL-16) is a pleiotropic cytokine that functions as a chemoattractant and a modulator of T cell activation (27, 28). There are three main forms of IL-16, including the mature secreted form, a pro-form that acts as a transcriptional repressor, and a neuronal form (29). The pro-form of IL-16 contains PDZ domains at its N terminus that allow for nuclear localization (30). Once inside the nucleus, pro-IL-16 is able to regulate T cell proliferation via repression of transcription of Skp2; this allows for p27-KIP1 dependent G0/G1 arrest (31). Mutations in the PDZ domains of pro-IL-16 prevent nuclear translocation, and are associated with Sézary Syndrome (32). Pro-IL-16 can be cleaved by caspase 3 to its mature form, which is secreted from the cell (33). Secreted IL-16 binds to and signals through CD4 to induce a migratory response in CD4+ T cells (34–37).
Currently, the precise downstream pathogenic events of MF, SS and other CTCL subtypes are unknown. Based on its role as a regulator of T-cell proliferation and migration, we examined the role of IL-16 in early stage SS cases and its potential association with disease stage. In this study we investigate how loss of intracellular IL-16 in peripheral blood T cells corresponds to loss of surface CD26, and that IL-16 may be detected in both SS culture supernatants and patient plasma. The observed changes were highly correlated with the stage of lymphoma. Therefore, we propose that IL-16 could be used as a diagnostic and prognostic marker of SS.
Methods
Patient sample and blood collection
Cutaneous T-cell lymphoma patients were recruited from the Arizona Cancer Center (AZCC) and the Dana Farber Cancer Institute (DFCI), Harvard Medical School, Specialized Cutaneous Oncology Clinic. Healthy donors were recruited at Boston University Medical Center (BUMC). Specific information regarding demographics, characteristics of the disease including time interval to diagnoses, clinical and histological features, as well as and therapeutic information was recorded. All protocols and procedures have been approved by the IRB committees at the BUMC, AZCC and the DFCI.
Peripheral blood samples (8–15 ml) from consented patients and/or healthy donors were collected into the 8 ml green top VACUTAINER® (BD, Franklin Lakes, NJ) in the presence of sodium heparin. The tubes were shipped in ambient conditions either by FedEx priority overnight (from ACC), or by courier for same day delivery (from DFCI). The tubes first were centrifuged at 2000 rpm for 10 min and the plasma was removed, aliquoted and kept at −20°C for IL-16 ELISA assay. The remaining volume of blood after plasma removal was reconstituted with equal volume of serum-free RPMI-1640 (Gibco, Rockville, MD), supplemented with 100 U/ml penicillin (Gibco, Rockville, MD), 100 μg/ml streptomycin (Gibco, Rockville, MD) and Glutamax (Gibco, Rockville, MD), and further diluted twice in the same medium.
Cell separation and stimulation
Peripheral blood mononuclear cells (PBMCs) were isolated by Ficoll-Hypaque (Amersham Biosciences, Piscataway, NJ) density gradient separation (specific gravity 1.077 g/ml) for 35 minutes at 800 × g. After overnight incubation, the non-adherent PBMCs were used for further assays. The cell population contained mostly T-lymphocytes with a small contaminating population of B-lymphocytes.
The PBMCs were cultured in RPMI-1640 growth medium (Gibco, Rockville, MD) supplemented with 100 U/ml penicillin (Gibco, Rockville, MD), 100 μg/ml streptomycin (Gibco, Rockville, MD), and 10% Fetal Bovine Serum (FBS) (Atlanta Biologicals, Atlanta, GA).
T-lymphocyte activation and proliferation was most commonly achieved by co-stimulation with plate-bound human anti-CD3 (5 μg/ml) (eBioscience, San Diego, CA) and human anti-CD28 (5 μg/ml) (eBioscience, San Diego, CA). Other stimuli used included IL-2; IL-7; IL-15; IL-16 (10 ng/ml) (R&D Systems, Inc., Minneapolis, MN) and their combinations.
Cells were seeded in triplicate at a concentration of 2 ×10⁵ cells per well in 100 μl RPMI-1640 with 10% FBS (Atlanta Biologicals, Atlanta, GA), 100 U/ml penicillin (Gibco, Rockville, MD), and 100 μg/ml streptomycin (Gibco, Rockville, MD). Cells were pulsed with 1 μCi per well [3H]TdR for the last 16 hours of incubation and then harvested onto membranes using a cell harvester. The incorporated [3H]TdR was measured using a liquid scintillation counter (LKB Wallac, Finland).
IL-16 ELISA
This assay was performed using the Quantikine Human IL-16 Immunoassay kit (R&D Systems, Inc., Minneapolis, MN) according to manufacturer’s protocol. Briefly, this method employs the quantitative sandwich enzyme immunoassay technique. A monoclonal antibody specific for IL-16 had been pre-coated onto a 96 well microplate. Standards, undiluted plasma and/or culture supernatants were added to the wells (100 μl/well), and any IL-16 present was bound to the immobilized antibody. After washing away any unbound substances, an enzyme-linked polyclonal antibody was added to the wells (200 μl/well). Following a wash to remove any unbound antibody-enzyme reagent, a substrate solution was added to the wells (200 μl/well) and color develops in proportion to the amount of IL-16 bound in the initial step. The color development was stopped (with 50 μl/well stop solution), and the intensity of the color was measured by determining the optical density at 450 nm with correction to 570 nm with a VMax kinetic Microplate reader (Molecular Devices, Sunnyvale, CA). The final concentrations of IL-16 in plasma were calculated based on standard curve values.
Flow Cytometry
For single- or double- fluorescence analysis, 5×10⁵ cells were harvested by centrifugation, washed in phosphate-buffered saline (PBS) (Gibco, Rockville, MD), and incubated for 30 min at +4°C with 1–5 μg of each fluorochrome-conjugated monoclonal antibody (BD Pharmingen, eBioscience and/or BioLegend). Cells were then washed with PBS and fixed with 1% paraformaldehyde in PBS before analysis by flow cytometry. For intracellular IL-16 staining, cells were permeabilized for 30 min at +4°C in Fix/Perm buffer (BD Biosciences, San Jose, CA) and then labeled with monoclonal antibodies. All flow cytometry analyses were carried out on the LSR II (BD Biosciences, San Jose, CA) using BD FacsDiva Software (BD Biosciences, San Jose, CA). Data were analyzed using FlowJo version 7.6.1 software and are presented as tables and/or histograms.
Intracellular localization of IL-16
The intracellular localization of IL-16 was investigated as described with some modifications. (35). Briefly, isolated lymphocytes were resting overnight in suspension and after a short cytospin procedure (500 rpm for 4 min) they were applied to a microscope slides and fixed in 3.9% paraformaldehyde (Sigma Aldrich, St. Louis, MO) in PBS (Cellgro, Manassas, VA) for 30 min. Cells were washed in PBS, incubated in 0.1 M glycine (Sigma Aldrich, St. Louis, MO) for 10 min, washed in PBS, and permeabilized with 0.05% saponin (Sigma Aldrich, St. Louis, MO) for 30 min. Samples were blocked with 10% donkey serum (Dako, Carpinteria, CA) for 30 min and incubated for 1 hour with primary antibodies (38).
Primary antibodies included murine monoclonal anti-human IL-16 antibody (anti-C terminus-IL-16) (clone 14.1) (10 μg/ml), rabbit polyclonal anti-human Pro-IL-16 antibody (anti-N terminus-Pro-IL-16) (10 μg/ml), and isotype control antibodies. Anti-C-IL-16 recognizes the C-terminal end (121 amino acids) following caspase 3 cleavage. Anti-N-Pro-IL-16 recognizes full-length Pro-IL-16 and the N-terminal end (510 amino acids) following caspase 3 cleavage. Secondary antibody was added for 30 min at room temperature.
Secondary antibodies included Alexa Flour 555 goat anti-mouse antibody (40 μg/ml) (Molecular Probes, Eugene, OR) and FITC-conjugated goat anti-rabbit antibody (40 μg/ml) (Zymed Laboratories, South San Francisco, CA). Finally, SlowFade Anti-Fade solution with DAPI (Molecular Probes, Eugene, OR) was added, and the sample was covered and sealed. Microscopy was performed using a Bio-Rad Radiance 2000 laser scanning confocal microscope with Nikon 60x N.A.1.4 optics (38).
Statistical analysis
All values were expressed as the mean + standard error. Statistical analyses were performed with one-way ANOVA or correlation analysis using GraphPad Prism software version 5, and P<0.05 was considered significant.
Results
Loss of intracellular Interleukin 16 corresponds to disease stage
The Sézary patients from the AZCC and the DFCI and normal donors from BUMC enrolled in the study are presented in Table 1.
Table I.
Clinical characteristics of SS CTCL patients.
| Disease Stage | No. Subjects | Average Age (yrs) | Gender |
|---|---|---|---|
| IA | 6 | 59.7 | 1F/5M |
| IA/B | 3 | 69.7 | 1F/2M |
| IB | 7 | 60.9 | 2F/5M |
| II | 2 | 56.0 | 2M |
| III | 4 | 77.8 | 2F/2M |
| IV | 7 | 70.1 | 3F/4M |
| Totals | 28 | 65.7 | 9F/19M |
| Controls | 35 | 59.7 | 13F/22M |
According to the World Health Organization (WHO) and the European Organization for Research and Treatment of Cancer (EORTC) combined staging classification. Table depicts patients’ stage at the time of enrollment.
To establish whether intracellular IL-16 levels correlated with disease stage, peripheral blood mononuclear cells (PBMCs) were isolated, cultured, and non-adherent cells were used to assess IL-16 levels via flow cytometric analysis. The cells were first stained with PerCP-Cy5.5 conjugated anti-CD3 antibodies, then fixed and permeabilized prior to staining with allophycocyanin-conjugated anti-IL-16 antibodies. T cells were gated based on CD3 expression and then were analyzed for intracellular IL-16 expression. It was determined that approximately 80% of T lymphocytes from normal donors were IL-16 positive. This percent was similar for the stage 1A patients; however, analysis of cells from patients with more advanced disease demonstrated loss of intracellular IL-16 that correlated with disease progression (Figure 1; one-way ANOVA P=0.002). Cells from stage II patients routinely demonstrated a 40% decrease in total IL-16 levels with T cells from stage III and IV patients demonstrating an approximate 50% loss.
Figure 1.
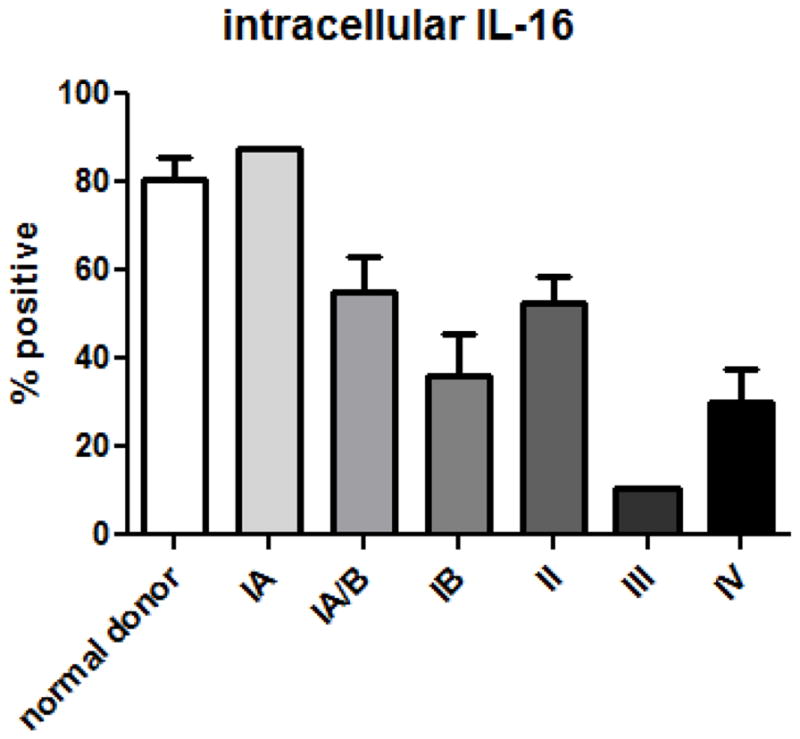
Loss of interleukin-16 corresponds to SS stage. Cells were gated on CD3 expression, then on intracellular IL-16; P=0.002, one way ANOVA. Number of donors: normal = 5, stage IA = 2, stage IA/B = 3, stage IB = 6, stage II = 2, stage III = 2, stage IV = 5.
Loss of total intracellular IL-16 is accompanied by a shift in localization
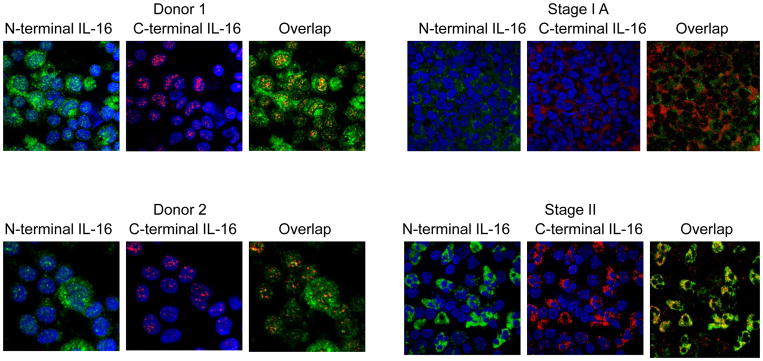
To further investigate the decrease in intracellular IL-16 levels, cells were assessed for intracellular distribution. Isolated cells from CTCL patients were labeled with antibodies that recognize both the N- (pro- form) and C- (pro- and mature forms) termini of IL-16. IL-16 is processed during T cell activation into a mature and pro-IL-16 form and therefore detection using only one antibody may not represent the actual protein level. DAPI was used to stain nuclei. As has been reported previously, T cells from normal individuals contain pro-IL-16 (detected by N and C terminal staining) that localizes both in the nucleus and cytoplasm with mature (secreted) IL-16 localizing primarily in the cytosol (stains positive only for C-termini of IL-16) (30). It was identified that stage IA cells appear to have the same IL-16 distribution as normal cells (Figure 2). However, stage II cells demonstrated a detectable change in distribution whereby IL-16 was not detected, or demonstrated greatly reduced expression, in the nucleus. This data suggests that a transition had occurred before or by stage II that either prevented nuclear entrance of pro-IL-16 or an accelerated egress or breakdown of pro-IL-16 once in the nucleus.
Figure 2.
Localization of pro-IL-16 and mature IL-16 in malignant versus normal T cells. The N-terminal antibody (green) recognizes the pro-form of IL-16, whereas the C-terminal antibody (red) recognizes both the pro- and mature cleaved forms of IL-16. Donors 1 and 2 are normal and display nuclear pro-IL-16 and cytoplasmic mature IL-16. Stage IA SS patients demonstrate reduced nuclear pro-IL-16 staining when compared to normal donors. Stage II SS patients no longer display nuclear localization of pro-IL-16. No nuclear translocation of IL-16 after stage II was observed. The images shown are the most representative ones taken from at least three patient samples.
Loss of intracellular IL-16 correlates with loss of CD26
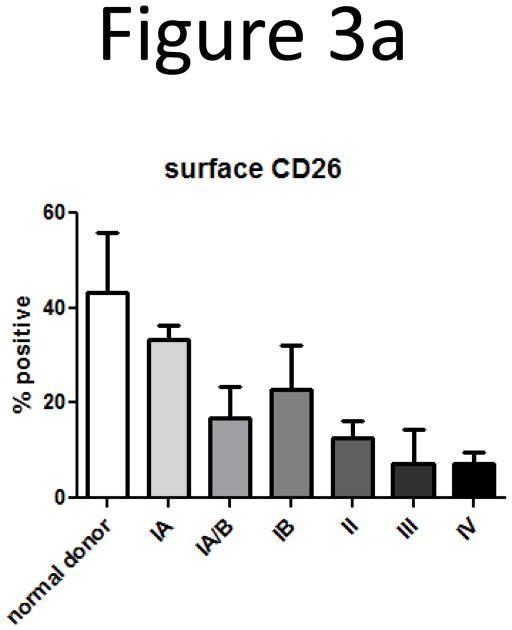
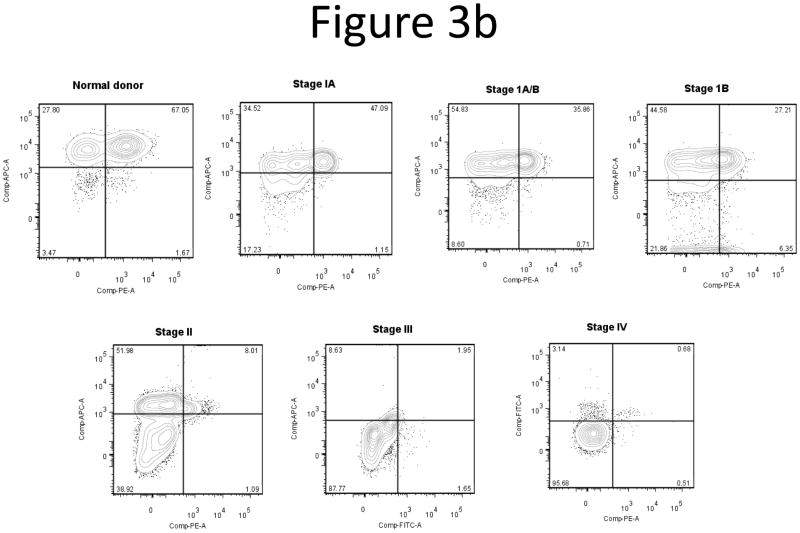
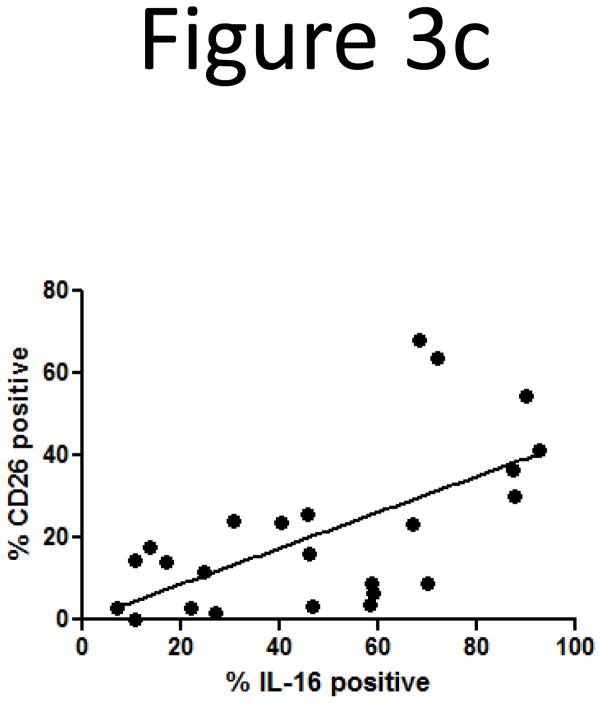
Since the loss of intracellular IL-16 correlated with CTCL stage, we next correlated loss of IL-16 with loss of surface expression of CD26, another marker of CTCL (13, 14). Based on this data and our observation that there is a loss of nuclear and intracellular IL-16 according to CTCL stage, we wanted to determine if loss of CD26 coincides with loss of intracellular IL-16. Non-adherent PBMCs were stained with antibodies for CD3 and CD26 surface markers, then fixed and permeabilized and stained with antibodies for IL-16. We confirmed decreases in expression of surface CD26 coincident with progression of CTCL stage (Figure 3a). Multicolor flow cytometric analysis showed that T-lymphocytes that lost intracellular IL-16 also demonstrated a concomitant loss of surface CD26 (Figure 3b). A correlation analysis between intracellular IL-16 levels and surface CD26 levels yielded a statistically significant correlation (Figure 3c; correlation coefficient = 0.403; P=0.002). The loss of surface CD7 and gain of surface CD25 were not correlated with loss of intracellular IL-16 (data not shown) (8, 9, 12).
Figure 3.
Loss of surface CD26 correlates with disease stage and loss of intracellular IL-16.
A) Loss of surface CD26 was determined by flow cytometry. Cells were gated on CD3 then analyzed for CD26 expression. Number of donors: normal = 4, stage IA = 2, stage IA/B = 3, stage IB = 6, stage II = 2, stage III = 2, stage IV = 5.
B) Demonstration of concordant loss of both intracellular IL-16 and surface CD26. Together with disease stage, we observed losses in both intracellular IL-16 and surface CD26. Quadrant gates were created based on isotype controls from individual experiments.
C) Correlation of loss of intracellular IL-16 and surface CD26 (correlation coefficient = 0.403; P=0.002). Number of donors: normal = 5, stage IA = 2, stage IA/B = 3, stage IB = 6, stage II = 1, stage III = 2, stage IV = 5.
Elevated IL-16 secretion in Sézary T cells
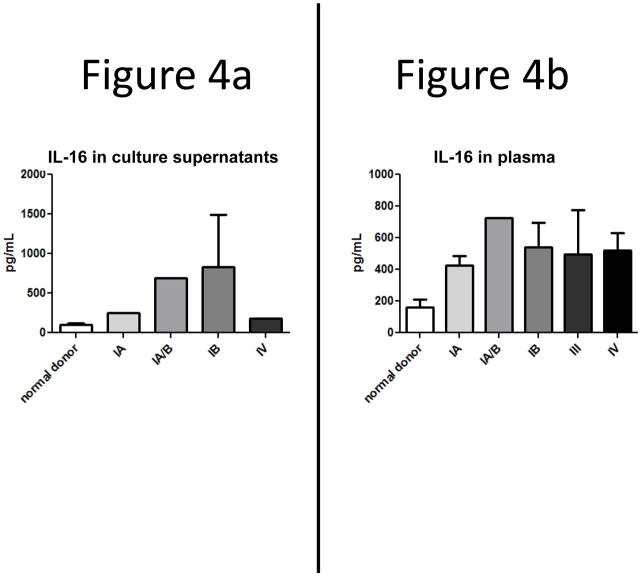
The loss of nuclear pro-IL-16 was accompanied by a relative increase in cytoplasmic IL-16 that was characterized primarily by N-terminal staining (Figure 2). The selective loss of C-terminal staining suggested that pro-IL-16 had been processed and the C-terminal (mature) form of IL-16 had been secreted. To investigate this possibility, patients’ T-cells were obtained from subjects at different stages of disease, isolated and cultured for 24–48 hr. The supernatants were then assessed for IL-16 protein by ELISA. As shown in Figure 4a, normal T-cells secreted low levels of detected IL-16 in unstimulated conditions; however secretion of IL-16 was elevated 2–7 fold in cells obtained from stage IA and IB patients, respectively. Stage IV patients also secreted IL-16 two-fold over normal levels.
Figure 4.
Secreted IL-16 is higher in SS patient cultures and plasma when compared to normal donors, and levels peak by stage IB.
A) IL-16 secretion by SS T cell cultures as determined by ELISA. Levels from patient cultures were higher than those from normal donor cultures. Number of donors: normal = 12, stage IA = 1, stage IA/B = 1, stage IB = 5, stage IV = 1.
B) Increased plasma levels of secreted mature IL-16 in SS. Patient plasma was subjected to sandwich ELISAs and it was determined that IL-16 secretion peaks by stage IB. Number of donors: normal = 31, stage IA = 2, stage IA/B = 1, stage IB = 5, stage III = 3 patients, stage IV = 6.
Correlation of secreted IL-16 levels in plasma with disease progression
The increase in IL-16 secretion in T-cells from patients beyond stage IA suggested the possibility that increased IL-16 levels could be detected in the periphery of these patients. Plasma was prepared from peripheral blood and IL-16 levels were determined by sandwich ELISA. We found an increased amount of IL-16 in patient plasma in all stages of SS with the greatest increase detected early in disease at stage IA (Fig. 4b). This data is consistent with the overall decrease in C terminal antibody detection of intracellular IL-16.
We also began examining the consequences of elevated IL-16 levels on the ability of CTCL T cells to survive and proliferate. The cultures were supplemented with IL-16 or combinations of IL-16 and the other known CTCL mitogens IL-2, IL-7 and IL-15. We found that CTCL cells from stage IB patients were able to survive and proliferate in cultures supplemented with IL-16 alone, and that combinations of IL-16 and IL-15 resulted in the best survival and proliferation (Appendix Figure 1).
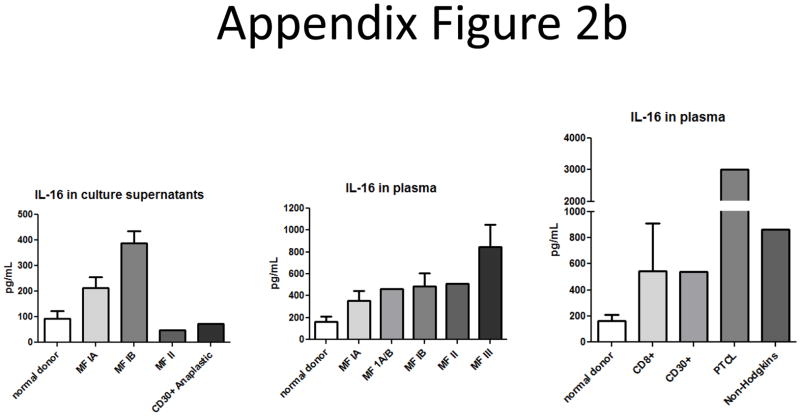
To determine if the correlations between IL-16, CD26 and stage were unique to the SS subtype of CTCL, we tested samples from other CTCL subtypes. We found that Mycosis Fungoides (MF) patient samples exhibited increased secreted IL-16 levels in both plasma and culture supernatants, as well as a loss of intracellular IL-16 and surface CD26 levels; however, the pattern of loss was different from that of SS. We also found that CD8+, CD30+, Peripheral T Cell Lymphoma (PTCL) and Non-Hodgkins Lymphomas also secrete IL-16. However, none of the other CTCL subtypes were able to proliferate in response to exogenous IL-16, indicating that while IL-16 may serve as a marker for other CTCL subtypes, it may not play a biological role in disease onset or progression and may therefore be less useful than for determination of SS diagnosis and prognosis (Appendix Figure 2).
Discussion
Our results demonstrate that loss of intracellular IL-16 in peripheral blood T-cells corresponds to lymphoma stage in SS patients. The identified loss appears to reach a significant level after stage IA and is consistent through stage IV. The main changes were observed in stage IB, which is most likely a crucial time point in CTCL progression. We also noted that patients did not regain normal levels of nuclear pro-IL-16, indicating that this event is not reversible. Therefore we propose to use intracellular levels of IL-16 as an additional diagnostic/prognostic marker to assess SS severity and stage.
Our data strongly indicate that loss of intracellular IL-16 correlates with loss of surface CD26. Mechanistically these events might be linked through Hepatocyte Nuclear Factor 1 (HNF1), which is the transcriptional activator of CD26 and caspase 3 (39, 40). High levels of HNF1 have been shown to lead to activation of caspase 3 (41). Since caspase 3 is involved in processing of pro-IL-16, and pro-IL-16 has been shown to have several transcriptionally related binding partners, it is possible that pro-IL-16 may be directly or indirectly associating with HNF1 to downregulate CD26 expression; alternatively, decreases in HNF1 protein may ultimately result in less surface CD26, less caspase 3 activation, and thus less IL-16 processing (31, 33, 42). Further studies would need to be conducted to examine the association of HNF1 and pro-IL-16, and to elucidate potential feedback loops between HNF1, caspase 3, and levels of IL-16 and CD26. Some current therapeutic agents that are under investigation for use in CTCL, including arsenic trioxide and bexarotene, involve activation of caspase 3 to induce apoptosis (43, 44). Caspase 3 is known as an effector caspase that is downstream of both intrinsic and extrinsic apoptotic pathways (45). Interestingly, apoptosis in CTCL has been shown to occur in both caspase independent and dependent manners (46). Therefore, future studies should also examine mechanisms governing caspase 3 activation of downstream apoptotic effector proteins versus pro-IL-16 processing.
Higher secreted IL-16 levels in plasma are also associated with early stages of CTCL. This is possibly due to accumulation of pro-IL-16 in the cytoplasm of the T cells, which also leads to caspase 3 processing of pro-IL-16 to the mature secreted form of the protein. In more advanced stages of CTCL, IL-16 secretion seems to drop off; this may be due to either a decrease in production of IL-16 protein over time, or exhaustion of caspase 3 activity. Furthermore, we showed that IL-16 in cytokine milieus can promote SS growth and survival. This is the indirect evidence that secreted IL-16 might be contributing to the disease via different mechanisms.
The other possible mechanism for the contribution of IL-16 to CTCL is IL-16’s ability to mediate cross-talk between T-lymphocytes and dendritic cells (47). Langerhans cells, skin-specific dendritic cells, have been shown to promote CTCL tumor growth and survival (48). It is possible that secretion of IL-16 by both T-lymphocytes and dendritic cells may be an additional important step in the pathogenesis of SS.
It is also possible that during the course of disease, a subset of IL-16-responsive cells exists defined by a coreceptor, which facilitates maximal migratory effect to secreted IL-16. A membrane receptor with a high probability of functioning as a coreceptor for IL-16/CD4 signaling is chemokine receptor 5 (CCR5). CD4+CCR5+ cells are prevalent at sites of inflammation; it was also reported that IL-16/CD4 stimulation and activation was enhanced in the presence of CCR5 (49). It was determined that CCR5 physically associates with CD4, and that IL-16 induces a greater migratory response in Th1 than Th2 subsets (49). Augmentation of IL-16 stimulation by CCR5 identifies an intimate functional relationship between CD4 and CCR5 that likely plays a role in regulation of Th1 cell recruitment and activation at sites of inflammation, specifically skin in MF patients, as opposed to Th2 cell recruitment in SS patients (26, 49). This is another objective for our future investigation of CTCL downstream mechanisms.
Conclusions and future directions
Elevated plasma levels of IL-16 in SS patients may serve as a diagnostic marker for disease onset and stage. The loss of intracellular IL-16 in concordance with loss of surface CD26 may serve as a prognostic marker for SS progression and proliferation of malignant T-cells. Elucidating how this protein functions in the pathogenesis of SS will provide a better understanding for developing new diagnostic/prognostic tools for this challenging hematological malignancy.
Acknowledgments
This work was supported by NIH R01CA122737-01A2.
All flow cytometric data were acquired using equipment maintained by the Boston University Medical Campus Core Facilities.
Abbreviations
- CTCL
Cutaneous T-cell Lymphoma
- IL-16
Interleukin-16
- HNF1
Hepatocyte nuclear factor 1
- MF
Mycosis Fungoides
- SS
Sézary Syndrome
Appendix
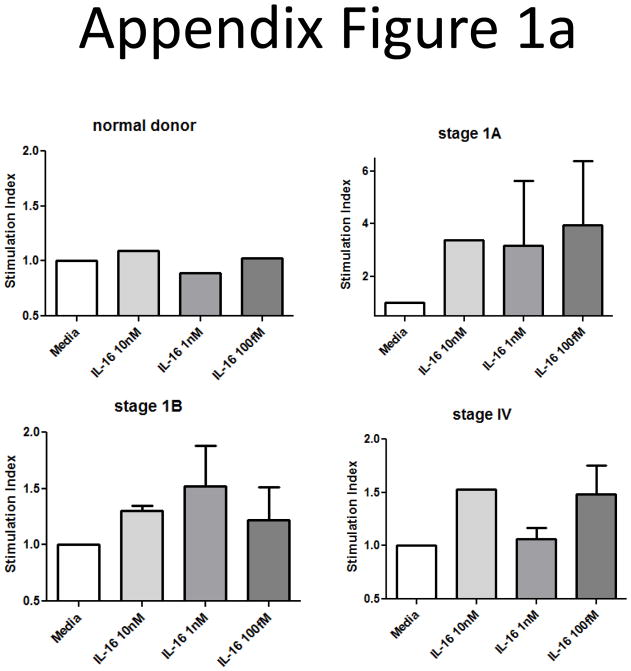
We began examining the consequences of the elevated IL-16 levels we found in patients’ plasma by determining whether or not IL-16 could serve as a survival factor or mitogen for SS malignancies. A dose response curve of IL-16 demonstrated that SS patients’ T-cells did proliferate following IL-16 treatment with a maximal effect at 1–10nM depending upon stage; normal donor cells did not respond to IL-16 at any dose (Appendix Figure 1a).
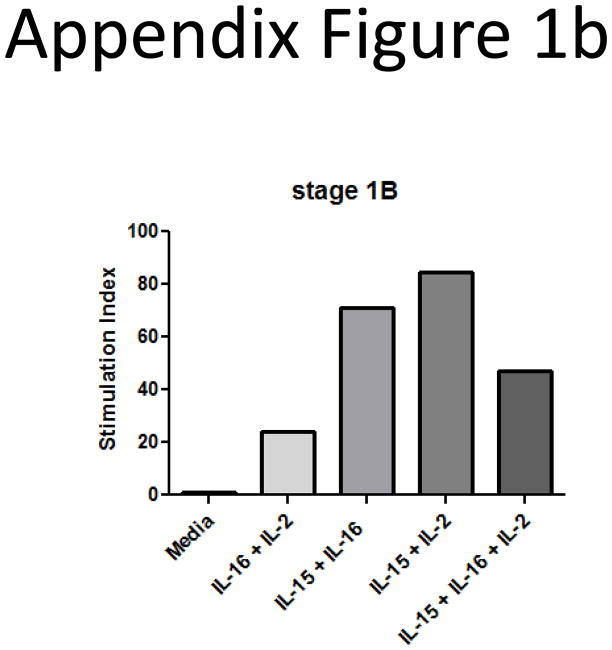
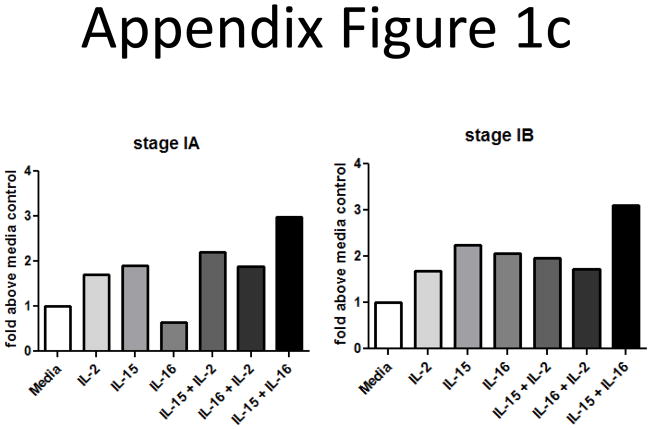
We also wanted to determine if combinations of IL-16 and other known CTCL mitogens could enhance this proliferative response. SS cells were cultured with combinations of IL-2, IL-7, IL-15 and IL-16. Cells that had been cultured for 1–2 weeks were assessed for proliferative index. We found that the combination of IL-15 and IL-16 seemed to induce the best proliferative responses (Appendix Figure 1b; 1c; the most representative experiments).
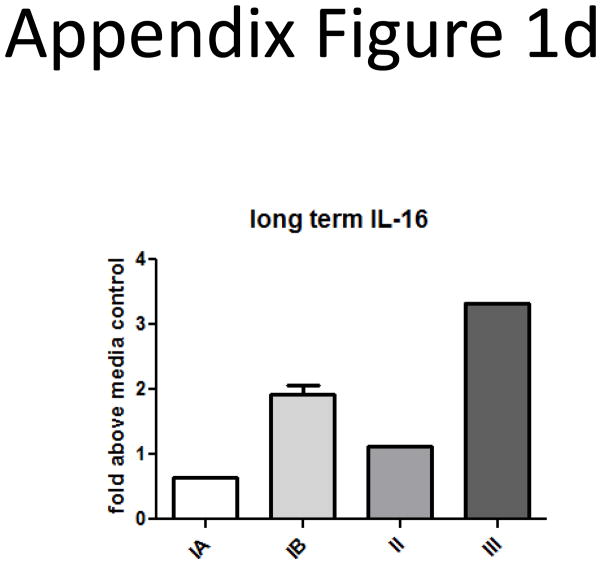
Finally, we performed long-term cultures (2–3 weeks) of SS cells with 10nM IL-16 and determined if it could serve as a survival factor. We found that IL-16 promoted survival for malignant cells from different disease stages (Appendix Figure 1d).
Taken together, our data indicate that most SS patients would have malignancies that respond to IL-16. This supports our hypothesis that IL-16 can serve as a marker for SS disease progression, as it demonstrates possible biological effects of secreted IL-16 that link it to cancer growth and survival.
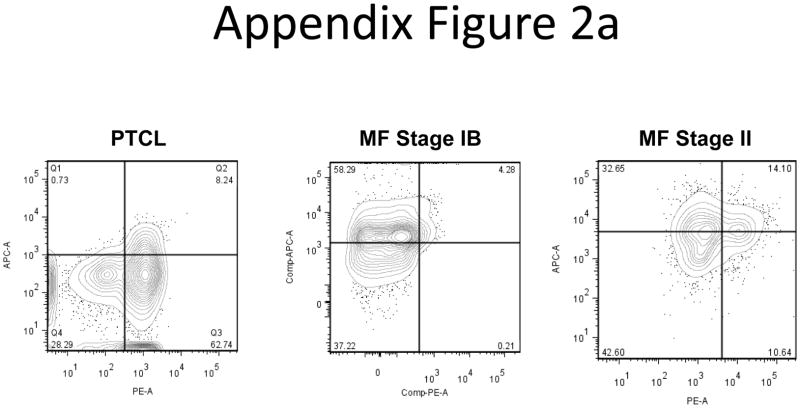
We tested other CTCL subtypes to determine whether or not our observations were unique to the SS subtype. The samples used for this analysis are represented in Appendix Tables I & II. We began by examining intracellular IL-16 and surface CD26 levels from a Peripheral T Cell Lymphoma (PTCL) patient and two Mycosis Fungoides (MF) patients. Seventy percent of the PTCL patient’s cells were CD26+ and 8.85% were IL-16 positive, a stage IB MF patient had 4.46% CD26+ and 62.31% IL-16+, and a stage II MF patient had 24.74% CD26+ and 46.75% IL-16+ lymphocytes. (Appendix Figure 2a). Flow data shows that the IL-16 and CD26 levels exhibit patterns distinct from SS samples.
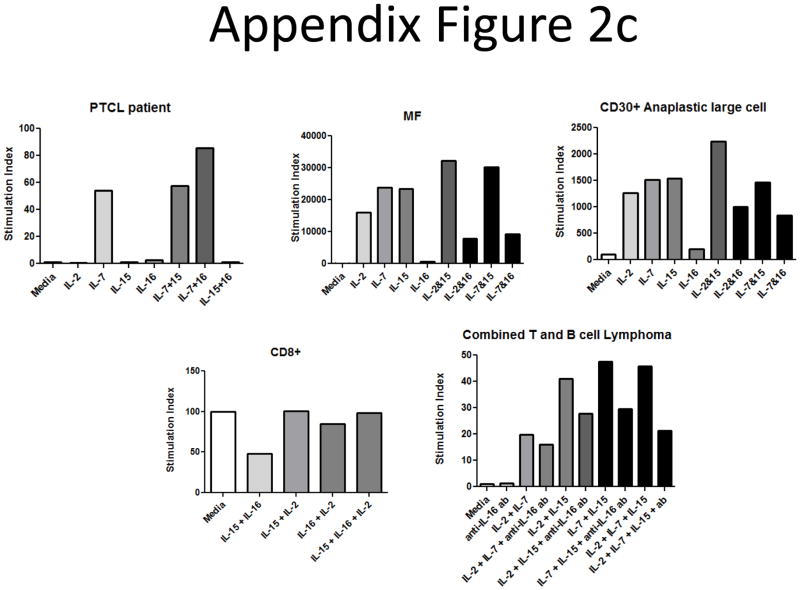
Secreted IL-16 levels from plasma and culture supernatant samples from other CTCL subtypes were measured by ELISA. We found increases in IL-16 levels when compared to normal donors for most CTCL patients (Appendix Figure 2b). We also tested the ability of several different CTCL subtypes to proliferate in response to IL-16 treatment (Appendix Figure 2c). We found that a PTCL patient seemed to respond best to a combination of IL-7 and IL-16, though the cells did not proliferate in response to IL-16 treatment alone. Cells from a MF patient and cells from a CD30+ Anaplastic large cell lymphoma did not proliferate in response to IL-16, and combinations of IL-16 with IL-2, IL-7 or IL-15 seemed to yield decreased responses when compared to known mitogens by themselves. A CD8+ lymphoma patient’s cells did not respond to any cytokines or combinations. Finally, cells from a combined T and B cell lymphoma patient did seem to require endogenous IL-16 to achieve maximal proliferative responses, as addition of a neutralizing antibody against IL-16 (clone 14.1) (30) resulted in decreased proliferative profiles. However, these levels were still above basal proliferative levels determined from media control wells. We also performed a long term culture analysis on cells from a MF patient and found that they did not respond to IL-16 alone or in combination with other mitogens (Appendix Figure 2d). This indicates that while IL-16 is secreted from other CTCL subtypes, it may not have a direct link to disease onset and progression since tumors are non-responsive.
Appendix Figure 1.
Proliferation and survival of SS cultures in response to IL-16.
A) Dose titration assays at 1, 10 or 100 nM IL-16 show that most stages of malignant T-cells proliferate in response to 10nM IL-16. Cells were cultured for 3 days in the presence of cytokines before addition of 1μCi [3H]TdR. Cultures were harvested 16 hours post-pulse, and cpm from 5 replicates were expressed as stimulation index of media control (baseline). (normal = 1 donor, stage 1A = 2 patients, stage 1B = 6 patients, stage IV = 3 patients).
B) CTCL mitogenic cytokine cocktails were tested in different types of T cell lymphomas. IL-2, IL-15 and IL-7 (10 ng/ml) were used separately or in combination with IL-16 (10nM). SS cultures responded best to the combinations of IL-15/IL-2, or IL-15/IL-16, as demonstrated by this stage IB patient.
C) CTCL mitogenic cytokine cocktails were tested for their ability to support SS long-term cultures. Cells from various stages all responded best to a combination of IL-15 and IL-16, as demonstrated by these three representative patients.
D) SS stages above IA were maintained with 10nM IL-16 in culture for 2 weeks. Cells were cultured in triplicate and counted on day 14 by Trypan blue exclusion; data are expressed as fold above media control wells. (n=1 representative patient per stage, except n=2 for stage IB).
Appendix Figure 2.
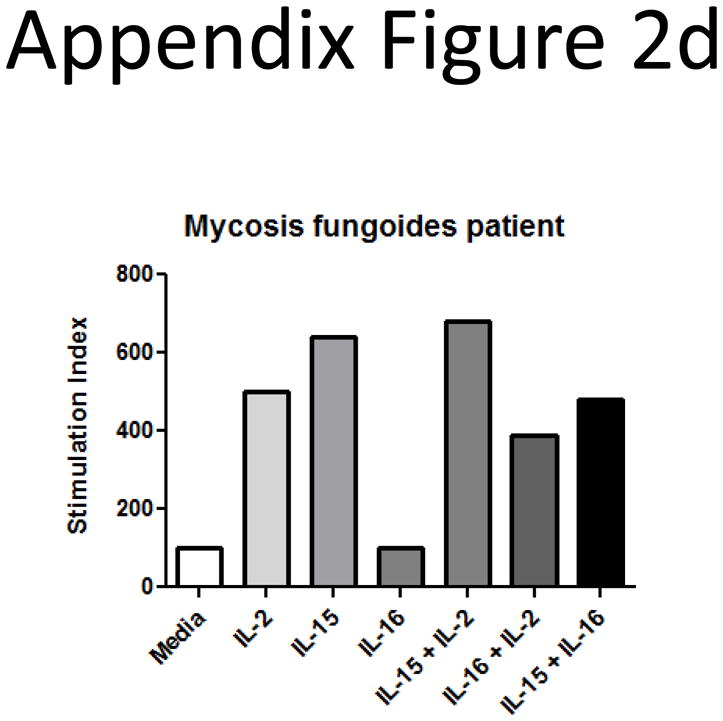
Other CTCL subtypes do not exhibit the same patterns of IL-16 loss or responsiveness.
A) Intracellular IL-16 and surface CD26 levels for a PTCL patient and two MF patients. Patterns of loss are distinct from that of the SS subtype.
B) Secreted IL-16 levels from cultures of MF stage IA (n=4), MF stage IB (n=5), MF stage II (n=1), and CD30+ Anaplastic large cell (n=1) CTCL subtypes are higher than normal donor cell culture supernatants (n=12) (left panel). Plasma IL-16 levels from MF stage IA (n=2), stage IA/B (n=1), stage IB (n=6), stage II (n=1), stage III (n=2), are higher than normal donor levels (n=31) (middle panel). Plasma IL-16 levels from CD8+ (n=2), CD30+ (n=1), PTCL (n=1), and Non-Hodgkin’s (n=1) lymphoma subtypes are also higher than normal donor levels (n=31) (right panel).
C) CTCL mitogenic cytokine cocktails were tested in different types of T cell lymphomas. IL-2, IL-15 and IL-7 (10 ng/ml) were used separately or in combination with IL-16 (10nM). No other CTCL subtypes exhibited increased responsiveness to IL-16 alone or in combination with other mitogens, except for a PTCL that responded to IL-16 in combination with IL-7 (representative donor for each subtype).
D) CTCL mitogenic cytokine cocktails were tested for their ability to support MF cells in long-term culture. IL-16 treatment was comparable to media controls, and combinations with IL-2 and IL-15 resulted in decreased proliferative responses (representative donor).
Appendix Table I.
Clinical characteristics of MF CTCL patients.
| Disease Stage | No. Subjects | Average Age (yrs) | Gender |
|---|---|---|---|
| IA | 4 | 53 | 3F/1M |
| IA/B | 2 | 36.5 | 2M |
| IB | 6 | 58 | 1F/5M |
| II | 4 | 62.5 | 1F/3M |
| III | 1 | 32 | M |
| IV | 0 | - | - |
| Totals | 17 | 48.4 | 5F/12M |
| Controls | 35 | 59.7 | 13F/22M |
According to the World Health Organization (WHO) and the European Organization for Research and Treatment of Cancer (EORTC) combined staging classification. Table depicts patients’ stage at the time of enrollment.
Appendix Table II.
Clinical characteristics of other CTCL subtypes.
| Lymphoma Subtype | No. Subjects (with stage) | Average Age (yrs) | Gender |
|---|---|---|---|
| CD8+ | 2 (both IB) | 63.5 | 2F |
| CD30+ | 2 (IB, IIB) | 57.5 | 2M |
| Non-Hodgkins | 2 (IB, III) | 68 | 2M |
| Peripheral T cell | 1 (deceased) | 74 | 1F |
| Totals | 7 | 65.75 | 3F/4M |
| Controls | 35 | 59.7 | 13F/22M |
According to the World Health Organization (WHO) and the European Organization for Research and Treatment of Cancer (EORTC) combined staging classification. Table depicts patients’ stage at the time of enrollment.
Footnotes
Competing interests:
The authors declare that they have no competing interests.
Authors’ contributions:
JR and MT, the co-first authors, wrote the manuscript; JR, MT and AP performed flow cytometric analysis and proliferation assays; MT performed confocal microscopy; MTawa, NA and EM collected patient samples at the Dana Farber Cancer Institute; LM collected patient samples at the Arizona Cancer Center; TK, KC and CCL contributed to initial study design and coordinated site studies; and WC contributed to initial study design and helped to draft the manuscript. All authors read and approved the final manuscript.
References
- 1.Bradford PT, Devesa SS, Anderson WF, Toro JR. Cutaneous lymphoma incidence patterns in the United States: a population-based study of 3884 cases. Blood. 2009;113:5064–5073. doi: 10.1182/blood-2008-10-184168. [DOI] [PMC free article] [PubMed] [Google Scholar]
- 2.Girardi M, Edelson RL. Cutaneous T-cell lymphoma: pathogenesis and treatment. Oncology (Williston Park) 2000;14:1061–1076. [PubMed] [Google Scholar]
- 3.Criscione VD, Weinstock MA. Incidence of cutaneous T-cell lymphoma in the United States, 1973–2002. Arch Dermatol. 2007;143:854–859. doi: 10.1001/archderm.143.7.854. [DOI] [PubMed] [Google Scholar]
- 4.Van Doorn R, Van Kester MS, Dijkman R, Vermeer MH, Mulder AA, Szuhai K, Knijnenburg J, Boer JM, Willemze R, Tensen CP. Oncogenomic analysis of mycosis fungoides reveals major differences with Sezary syndrome. Blood. 2009;113:127–136. doi: 10.1182/blood-2008-04-153031. [DOI] [PubMed] [Google Scholar]
- 5.Thangavelu M, Finn WG, Yelavarthi KK, Roenigk HH, Jr, Samuelson E, Peterson L, Kuzel TM, Rosen ST. Recurring structural chromosome abnormalities in peripheral blood lymphocytes of patients with mycosis fungoides/Sezary syndrome. Blood. 1997;89:3371–3377. [PubMed] [Google Scholar]
- 6.Dippel E, Klemke CD, Goerdt S. Current status of cutaneous T-cell lymphoma: molecular diagnosis, pathogenesis, therapy and future directions. Onkologie. 2003;26:477–483. doi: 10.1159/000072099. [DOI] [PubMed] [Google Scholar]
- 7.Willemze R, Jaffe ES, Burg G, Cerroni L, Berti E, Swerdlow SH, Ralfkiaer E, Chimenti S, Diaz-Perez JL, Duncan LM, Grange F, Harris NL, Kempf W, Kerl H, Kurrer M, Knobler R, Pimpinelli N, Sander C, Santucci M, Sterry W, Vermeer MH, Wechsler J, Whittaker S, Meijer CJ. WHO-EORTC classification for cutaneous lymphomas. Blood. 2005;105:3768–3785. doi: 10.1182/blood-2004-09-3502. [DOI] [PubMed] [Google Scholar]
- 8.Campbell JJ, Clark RA, Watanabe R, Kupper TS. Sezary syndrome and MF arise from distinct T cell subsets: a biologic rationale for their distinct clinical behaviors. Blood. 2010 doi: 10.1182/blood-2009-11-251926. Epub ahead of print. [DOI] [PMC free article] [PubMed] [Google Scholar]
- 9.Lonsdorf AS, Hwang ST, Enk AH. Chemokine receptors in T-cell-mediated diseases of the skin. J Invest Dermatol. 2009;129:2552–2566. doi: 10.1038/jid.2009.122. [DOI] [PubMed] [Google Scholar]
- 10.Girardi M, Heald PW, Wilson LD. The pathogenesis of mycosis fungoides. N Engl J Med. 2004;350:1978–1988. doi: 10.1056/NEJMra032810. [DOI] [PubMed] [Google Scholar]
- 11.Girardi M, Heald PW. Cutaneous T-cell lymphoma and cutaneous graft-versus-host disease. Two indications for photopheresis in dermatology. Dermatol Clin. 2000;18:417–423. viii. doi: 10.1016/s0733-8635(05)70190-x. [DOI] [PubMed] [Google Scholar]
- 12.Sokolowska-Wojdylo M, Wenzel J, Gaffal E, Lenz J, Speuser P, Erdmann S, Abuzahra F, Bowman E, Roszkiewicz J, Bieber T, Tuting T. Circulating clonal CLA(+) and CD4(+) T cells in Sezary syndrome express the skin-homing chemokine receptors CCR4 and CCR10 as well as the lymph node-homing chemokine receptor CCR7. Br J Dermatol. 2005;152:258–264. doi: 10.1111/j.1365-2133.2004.06325.x. [DOI] [PubMed] [Google Scholar]
- 13.Sokolowska-Wojdylo M, Wenzel J, Gaffal E, Steitz J, Roszkiewicz J, Bieber T, Tuting T. Absence of CD26 expression on skin-homing CLA+ CD4+ T lymphocytes in peripheral blood is a highly sensitive marker for early diagnosis and therapeutic monitoring of patients with Sezary syndrome. Clin Exp Dermatol. 2005;30:702–706. doi: 10.1111/j.1365-2230.2005.01904.x. [DOI] [PubMed] [Google Scholar]
- 14.Kelemen K, Guitart J, Kuzel TM, Goolsby CL, Peterson LC. The usefulness of CD26 in flow cytometric analysis of peripheral blood in Sezary syndrome. Am J Clin Pathol. 2008;129:146–156. doi: 10.1309/05GFG3LY3VYCDMEY. [DOI] [PubMed] [Google Scholar]
- 15.Wood GS. Lymphocyte activation in cutaneous T-cell lymphoma. J Invest Dermatol. 1995;105:105S–109S. doi: 10.1111/1523-1747.ep12316249. [DOI] [PubMed] [Google Scholar]
- 16.Murphy M, Fullen D, Carlson JA. Low CD7 expression in benign and malignant cutaneous lymphocytic infiltrates: experience with an antibody reactive with paraffin-embedded tissue. Am J Dermatopathol. 2002;24:6–16. doi: 10.1097/00000372-200202000-00002. [DOI] [PubMed] [Google Scholar]
- 17.Erber WN, Mason DY. Expression of the interleukin-2 receptor (Tac antigen/CD25) in hematologic neoplasms. Am J Clin Pathol. 1988;89:645–648. doi: 10.1093/ajcp/89.5.645. [DOI] [PubMed] [Google Scholar]
- 18.Dalloul A, Laroche L, Bagot M, Mossalayi MD, Fourcade C, Thacker DJ, Hogge DE, Merle-Beral H, Debre P, Schmitt C. Interleukin-7 is a growth factor for Sezary lymphoma cells. J Clin Invest. 1992;90:1054–1060. doi: 10.1172/JCI115920. [DOI] [PMC free article] [PubMed] [Google Scholar]
- 19.Foss FM, Koc Y, Stetler-Stevenson MA, Nguyen DT, O’Brien MC, Turner R, Sausville EA. Costimulation of cutaneous T-cell lymphoma cells by interleukin-7 and interleukin-2: potential autocrine or paracrine effectors in the Sezary syndrome. J Clin Oncol. 1994;12:326–335. doi: 10.1200/JCO.1994.12.2.326. [DOI] [PubMed] [Google Scholar]
- 20.Zhang Q, Nowak I, Vonderheid EC, Rook AH, Kadin ME, Nowell PC, Shaw LM, Wasik MA. Activation of Jak/STAT proteins involved in signal transduction pathway mediated by receptor for interleukin 2 in malignant T lymphocytes derived from cutaneous anaplastic large T-cell lymphoma and Sezary syndrome. Proc Natl Acad Sci U S A. 1996;93:9148–9153. doi: 10.1073/pnas.93.17.9148. [DOI] [PMC free article] [PubMed] [Google Scholar]
- 21.Dobbeling U, Dummer R, Laine E, Potoczna N, Qin JZ, Burg G. Interleukin-15 is an autocrine/paracrine viability factor for cutaneous T-cell lymphoma cells. Blood. 1998;92:252–258. [PubMed] [Google Scholar]
- 22.Qin JZ, Kamarashev J, Zhang CL, Dummer R, Burg G, Dobbeling U. Constitutive and interleukin-7- and interleukin-15-stimulated DNA binding of STAT and novel factors in cutaneous T cell lymphoma cells. J Invest Dermatol. 2001;117:583–589. doi: 10.1046/j.0022-202x.2001.01436.x. [DOI] [PubMed] [Google Scholar]
- 23.Qin JZ, Zhang CL, Kamarashev J, Dummer R, Burg G, Dobbeling U. Interleukin-7 and interleukin-15 regulate the expression of the bcl-2 and c-myb genes in cutaneous T-cell lymphoma cells. Blood. 2001;98:2778–2783. doi: 10.1182/blood.v98.9.2778. [DOI] [PubMed] [Google Scholar]
- 24.Van Doorn R, Dijkman R, Vermeer MH, Starink TM, Willemze R, Tensen CP. A novel splice variant of the Fas gene in patients with cutaneous T-cell lymphoma. Cancer Res. 2002;62:5389–5392. [PubMed] [Google Scholar]
- 25.Li G, Chooback L, Wolfe JT, Rook AH, Felix CA, Lessin SR, Salhany KE. Overexpression of p53 protein in cutaneous T cell lymphoma: relationship to large cell transformation and disease progression. J Invest Dermatol. 1998;110:767–770. doi: 10.1046/j.1523-1747.1998.00167.x. [DOI] [PubMed] [Google Scholar]
- 26.Hwang ST, Janik JE, Jaffe ES, Wilson WH. Mycosis fungoides and Sezary syndrome. Lancet. 2008;371:945–957. doi: 10.1016/S0140-6736(08)60420-1. [DOI] [PubMed] [Google Scholar]
- 27.Center DM, Cruikshank WW. Modulation of lymphocyte migration by human lymphokines. I. Identification and characterization of chemoattractant activity for lymphocytes from mitogen-stimulated mononuclear cells. J Immunol. 1982;128:2563–2568. [PubMed] [Google Scholar]
- 28.Cruikshank WW, Center DM. Modulation of lymphocyte migration by human lymphokines. II. Purification of a lymphotactic factor (LCF) J Immunol. 1982;128:2569–2574. [PubMed] [Google Scholar]
- 29.Kurschner C, Yuzaki M. Neuronal interleukin-16 (NIL-16): a dual function PDZ domain protein. J Neurosci. 1999;19:7770–7780. doi: 10.1523/JNEUROSCI.19-18-07770.1999. [DOI] [PMC free article] [PubMed] [Google Scholar]
- 30.Zhang Y, Kornfeld H, Cruikshank WW, Kim S, Reardon CC, Center DM. Nuclear translocation of the N-terminal prodomain of interleukin-16. J Biol Chem. 2001;276:1299–1303. doi: 10.1074/jbc.M008513200. [DOI] [PubMed] [Google Scholar]
- 31.Center DM, Cruikshank WW, Zhang Y. Nuclear pro-IL-16 regulation of T cell proliferation: p27(KIP1)-dependent G0/G1 arrest mediated by inhibition of Skp2 transcription. J Immunol. 2004;172:1654–1660. doi: 10.4049/jimmunol.172.3.1654. [DOI] [PubMed] [Google Scholar]
- 32.Nicoll J, Cruikshank WW, Brazer W, Liu Y, Center DM, Kornfeld H. Identification of domains in IL-16 critical for biological activity. J Immunol. 1999;163:1827–1832. [PubMed] [Google Scholar]
- 33.Zhang Y, Center DM, Wu DM, Cruikshank WW, Yuan J, Andrews DW, Kornfeld H. Processing and activation of pro-interleukin-16 by caspase-3. J Biol Chem. 1998;273:1144–1149. doi: 10.1074/jbc.273.2.1144. [DOI] [PubMed] [Google Scholar]
- 34.Cruikshank WW, Kornfeld H, Center DM. Interleukin-16. J Leukoc Biol. 2000;67:757–766. doi: 10.1002/jlb.67.6.757. [DOI] [PubMed] [Google Scholar]
- 35.Wilson KC, Cattel DJ, Wan Z, Rahangdale S, Ren F, Kornfeld H, Sullivan BA, Cruikshank WW, Center DM. Regulation of nuclear Prointerleukin-16 and p27(Kip1) in primary human T lymphocytes. Cell Immunol. 2005;237:17–27. doi: 10.1016/j.cellimm.2005.09.003. [DOI] [PubMed] [Google Scholar]
- 36.Wilson KC, Center DM, Cruikshank WW. The effect of interleukin-16 and its precursor on T lymphocyte activation and growth. Growth Factors. 2004;22:97–104. doi: 10.1080/08977190410001704679. [DOI] [PubMed] [Google Scholar]
- 37.Kornfeld H, Cruikshank WW, Pyle SW, Berman JS, Center DM. Lymphocyte activation by HIV-1 envelope glycoprotein. Nature. 1988;335:445–448. doi: 10.1038/335445a0. [DOI] [PubMed] [Google Scholar]
- 38.Diaz-Griffero F, Qin XR, Hayashi F, Kigawa T, Finzi A, Sarnak Z, Lienlaf M, Yokoyama S, Sodroski J. A B-box 2 surface patch important for TRIM5alpha self-association, capsid binding avidity, and retrovirus restriction. J Virol. 2009;83:10737–10751. doi: 10.1128/JVI.01307-09. [DOI] [PMC free article] [PubMed] [Google Scholar]
- 39.De Meester I, Korom S, Van Damme J, Scharpe S. CD26, let it cut or cut it down. Immunol Today. 1999;20:367–375. doi: 10.1016/s0167-5699(99)01486-3. [DOI] [PubMed] [Google Scholar]
- 40.Morimoto C, Schlossman F. The structure and function of CD26 in the T-cell immune response. Immunol Rev. 1998;161:55–70. doi: 10.1111/j.1600-065x.1998.tb01571.x. [DOI] [PubMed] [Google Scholar]
- 41.Luco RF, Maestro MA, Del Pozo N, Philbrick WM, De la Ossa PP, Ferrer J. A conditional model reveals that induction of hepatocyte nuclear factor-1alpha in Hnf1alpha-null mutant beta-cells can activate silenced genes postnatally, whereas overexpression is deleterious. Diabetes. 2006;55:2202–2211. doi: 10.2337/db05-1534. [DOI] [PubMed] [Google Scholar]
- 42.Zhang Y, Tuzova M, Xiao ZX, Cruikshank WW, Center DM. Pro-IL-16 recruits histone deacetylase 3 to the Skp2 core promoter through interaction with transcription factor GABP. J Immunol. 2008;180:402–408. doi: 10.4049/jimmunol.180.1.402. [DOI] [PubMed] [Google Scholar]
- 43.Zhang C, Hazarika P, Ni X, Weidner DA, Duvic M. Induction of apoptosis by bexarotene in cutaneous T-cell lymphoma cells: relevance to mechanism of therapeutic action. Clin Cancer Res. 2002;8:1234–1240. [PubMed] [Google Scholar]
- 44.Michel L, Dupuy A, Jean-Louis F, Sors A, Poupon J, Viguier M, Musette P, Dubertret L, Degos L, Dombret H, Bachelez H. Arsenic trioxide induces apoptosis of cutaneous T cell lymphoma cells: evidence for a partially caspase-independent pathway and potentiation by ascorbic acid (vitamin C) J Invest Dermatol. 2003;121:881–893. doi: 10.1046/j.1523-1747.2003.12479.x. [DOI] [PubMed] [Google Scholar]
- 45.Nunez G, Benedict MA, Hu Y, Inohara N. Caspases: the proteases of the apoptotic pathway. Oncogene. 1998;17:3237–3245. doi: 10.1038/sj.onc.1202581. [DOI] [PubMed] [Google Scholar]
- 46.Adachi H, Adams A, Hughes FM, Zhang J, Cidlowski JA, Jetten AM. Induction of apoptosis by the novel retinoid AHPN in human T-cell lymphoma cells involves caspase-dependent and independent pathways. Cell Death Differ. 1998;5:973–983. doi: 10.1038/sj.cdd.4400445. [DOI] [PubMed] [Google Scholar]
- 47.Kaser A, Dunzendorfer S, Offner FA, Ryan T, Schwabegger A, Cruikshank WW, Wiedermann CJ, Tilg H. A role for IL-16 in the cross-talk between dendritic cells and T cells. J Immunol. 1999;163:3232–3238. [PubMed] [Google Scholar]
- 48.Edelson RL. Cutaneous T cell lymphoma: the helping hand of dendritic cells. Ann N Y Acad Sci. 2001;941:1–11. [PubMed] [Google Scholar]
- 49.Lynch EA, Heijens CA, Horst NF, Center DM, Cruikshank WW. Cutting edge: IL-16/CD4 preferentially induces Th1 cell migration: requirement of CCR5. J Immunol. 2003;171:4965–4968. doi: 10.4049/jimmunol.171.10.4965. [DOI] [PubMed] [Google Scholar]


