

Summary
SHARPIN is an essential component of the linear ubiquitin chain assembly complex (LUBAC) complex that controls signalling pathways of various receptors, including the tumour necrosis factor receptor (TNFR), Toll‐like receptor (TLR) and antigen receptor, in part by synthesis of linear, non‐degrading ubiquitin chains. Consistent with SHARPIN's function in different receptor pathways, the phenotype of SHARPIN‐deficient mice is complex, including the development of inflammatory systemic and skin diseases, the latter of which depend on TNFR signal transduction. Given the established function of SHARPIN in primary and malignant B cells, we hypothesized that SHARPIN might also regulate T‐cell receptor (TCR) signalling and thereby control T‐cell biology. Here, we focus primarily on the role of SHARPIN in T cells, specifically regulatory T (Treg) cells. We found that SHARPIN‐deficient (Sharpin cpdm/cpdm) mice have significantly reduced numbers of FOXP3+ Treg cells in lymphoid organs and the peripheral blood. Competitive reconstitution of irradiated mice with mixed bone marrow from wild‐type and SHARPIN‐deficient mice revealed an overall reduced thymus population with SHARPIN‐deficient cells with almost complete loss of thymic Treg development. Consistent with this cell‐intrinsic function of SHARPIN in Treg development, TCR stimulation of SHARPIN‐deficient thymocytes revealed reduced activation of nuclear factor‐κB and c‐Jun N‐terminal kinase, establishing a function of SHARPIN in TCR signalling, which may explain the defective Treg development. In turn, in vitro generation and suppressive activity of mature SHARPIN‐deficient Treg cells were comparable to wild‐type cells, suggesting that maturation, but not function, of SHARPIN‐deficient Treg cells is impaired. Taken together, these findings show that SHARPIN controls TCR signalling and is required for efficient generation of Treg cells in vivo, whereas the inhibitory function of mature Treg cells appears to be independent of SHARPIN.
Keywords: LUBAC, SHARPIN, signal transduction, T‐cell development, regulatory T cells
Abbreviations
- BCL10
B‐cell CLL/lymphoma 10
- BCR
B‐cell receptor
- CARMA1
CARD‐containing MAGUK protein 1
- CBM complex
CARMA1, BCL10, MALT1 complex
- IKKβ
inhibitor of κB kinase β
- iTreg
induced regulatory T
- JNK
c‐Jun N‐terminal kinase
- LUBAC
linear ubiquitin chain assembly complex
- NF‐κB
nuclear factor‐κB
- RBCK1
RanBP‐type and C3HC4‐type zinc finger‐containing protein 1
- RNF31
E3 ubiquitin‐protein ligase RNF31
- TAK1
transforming growth factor‐β Activated Kinase 1
- Tconv
conventional T
- TCR
T‐cell receptor
- Th1
T helper type 1
- Treg
regulatory T
Introduction
The ubiquitously expressed protein SHANK‐associated RH domain‐interacting protein (SHARPIN) is an essential component of the linear ubiquitin chain assembly complex (LUBAC) along with the RanBP‐type and C3HC4‐type zinc finger‐containing protein 1 (Rbck1; also known as E3 ligases haem‐oxidized IRP2 ubiquitin ligase 1 or HOIL‐1) and E3 ubiquitin‐protein ligase RNF31 (Rnf31; also known as HOIL‐1‐Interacting Protein or HOIP). This trimolecular protein complex regulates, in part by synthesis of non‐degrading linear polyubiquitin chains, various signalling pathways, including tumour necrosis factor‐, Toll‐like receptor‐ and B‐cell receptor (BCR) ‐induced nuclear factor‐κB (NF‐κB) and c‐Jun N‐terminal kinases (JNK) pathways, and activation of the NLRP3 inflammasome.1, 2, 3 More detailed analysis of the BCR signalling pathway showed that SHARPIN participates in proper assembly of the trimolecular CBM complex, consisting of CARD‐containing MAGUK protein 1 (CARMA1), B‐Cell CLL/Lymphoma 10 (BCL10) and MALT1 paracaspase, which represents an essential and common component of BCR and T‐cell receptor (TCR) signal transduction pathways.3 Moreover, SHARPIN was found to co‐precipitate with components of the CBM complex in Jurkat lymphoma cells upon TCR triggering, and short hairpin RNA‐mediated knock‐down of RNF31 interfered with TCR‐induced NF‐κB activation.3 Collectively, these data indicated that SHARPIN (and LUBAC in general) may be also involved in TCR‐mediated activation of primary T cells.
Mice carrying a spontaneous chronic proliferative dermatitis mutation (C57BL/KaLawRij‐Sharpin cpdm/RijSunJ mice, here referred to as Sharpin cpdm/cpm mice) are SHARPIN‐deficient and develop progressive proliferative dermatitis and multi‐organ inflammation, characterized by leucocytosis, splenomegaly, eosinophilic infiltrations in various organs, defects in lymphoid organs and reduced T helper type 1 (Th1) cytokine production accompanied by a shift towards Th2 immune responses.4, 5 Here we investigated the function of lymphocytes, specifically regulatory T (Treg) cells in SHARPIN‐deficient mice. Treg cells, characterized by the expression of the transcription factor Forkhead Box P3 (FOXP3),6, 7 are important regulators of immune responses, and impaired homeostasis or function of Treg cells leads to multi‐organ inflammation, as observed in the Foxp3‐deficient ‘scurfy mice’, as well as human X‐linked patients carrying Foxp3 mutations that result in immune dysregulation, polyendocrinopathy and enteropathy.8, 9, 10 Overall, TCR signalling strength, as well as various TCR‐mediated signalling pathways and transcription factors, have been described as controlling Treg cell generation.11 Those include NF‐κB, activator protein‐1, SMAD Family Member 3, Nuclear factor of activated T‐cells and members of the nuclear family 4 subgroup A receptors [NR4A1 (NURR77), NR4A2 (NURR1) and NR4A3 (NOR1)].11, 12, 13 Consistent with an important role of NF‐κB in Treg cell generation, deficiency of different molecules acting in the TCR–NF‐κB pathway, such as protein kinase Cθ, CARMA1, BCL10, inhibitor of κB kinase β (IKKβ) and transforming growth factor‐β activated kinase 1 (TAK1), leads to significant reduction in the number of Treg cells.14, 15, 16, 17, 18 In turn, and consistent with the loss of function experiments, T‐cell‐specific expression of a constitutively active form of IKKβ, which increases NF‐κB activity, leads to increased numbers of FOXP3+ cells and rescued thymic Treg cell development in mice deficient for TAK1 or CARMA1, both of which act upstream of IKKβ.19 More detailed analysis of NF‐κB family members revealed that particularly proto‐oncogene c‐Rel (REL) and transcription factor p65 (RELA) initially drive Treg cell development by activating the Foxp3 promoter, while other transcription factors are subsequently recruited to the promoter to form the so called FOXP3‐specific enhanceosome.20
Here we analysed the role of SHARPIN in Treg cell biology, revealing a critical function of SHARPIN in TCR‐induced NF‐κB and JNK signalling and thymic Treg cell generation.
Materials and methods
Mice
C57BL/KaLawRij‐Sharpin cpdm/RijSunJ (Sharpin cpdm/cpdm), B6.SJL‐Ptprc a Pepc b/BoyJ (SJL, CD45.1+) and B6.129S7‐Rag1 tm1Mom/J (Rag1 −/−) mice were obtained from The Jackson Laboratory (Bar Harbor, ME) and subsequently bred at our facility. Foxp3 tm1Kuch mice (Foxp3 gfp/gfp)21 were a kind gift from Vijay Kuchroo (Harvard Medical School, Brigham and Women's Hospital, Boston, MA). Mice were kept under pathogen‐free conditions. All of the animal studies were conducted under protocols approved by the St Jude Children's Research Hospital Institutional Animal Care and Use Committee.
Flow cytometry analysis
Red blood cells were lysed with ACK lysis buffer (Stem Cells Inc., Newark, CA). Single cell suspensions were prepared and Fc receptor was blocked with antibodies against CD16/CD32 (eBioscience, San Diego, CA), followed by staining for cell surface expression of CD3 (145‐2C11), CD4 (RM4‐5), CD25 (PC61.5), CD44 (IM7), CD62L (MEL‐14), CD103 (2E7), Icos (7E.17G9), CD127 (A7R34), CD69 (H1.2F3) (eBioscience; BD Biosciences, San Jose, CA) or intracellular staining for FOXP3 (FJK‐16s) and CTLA4 (UC10‐4B9). Flow cytometry data were acquired on a FACS Canto‐II flow cytometer (BD Biosciences), and data were analysed using flowjo software (Tree Star, Ashland, OR).
Suppression assay and iTreg generation
Sorted T‐cell populations were cultured in RPMI‐1640 (Invitrogen, Carlsbad, CA) supplemented with 10% (volume/volume) fetal calf serum (Hyclone, GE Healthcare Life Sciences, Pittsburgh, PA), 50 mm 2‐mercaptoethanol, and antibiotics [penicillin G (100 IU/ml) and streptomycin sulphate (100 IU/ml); Invitrogen]. CD4+ T cells from spleen and lymph nodes from Sharpin +/+; Foxp3 gfp/gfp and Sharpin cpdm/cpdm; Foxp3 gfp/pfg mice were isolated by positive selection with anti‐CD4 microbeads (Miltenyi Biotec, Bergisch Gladbach, Germany).
For suppression assays, CD4+ CD25− CD45RB+ FOXP3(GFP)− conventional T (Tconv) cells and CD4+ CD25+ CD45RB− FOXP3(GFP)+ Treg cells were sorted by flow cytometry. Tconv cells were labelled with Cell Trace Violet (Molecular Probes, Eugene, OR) and 5 × 10⁵ cells were cultured in the presence of different concentrations of Treg cells in the presence of bead‐bound anti‐CD3/anti‐CD28 (Dynabeads; Life Technologies, Carlsbad, CA) for 4 days. Proliferation was measured by flow cytometry, and suppression was calculated based on the division index (flowjo).
For in vitro induced Treg (iTreg) cell generation, CD4+ CD25− CD45RB+ FOXP3− Tconv cells were sorted by flow cytometry and then stimulated with plate‐bound anti‐CD3 (10 μg/ml, BD Biosciences) and anti‐CD28 (4 μg/ml, BD Biosciences) in the presence of 40 ng/ml transforming growth factor‐β (Peprotech, Rocky Hill, NJ). Six days later, viable cells were sorted for FOXP3 expression (GFP+) by flow cytometry and subjected to suppression assays.
Quantitative real‐time PCR
Total RNA was isolated from cells using Trizol (Sigma‐Aldrich, St Louis, MO). The RNA was reverse transcribed to cDNA using the Superscript III first‐strand cDNA synthesis kit (Invitrogen). Quantitative real‐time PCR was performed on an AB 7300 real‐time PCR machine (Applied Biosystems, Foster City, CA) using an SYBR green PCR Master Mix (Applied Biosystems). Each mRNA signal was normalized to β‐actin (ActB) as a housekeeping gene. The following primer sequences against mouse genes were used: ActB 5′‐ACT GCT CTG GCT CCT AGC AC‐3′; 5′‐ACA TCT GCT GGA AGG TGG AC‐3′; Ifng 5′‐CAT TCA GAG CTG CAG TGA CC‐3′; 5′‐CAC ATT CGA GTG CTG TCT GG‐3′; Il4 5′‐TCT GTA GGG CTT CCA AGG TG‐3′ 5′‐CTG CAG CTC CAT GAG AAC AC‐3′, Il5 5′‐AGA CTG TGC CAT GAC TGT GC‐3′ 5′‐CTG GCT CTC ATT CAC ACT GC‐3′ 5′ Gata3 5′‐AAG CTC AGT ATC CGC TGA CG‐3′ 5′‐GAT ACC TCT GCA CCG TAG CC‐3′, Tbet 5′‐GTC TGG GAA GCT GAG AGT CG‐3′ 5′‐TGA AGG ACA GGA ATG GGA AC‐3′, Foxp3 5′‐TTC ATG CAT CAG CTC TCC ACT‐3′ 5′‐AAG GTG GTG GGA GGC TGA‐3′, Il10 5′‐TGC CTG CTC TTA CTG ACT GG‐3′ 5′‐ACC TAG GAG CAT GTG GCT CTG G‐3′, Tgfb1 5′‐CAC CGG AGA GCC CT‐3′ 5′‐TGT ACA GCT GCC GC‐3′, Irf4 5′‐AGC ACCT TA TGG CTC TCT GC‐3′ 5′‐GGA TTT CTG GGT GTG ACT GG‐3′.
Generation of mixed bone marrow chimeric mice
Mixed bone marrow chimeras were generated by reconstituting irradiated (950 Gy) 6‐ to 10‐week‐old Rag1 −/− recipient mice with equal numbers of T‐cell‐depleted 1 × 10⁶ bone marrow cells from SJL (CD45.1+) and 1 × 10⁶ bone marrow cells from Sharpin cpdm/cpdm ; Foxp3 gfp/gfp (CD45.2+) donor mice. Chimerism was verified by analysis of CD45.1 and CD45.2 expression by flow cytometry.
Immuno‐blotting
Cells were stimulated with bead‐bound anti‐CD3/anti‐CD28 (Dynabeads, Life Technologies) for the indicated time‐points. For preparation of total lysates, cells were lysed in buffer containing 20 mm HEPES/KOH (pH 7·5), 150 mm NaCl, 1 mm EDTA, 0·5% nonidet P‐40, 10% glycerol, 10 mm pyrophosphate, supplemented with complete protease inhibitors (Roche Life Science, Indianapolis, IN) for 20 min. Nuclear extracts were prepared using the Nuclear Extract Kit (Active Motif, Carlsbad, CA ) following the manufacturer's instructions. Cell lysates were resolved by SDS–PAGE (Bio‐Rad, Hercules, CA) and transferred onto nitrocellulose membranes. Membranes were probed with antibodies against pp65, IκBα, pJNK, pERK1/2, pp38, RELB (Cell Signaling, Danvers, MA) or p38, p65, cREL, H2B Histone (Santa Cruz Biotechologies, Dallas, TX) and visualized using enhanced chemiluminescence (Pierce Biotechnology, Rockford, IL) for detection. Relative protein expression levels were quantified by image studio lite software (Li‐COR Biosciences, Lincoln, NE).
Statistical analysis
Data are expressed as the mean ± SEM and were compared using Student's t‐tests. A P‐value < 0·05 was considered significant.
Results
The number of Treg cells is reduced in SHARPIN‐deficient mice
SHARPIN‐deficient mice develop a T‐cell‐dependent, systemic inflammatory disease, characterized by eosinophilia, deregulated development of lymphoid tissues and reduced Th1 responses.4, 5 To determine potential differences in Treg numbers of wild‐type and SHARPIN‐deficient mice, we performed intracellular staining for FOXP3, which identifies Treg cells. Flow cytometry analysis of splenocytes from SHARPIN‐deficient mice revealed a significant reduction of CD4+ CD25+ FOXP3+ cells (data not shown). To analyse the Treg compartment in more detail, we crossed SHARPIN‐deficient mice (Sharpin cpdm/cpdm) with Foxp3 gfp/gfp reporter mice, where FOXP3 expression is reflected by GFP fluorescence. We investigated the number of total cells, CD3+, CD3+ CD4+ and CD3+ CD4+ CD25+ FOXP3+ cells by flow cytometry as depicted in Fig. 1(a). Although the total number of CD3+ and CD3+ CD4+ T cells was significantly increased in the blood of Sharpin cpdm/cpdm; Foxp3 gfp/gfp mice, there was no significant difference of these cells in the spleen and lymph nodes, thymus or bone marrow (Fig. 1b). In contrast and consistent with the results obtained by intracellular FOXP3 staining, Treg cell numbers in all peripheral organs, including blood, spleen and lymph nodes, were significantly reduced. Of note, Treg cell numbers were also reduced in the thymus, indicating a defect in thymic Treg cell generation.
Figure 1.
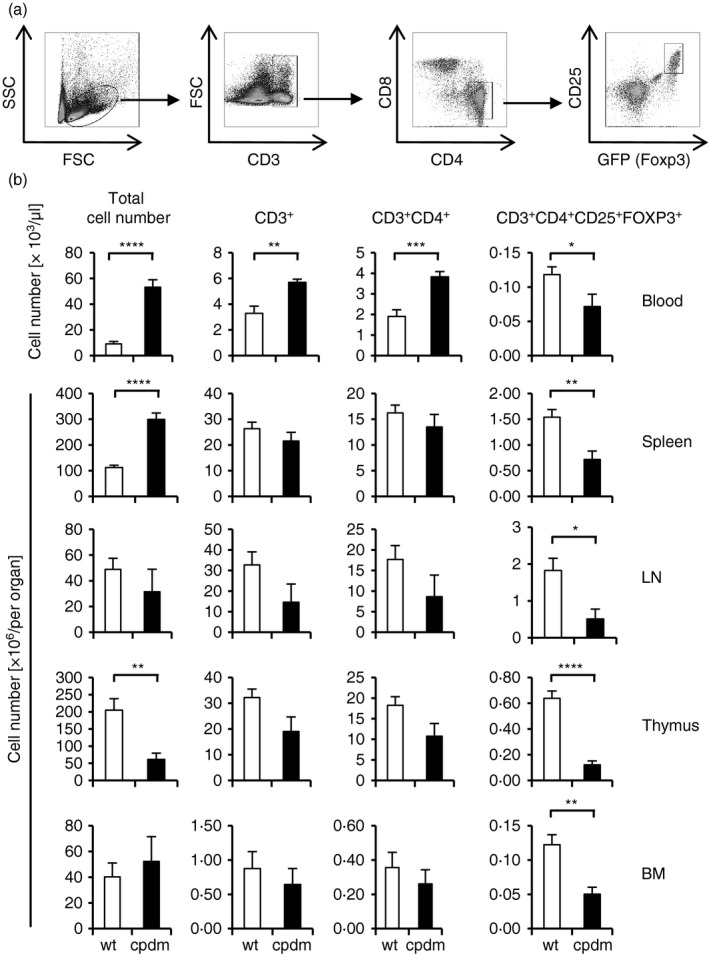
Reduction of regulatory T (Treg) cells in SHARPIN‐deficient mice. (a) Gating strategy for (b). (b) Number of total cells, T cells (CD3+), CD4+ T cells (CD3+ CD4+) and Treg (CD3+ CD4+ CD25+ FOXP3+) in the blood, spleen, lymph node (LN), thymus and bone‐marrow (BM) of Sharpin +/+; Foxp3 gfp/gfp and Sharpin cpdm/cpdm; Foxp3 gfp/gfp mice was determined by flow cytometry. Data represent mean ± SEM. Spleen: n = 11–12, other organs: n = 6–7, *P < 0·05, **P < 0·005, ***P < 0·001, ****P < 0·0001.
Sharpin cpdm/cpdm; Foxp3 gfp/gfp Treg cells display an activated Th2‐like phenotype
To characterize the phenotype of Treg cells in SHARPIN‐deficient mice we analysed various activation markers and mRNA levels of informative genes. Expression of CD44, CD103, ICOS and CD127 were increased on Sharpin cpdm/cpdm; Foxp3 gfp/gfp Treg cells as determined by flow cytometry (Fig. 2a). Furthermore, expression of Th2‐associated mRNAs, such as Il4, Il5 and Gata3, were significantly increased in Sharpincpdm/Foxp3GFP Treg cells, whereas expression levels of Ifng were decreased. There was no significant difference in the expression levels of Il2, Tbet, Tgfb and Irf4 (Fig. 2b). As such, Treg cells from SHARPIN‐deficient mice exhibit an activated, Th2‐like phenotype, similar to what has been published before for total splenocyte cultures.5
Figure 2.
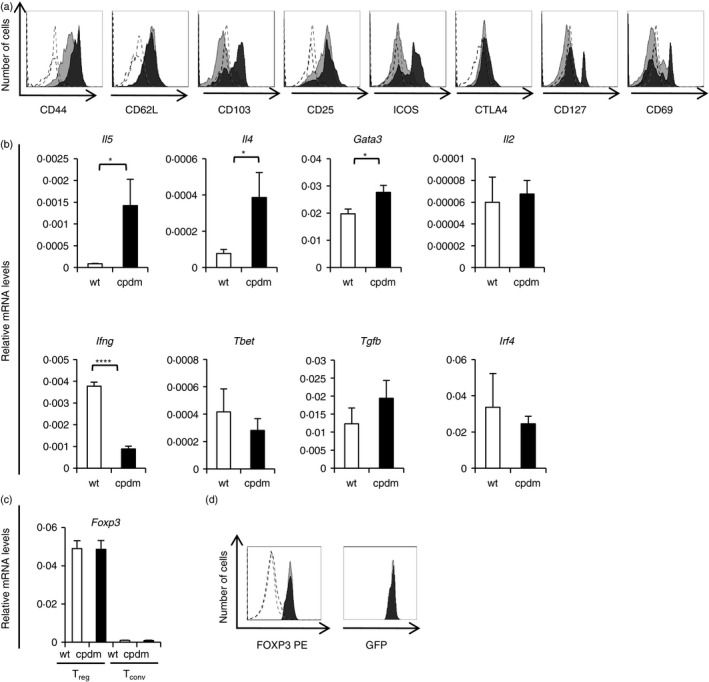
SHARPIN‐deficient regulatory T (Treg) display an activated phenotype. (a) Expression of indicated markers on CD3+ CD4+ CD25+ FOXP3+ Treg cells from the spleen of Sharpin +/+; Foxp3 gfp/gfp and Sharpin cpdm/cpdm; Foxp3 gfp/gfp mice was determined by flow cytometry. Open histograms: isotype control, shaded histograms: indicated antibody, light grey: Sharpin +/+; Foxp3 gfp/gfp, dark grey Sharpin cpdm/cpdm; Foxp3 gfp/gfp. One representative of n = 3 is shown. (b) Quantitative PCR analysis of relative mRNA expression levels of indicated genes of Treg cells isolated from the spleen of Sharpin +/+; Foxp3 gfp/gfp and Sharpin cpdm/cpdm; Foxp3 gfp/gfp mice. Data represent mean ± SEMl n = 3. *P < 0·05, ****P < 0·0001. (c) Quantative PCR analysis of relative mRNA expression levels of Foxp3 of Treg and conventional T (Tconv) cells isolated from the spleen of Sharpin +/+; Foxp3 gfp/gfp and Sharpin cpdm/cpdm; Foxp3 gfp/gfp mice. Data represent mean ± SEM; n = 3. (d) Expression of FOXP3 on CD3+ CD4+ CD25+ FOXP3+ Treg cells from the spleen of Sharpin +/+; Foxp3 gfp/gfp and Sharpin cpdm/cpdm; Foxp3 gfp/gfp mice was determined by flow cytometry. Open histograms: isotype control, shaded histograms: FOXP3, light grey: Sharpin +/+; Foxp3 gfp/gfp, dark grey Sharpin cpdm/cpdm; Foxp3 gfp/gfp. One representative of n = 3 is shown.
To delineate whether reduced expression of FOXP3 might account for the reduction of Treg cells in Sharpin cpdm/cpdm mice, we measured Foxp3 expression by quantitative PCR (Fig. 2c) and flow cytometry (Fig. 2d). There was no significant difference in the expression levels of Foxp3 (Fig. 2c,d).
Lack of Treg cell development in SHARPIN‐deficient mice is T‐cell intrinsic
Given that Treg cell development is regulated by many, in part exogenous factors, it seemed possible that the defect in Treg cell development was mediated either by inflammatory factors present in SHARPIN‐deficient mice or, alternatively, controlled cell‐intrinsically in developing Treg cells. To differentiate between these possibilities, we generated mixed bone‐marrow chimeras by transferring equal amounts of bone‐marrow cells obtained from mice carrying the SJL (CD45.1+) allele and from the Sharpin cpdm/cpdm ; Foxp3 gfp/gfp (CD45.2+) mice into lethally irradiated Rag1 −/− mice. Six weeks after transfer, the percentage of total cells, CD4+ FOXP3− T cells and CD4+ FOXP3+ Treg cells were determined by flow cytometry from the spleen, thymus and lymph nodes. Overall, the total cell numbers of lymphocytes and myeloid cells derived from Sharpin cpdm/cpdm; Foxp3 gfp/gfp bone marrow were reduced compared with SJL cells, suggesting a competitive disadvantage of SHARPIN‐deficient cells (Fig. 3a,b). However, in addition to this overall competitive disadvantage, there was an almost complete ablation of Sharpin cpdm/cpdm; Foxp3 gfp/gfp Treg cells in various lymphatic organs, including the thymus, strongly suggesting that the reduction of Treg cells is due to a T‐cell intrinsic defect in thymic development (Fig. 3a,b).
Figure 3.
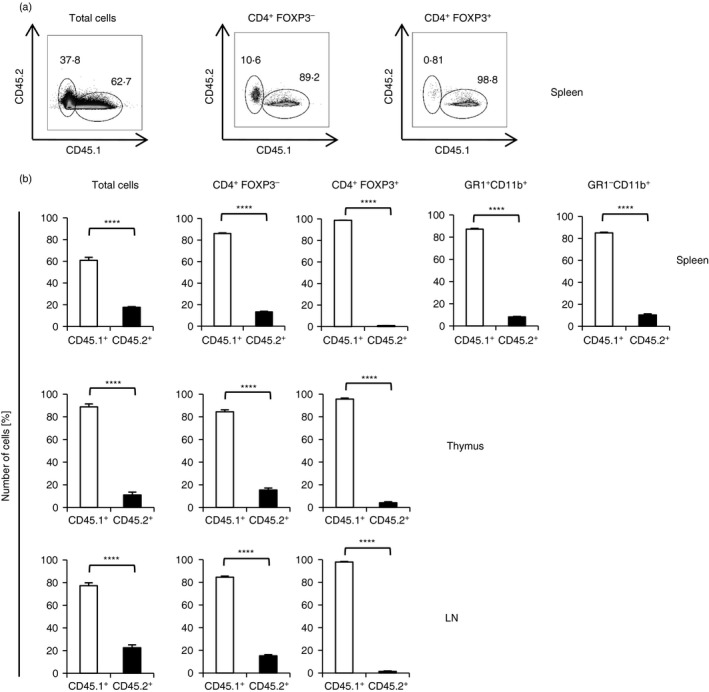
Lack of regulatory T (Treg) cell development in SHARPIN‐deficient mice is T‐cell intrinsic. Lethally irradiated Rag1 −/− mice were reconstituted with equal amounts of CD4+‐depleted bone‐marrow from Sharpin +/+; Foxp3 gfp/gfp and Sharpin cpdm/cpdm; Foxp3 gfp/gfp mice. Splenocytes, thymocytes and lymph node (LN) cells were analysed by flow cytometry 6 weeks after transfer. (a) Expression of CD45.1 (SJL) and CD45.2 (Sharpin cpdm/cpdm) on indicated splenocyte populations. One representative of n = 5 is shown. (b) Percentage of CD45.1 (SJL) and CD45.2 (Sharpin cpdm/cpdm) within indicated cell populations; n = 4–5. Data represent mean ± SEM. ****P < 0·0001.
TCR signalling is reduced in SHARPIN‐deficient thymocytes
As mentioned, TCR‐mediated signalling, including NF‐κB and AP‐1 activation, is required for Treg cell development.11 To test if SHARPIN is involved in TCR signalling we stimulated wild‐type and SHARPIN‐deficient thymocytes isolated from Sharpin +/+; Foxp3 gfp/gfp and Sharpin cpdm/cpdm; Foxp3 gfp/gfp mice with anti‐CD3/anti‐CD28 or PMA/ionomycin and determined NF‐κB and mitogen‐activated protein kinase kinase activity by immuno‐blotting. Phosphorylation of the NF‐κB family member p65 as well as degradation of IκBα were reduced in Sharpin cpdm/cpdm; Foxp3 gfp/gfp thymocytes (Fig. 4a, c). Likewise, TCR‐mediated nuclear translocation of different NF‐κB members, i.e. RELB, p65 and REL, showed a slight reduction in SHARPIN‐deficient thymocytes (Fig. 4b), revealing a positive regulatory function of SHARPIN in the NF‐κB pathway. In addition, we found reduced phosphorylation of JNK, while phosphorylation of mitogen‐activated protein kinase 1 and 2 wasincreased in SHARPIN‐deficient thymocytes (Fig. 4a). SHARPIN deficiency results in decreased TCR‐mediated NF‐κB and JNK activation, which may explain the reduced Treg cell development.
Figure 4.
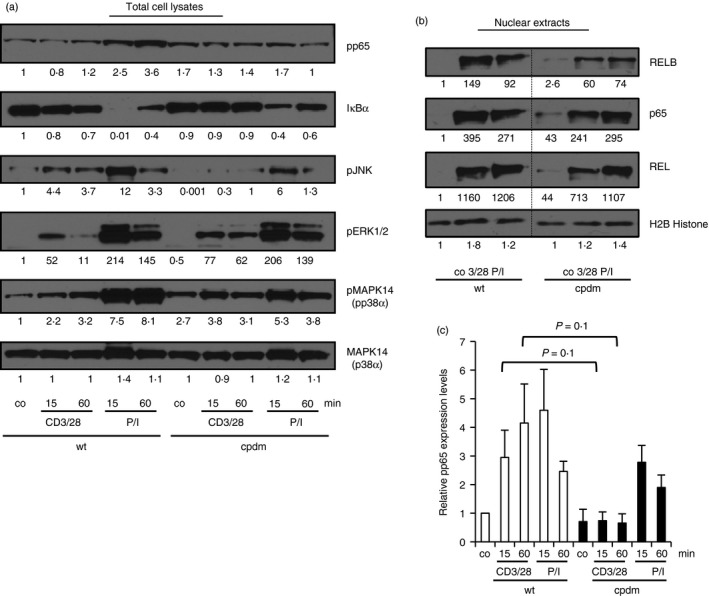
T‐cell receptor (TCR) ‐mediated nuclear factor‐κB (NF‐κB) and c‐Jun N‐terminal kinase (JNK) activation is reduced in SHARPIN‐deficient thymocytes. Thymocytes isolated from Sharpin +/+; Foxp3 gfp/gfp and Sharpin cpdm/cpdm; Foxp3 gfp/gfp mice were left untreated (co) or stimulated with anti‐CD3/anti‐CD28 (CD3/28) or PMA/ionomycin (P/I) for the indicated time‐points. (a) Total cell lysates were analysed by immuno‐blotting using the indicated antibodies. (b) Nuclear lysates were analysed by immuno‐blotting using antibodies against RELB, P65, REL and H2B Histone. One representative experiment of three is shown. Relative protein expression levels were quantified by image studio lite software. (c) Quantification of phospho‐p65 levels in total cell lysates obtained from thymocytes treated as described for (a). n = 3.
Treg in Sharpin cpdm/cpdm; Foxp3 gfp/gfp mice maintain suppressive activity
FOXP3 expression is a hallmark of Treg cells and reduced expression of Foxp3 is associated with the onset of multi‐organ inflammation and reduced suppressive activity.22 Although the number of Treg cells was reduced in Sharpin cpdm/cpdm; Foxp3 gfp/gfp mice (as shown above), we did not observe any defect in the expression of FOXP3 in the remaining Treg cell population (Fig. 2c and d). To determine the functional activity of SHARPIN‐deficient Treg cells, we analysed their suppressive activity against proliferation of conventional CD4+ CD25− CD45RB+ FOXP3− T cells in an in vitro suppression assay. Interestingly, albeit reduced in numbers, the remaining Sharpin cpdm/cpdm; Foxp3 gfp/gfp CD4+ CD25+ FOXP3+ Treg cells exhibited suppressive activity comparable to that in Treg cells obtained from Sharpin +/+ /Foxp3 GFP littermate control mice (Fig. 5a). This suppressive activity was not restricted to wild‐type Tconv cells, but was also observed when SHARPIN‐deficient Tconv cells were used as responder cells. It therefore appears that SHARPIN is required for development of Treg cells, but is dispensable for steady‐state expression of FOXP3 and Treg‐mediated suppression of conventional T cells, at least in these in vitro assays.
Figure 5.
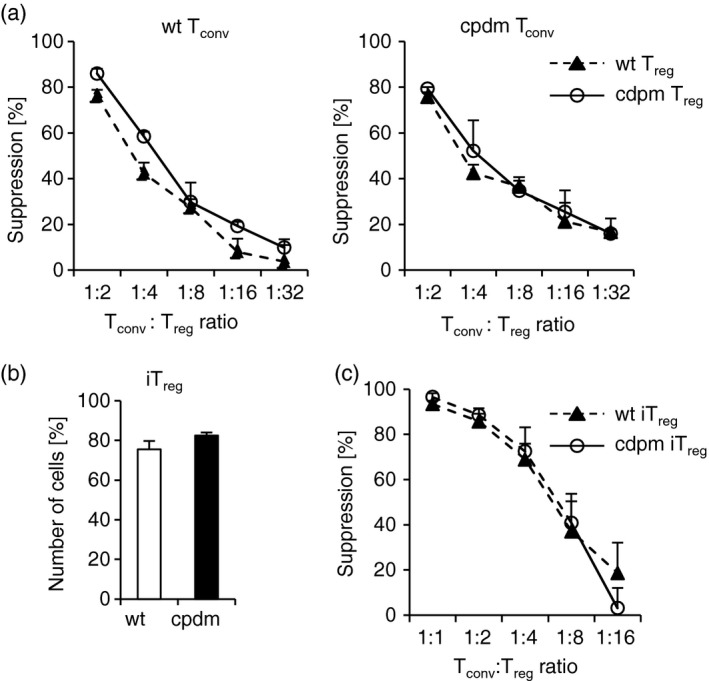
Sharpin cpdm/cpdm regulatory T (Treg) and induced Treg (iTreg) cells express FOXP3 and maintain suppressive activity. (a) Sharpin +/+; Foxp3 gfp/gfp (left panel) or Sharpin cpdm/cpdm; Foxp3 gfp/gfp (right panel) Cell Trace Violet‐labelled conventional T (Tconv) cells were incubated with varying concentrations of Sharpin +/+; Foxp3 gfp/gfp or Sharpin cpdm/cpdm; Foxp3 gfp/gfp Treg cells in the presence of anti‐CD3/anti‐CD28. Proliferation of Tconv cells was determined by flow cytometry. Data are depicted as mean of triplicate wells ± SEM. One representative experiment of three is shown. (b) Sharpin +/+; Foxp3 gfp/gfp or Sharpin cpdm/cpdm; Foxp3 gfp/gfp Tconv were cultured in the presence of anti‐CD3/anti‐CD28 and transforming growth factor‐β for 6 days to generate iTreg. The percentage of viable FOXP3+ cells was determined by flow cytometry. Data are depicted as mean ± SEM. n = 5–6. (c) C57BL/6 Cell Trace Violet‐labelled Tconv were incubated with varying concentrations of Sharpin +/+; Foxp3 gfp/gfp or Sharpin cpdm/cpdm; Foxp3 gfp/gfp iTreg in the presence of anti‐CD3/anti‐CD28. Proliferation of Tconv was determined by flow cytometry. Data are depicted as mean of triplicate wells ± SEM. One representative experiment of three is shown.
SHARPIN‐deficient conventional T cells can be converted into fully suppressive iTreg cells
Peripheral Treg cells consist of two populations, i.e. thymus‐derived natural ‘nTreg’ and extrathymic‐derived induced ‘iTreg’, the latter of which are generated from Tconv by environmental factors. To test whether generation of iTreg depends on SHARPIN, we cultured isolated Tconv cells from wild‐type and SHARPIN‐deficient mice in the presence of iTreg‐conducive conditions, i.e. the presence of anti‐CD3/anti‐CD28 and transforming growth factor‐β. After 6 days, cells were analysed by flow cytometry and in suppression assays. As shown in Fig. 5b, the numbers of iTreg cells generated from wild‐type and SHARPIN‐deficient Tconv cells were comparable. Moreover, wild‐type and SHARPIN‐deficient iTreg cells suppressed proliferation of Tconv cells to the same extent (Fig. 5c). As such, SHARPIN is not required for generation of iTreg, at least not in vitro.
Discussion
Here we show that SHARPIN plays a critical role in the development of natural Treg cells. Although the overall number of Treg cells in Sharpin cpdm/cpdm mice was significantly reduced, FOXP3 expression in mature Treg cells and their suppressive function was not affected by the lack of SHARPIN. Given their reduced cell numbers in the thymus, it is therefore likely that thymic development is the primary reason for the observed Treg cell deficiency in peripheral lymphoid organs.
Attenuated Treg cell development, such as observed in Scurfy, Nik−/− mice and Nr4aTKO mice7, 23, 24, 25 has been associated with a range of inflammatory diseases similar to that observed in Sharpin cpdm/cpdm mice, with scaly skin and dermal thickening, splenomegaly, eosinophilia and inflammation in the lung and liver. Interestingly, all of these mice also show repressed Th1 differentiation and augmented Th2 immune responses,23, 26, 27, 28 indicating an interdependence of the two observations, i.e. Treg‐deficiency and Th‐development. Treg cells are recruited to sites of inflammation, and seem to have the ability to adapt to the local environment, reflected by the expression of transcription factors and other genes associated with a certain Th bias.29, 30, 31 Consistent with this interpretation, we found that Sharpin‐deficient Treg cells expressed significantly higher levels of Th2‐associated genes, such as Il4, Il5 and Gata3, whereas Ifng levels were reduced, suggesting that Sharpin cpdm/cpdm Treg cells have adapted to the Th2 environment observed in Sharpin cpdm/cpdm mice.
It is still unclear whether the inflammatory disease and Th2 bias is a consequence of the reduced amounts of Treg cells and their inhibitory capacity or, alternatively, if the reduction in Treg cell numbers is mediated, or at least accentuated, by the Th2 bias. As mentioned, there seems to be a correlation between Th2 bias and reduced amounts of Treg cells. Several mouse strains with reduced numbers of Treg cells develop preferentially a Th2‐biased immune responses.7, 23, 24, 25, 26 Furthermore, depletion of Treg cells in a transgenic mouse model based on the expression of diphtheria toxin receptor under the control of the Foxp3 gene locus leads to a scurfy‐like phenotype and exaggerated Th2 responses.32, 33 Our mixed bone‐marrow chimera experiments demonstrate an intrinsic defect in the generation of thymic Treg cells in SHARPIN‐deficient cells, suggesting that the reduction of Treg cells in SHARPIN‐deficient mice precedes Th2 development, rather than being a consequence thereof. Still, Th2 cytokines were found to inhibit FOXP3+ Treg development,34 and reduced expression of FOXP3 in turn can lead to conversion of Treg cells into Th2‐biased T effector cells.35 As such, it seems possible that Th2‐development further inhibits Treg cell generation in the periphery, which has not been investigated.
Interestingly, Sharpin‐deficient Treg cells resemble a phenotype similar to the phenotype observed upon Treg‐cell‐specific deletion of Irf4, including impaired regulation of Th2 responses, and systemic and skin inflammation without changes in FOXP3 expression and intact in vitro suppressor capacity.36 However, in contrast to the reduced numbers of T cells and myeloid infiltrations found in Sharpin‐deficient mice, Treg‐cell‐specific deletion of Irf4 resulted in expansion of peripheral T cells, including Treg cells, and lymphadenopathy. Although both IRF4 and FOXP3 seem feasible candidates for the deregulation of Treg cells observed in Sharpin cpdm/cpdm mice, we did not observe any difference in the expression levels of Foxp3 and Irf4 between Sharpin +/+ and Sharpin cpdm/cpdm Treg cells. Whether Sharpin controls FOXP3 or IRF4 at a posttranscriptional level needs to be investigated.
The signalling strength of TCR engagement appears to be one major determinant for T‐cell development, where low affinity interactions are required for positive selection, whereas stronger signals result in negative selection of Tconv, but are required for Treg development.10, 37 As revealed in the bone marrow‐chimeric mice, Treg cell generation in the absence of SHARPIN was almost completely ablated, indicating that proper TCR signalling might depend on SHARPIN. Consistent with this interpretation, SHARPIN‐deficient cells show reduced (albeit not ablated) NF‐κB and JNK activation upon TCR triggering. This phenotype is similar to Jurkat lymphoma cells, where short hairpin RNA‐mediated knock‐down of RNF31 resulted in reduced, but not completely inhibited, NF‐κB activation, suggesting that the two LUBAC components SHARPIN and RNF31 contribute to an optimal TCR signalling output, possibly by modulating proper assembly of the CBM complex.3 Although this more subtle reduction in TCR signalling may be less limiting for the generation of naive Tconv, it is likely to be more significant for the generation of Treg, particularly during in vivo development, which depends on increased TCR signalling strength.37 In vitro, such signaling strength may be conveyed by artificial TCR‐/CD28‐ligation, allowing efficient iTreg cell generation in context with exogenous transforming growth factor‐β. Consistent with this interpretation, iTreg cell generation from naive T cells upon TCR‐ligation under Treg‐conducive conditions was not affected by the loss of SHARPIN. Of note, these iTreg cells, as well as their ex vivo isolated nTreg cell counterparts from SHARPIN‐deficient mice, showed suppressive activity comparable to the wild‐type cells, suggesting that Treg cell development rather than effector functions are controlled by SHARPIN.
This idea is further supported by the fact that mice deficient for other TCR signalling molecules mediating activation of NF‐κB, such as components of the CBM complex (BCL10, CARMA1, MALT1), IKK‐β and REL, also show defects in Treg cell development.15, 16, 17, 18, 19, 20 REL‐deficient mice display severe Treg cell developmental defects; however, similar to Sharpin cpdm/cpdm Treg cells, the remaining REL‐deficient Treg cells show normal FOXP3 expression levels.38 Of note, as opposed to SHARPIN‐deficient mice, neither BCL10‐, CARMA1‐, MALT1‐, IKKβ‐ nor REL‐deficient mice develop an inflammatory disease as observed in Sharpin cpdm/cpdm mice despite their defect in Treg cell development. However, in contrast to SHARPIN deficiency, deletion of components of the CBM and IKK complex leads to more severe reduction of TCR‐mediated NF‐κB activation, as well as an overall reduction of activated T cells.39, 40, 41 As such, although the susceptibility for inflammatory disease due to Treg cell deficiency may be similar in different mouse strains, the concomitant lack of activated, potentially autoreactive Teff cells in mice with more severe defects in TCR‐signalling may limit disease development.
Although Treg cell generation and maintenance critically depend on TCR signalling,42, 43 the role of antigen receptor stimulation for suppressor activity is not clear. In vitro and in vivo experiments have provided evidence that Treg cells need to be activated through the TCR to become suppressive,42, 44, 45 whereas other studies showed that Treg‐mediated suppression can occur in the absence of TCR stimulation.46 As detailed above, we found SHARPIN to be dispensable for the suppressive activity of nTreg cells and in vitro‐generated iTreg cells, indicating that TCR‐signalling during cell suppression may be less relevant. Still, also in this context, it is important to note that in contrast to the studies mentioned above, which are based on mice with more severe defects in TCR signalling, SHARPIN‐deficient Treg exhibit only partially defective TCR signalling, specifically involving NF‐κB and JNK activation. While the results obtained from SHARPIN‐deficient Treg cells do not therefore contribute to the principle question related to the necessity of TCR signalling during cell suppression, they do suggest that at least a partial defect is less critical for Treg effector functions.
The precise role of SHARPIN in the TCR signalling pathway has not yet been established. As mentioned, two recent studies found the LUBAC complex to be involved in antigen‐receptor‐mediated signal transduction. Components of the LUBAC complex were found to be recruited into the CBM complex upon antigen receptor stimulation in Jurkat lymphoma cells and in activated B‐cell‐like diffuse large B‐cell lymphoma cells.3, 47 Short hairpin RNA‐mediated knockdown of SHARPIN and the LUBAC component RNF31, or blocking LUBAC activation by using an inhibitory RNF31 peptide led to reduced NF‐κB activity upon antigen receptor stimulation and impaired proliferation of activated B‐cell‐like diffuse large B‐cell lymphoma cells.3, 47 Interestingly, neither RNF31 catalytic activity nor RBCK1was required for antigen receptor‐mediated activation of NF‐κB in these cell lines,3, 48 suggesting that the LUBAC complex, or individual components thereof, may act as structural components in this signalling cascade, rather than by linear ubiquitination of protein substrates. Such a LUBAC‐independent role for SHARPIN has been described for its function in integrin activation.49, 50 Whether SHARPIN‐mediated Treg cell development is independent or dependent on linear ubiquitination mediated by the catalytic activity of the LUBAC complex will therefore require further investigation.
Disclosure
The authors declare no commercial or financial conflict of interest.
Acknowledgements
We gratefully acknowledge Vijay Kuchroo for providing us with the Foxp3GFP mouse, Dario Vignali for critical discussion and Liying Chi and Ruiqong Wu for technical assistance. We would also like to thank Richard Cross, Parker Ingle and Greig Lennon for flow cytometry support and the ARC facility at St Jude Children's Research Hospital for animal care and assistance. This work was supported by the American Lebanese Syrian Associated Charities.
References
- 1. Zak DE, Schmitz F, Gold ES, Diercks AH, Peschon JJ, Valvo JS et al Systems analysis identifies an essential role for SHANK‐associated RH domain‐interacting protein (SHARPIN) in macrophage Toll‐like receptor 2 (TLR2) responses. Proc Natl Acad Sci U S A 2011; 108:11536–41. [DOI] [PMC free article] [PubMed] [Google Scholar]
- 2. Sasaki K, Iwai K. Roles of linear ubiquitinylation, a crucial regulator of NF‐κB and cell death, in the immune system. Immunol Rev 2015; 266:175–89. [DOI] [PubMed] [Google Scholar]
- 3. Dubois SM, Alexia C, Wu Y, Leclair HM, Leveau C, Schol E et al A catalytic‐independent role for the LUBAC in NF‐κB activation upon antigen receptor engagement and in lymphoma cells. Blood 2014; 123:2199–203. [DOI] [PubMed] [Google Scholar]
- 4. Wang Z, Potter CS, Sundberg JP, Hogenesch H. SHARPIN is a key regulator of immune and inflammatory responses. J Cell Mol Med 2012; 16:2271–9. [DOI] [PMC free article] [PubMed] [Google Scholar]
- 5. HogenEsch H, Torregrosa SE, Boggess D, Sundberg BA, Carroll J, Sundberg JP. Increased expression of type 2 cytokines in chronic proliferative dermatitis (cpdm) mutant mice and resolution of inflammation following treatment with IL‐12. Eur J Immunol 2001; 31:734–42. [DOI] [PubMed] [Google Scholar]
- 6. Hori S, Nomura T, Sakaguchi S. Control of regulatory T cell development by the transcription factor Foxp3. Science 2003; 299:1057–61. [DOI] [PubMed] [Google Scholar]
- 7. Fontenot JD, Gavin MA, Rudensky AY. Foxp3 programs the development and function of CD4+ CD25+ regulatory T cells. Nat Immunol 2003; 4:330–6. [DOI] [PubMed] [Google Scholar]
- 8. Wildin RS, Ramsdell F, Peake J, Faravelli F, Casanova JL, Buist N et al X‐linked neonatal diabetes mellitus, enteropathy and endocrinopathy syndrome is the human equivalent of mouse scurfy. Nat Genet 2001; 27:18–20. [DOI] [PubMed] [Google Scholar]
- 9. Bennett CL, Christie J, Ramsdell F, Brunkow ME, Ferguson PJ, Whitesell L et al The immune dysregulation, polyendocrinopathy, enteropathy, X‐linked syndrome (IPEX) is caused by mutations of FOXP3. Nat Genet 2001; 27:20–1. [DOI] [PubMed] [Google Scholar]
- 10. Sakaguchi S, Yamaguchi T, Nomura T, Ono M. Regulatory T cells and immune tolerance. Cell 2008; 133:775–87. [DOI] [PubMed] [Google Scholar]
- 11. van der Veeken J, Arvey A, Rudensky A. Transcriptional control of regulatory T‐cell differentiation. Cold Spring Harb Symp Quant Biol 2013; 78:215–22. [DOI] [PubMed] [Google Scholar]
- 12. Bandukwala HS, Rao A. ‘Nurr'ishing Treg cells: Nr4a transcription factors control Foxp3 expression. Nat Immunol 2013; 14:201–3. [DOI] [PMC free article] [PubMed] [Google Scholar]
- 13. Haiqi H, Yong Z, Yi L. Transcriptional regulation of Foxp3 in regulatory T cells. Immunobiology 2011; 216:678–85. [DOI] [PubMed] [Google Scholar]
- 14. Gupta S, Manicassamy S, Vasu C, Kumar A, Shang W, Sun Z. Differential requirement of PKC‐θ in the development and function of natural regulatory T cells. Mol Immunol 2008; 46:213–24. [DOI] [PMC free article] [PubMed] [Google Scholar]
- 15. Barnes MJ, Krebs P, Harris N, Eidenschenk C, Gonzalez‐Quintial R, Arnold CN et al Commitment to the regulatory T cell lineage requires CARMA1 in the thymus but not in the periphery. PLoS Biol 2009; 7:e51. [DOI] [PMC free article] [PubMed] [Google Scholar]
- 16. Medoff BD, Sandall BP, Landry A, Nagahama K, Mizoguchi A, Luster AD et al Differential requirement for CARMA1 in agonist‐selected T‐cell development. Eur J Immunol 2009; 39:78–84. [DOI] [PMC free article] [PubMed] [Google Scholar]
- 17. Wan YY, Chi H, Xie M, Schneider MD, Flavell RA. The kinase TAK1 integrates antigen and cytokine receptor signaling for T cell development, survival and function. Nat Immunol 2006; 7:851–8. [DOI] [PubMed] [Google Scholar]
- 18. Schmidt‐Supprian M, Tian J, Grant EP, Pasparakis M, Maehr R, Ovaa H et al Differential dependence of CD4+ CD25+ regulatory and natural killer‐like T cells on signals leading to NF‐κB activation. Proc Natl Acad Sci U S A 2004; 101:4566–71. [DOI] [PMC free article] [PubMed] [Google Scholar]
- 19. Long M, Park SG, Strickland I, Hayden MS, Ghosh S. Nuclear factor‐κB modulates regulatory T cell development by directly regulating expression of Foxp3 transcription factor. Immunity 2009; 31:921–31. [DOI] [PubMed] [Google Scholar]
- 20. Ruan Q, Kameswaran V, Tone Y, Li L, Liou HC, Greene MI et al Development of Foxp3+ regulatory T cells is driven by the c‐Rel enhanceosome. Immunity 2009; 31:932–40. [DOI] [PMC free article] [PubMed] [Google Scholar]
- 21. Bettelli E, Carrier Y, Gao W, Korn T, Strom TB, Oukka M et al Reciprocal developmental pathways for the generation of pathogenic effector TH17 and regulatory T cells. Nature 2006; 441:235–8. [DOI] [PubMed] [Google Scholar]
- 22. Rudensky AY. Regulatory T cells and Foxp3. Immunol Rev 2011; 241:260–8. [DOI] [PMC free article] [PubMed] [Google Scholar]
- 23. Sekiya T, Kashiwagi I, Yoshida R, Fukaya T, Morita R, Kimura A et al Nr4a receptors are essential for thymic regulatory T cell development and immune homeostasis. Nat Immunol 2013; 14:230–7. [DOI] [PubMed] [Google Scholar]
- 24. Tamura C, Nakazawa M, Kasahara M, Hotta C, Yoshinari M, Sato F et al Impaired function of dendritic cells in alymphoplasia (aly/aly) mice for expansion of CD25+ CD4+ regulatory T cells. Autoimmunity 2006; 39:445–53. [DOI] [PubMed] [Google Scholar]
- 25. Khattri R, Cox T, Yasayko SA, Ramsdell F. An essential role for Scurfin in CD4+ CD25+ T regulatory cells. Nat Immunol 2003; 4:337–42. [DOI] [PubMed] [Google Scholar]
- 26. Hacker H, Chi L, Rehg JE, Redecke V. NIK prevents the development of hypereosinophilic syndrome‐like disease in mice independent of IKKα activation. J Immunol 2012; 188:4602–10. [DOI] [PMC free article] [PubMed] [Google Scholar]
- 27. Sharma R, Sung SS, Fu SM, Ju ST. Regulation of multi‐organ inflammation in the regulatory T cell‐deficient scurfy mice. J Biomed Sci 2009; 16:20. [DOI] [PMC free article] [PubMed] [Google Scholar]
- 28. Blair PJ, Bultman SJ, Haas JC, Rouse BT, Wilkinson JE, Godfrey VL. CD4+ CD8– T cells are the effector cells in disease pathogenesis in the scurfy (sf) mouse. J Immunol 1994; 153:3764–74. [PubMed] [Google Scholar]
- 29. Noval Rivas M, Burton OT, Wise P, Charbonnier LM, Georgiev P, Oettgen HC et al Regulatory T cell reprogramming toward a Th2‐cell‐like lineage impairs oral tolerance and promotes food allergy. Immunity 2015; 42:512–23. [DOI] [PMC free article] [PubMed] [Google Scholar]
- 30. Yu F, Sharma S, Edwards J, Feigenbaum L, Zhu J. Dynamic expression of transcription factors T‐bet and GATA‐3 by regulatory T cells maintains immunotolerance. Nat Immunol 2015; 16:197–206. [DOI] [PMC free article] [PubMed] [Google Scholar]
- 31. Campbell DJ, Koch MA. Phenotypical and functional specialization of FOXP3+ regulatory T cells. Nat Rev Immunol 2011; 11:119–30. [DOI] [PMC free article] [PubMed] [Google Scholar]
- 32. Lahl K, Loddenkemper C, Drouin C, Freyer J, Arnason J, Eberl G et al Selective depletion of Foxp3+ regulatory T cells induces a scurfy‐like disease. J Exp Med 2007; 204:57–63. [DOI] [PMC free article] [PubMed] [Google Scholar]
- 33. Fyhrquist N, Lehtimaki S, Lahl K, Savinko T, Lappetelainen AM, Sparwasser T et al Foxp3+ cells control Th2 responses in a murine model of atopic dermatitis. J Invest Dermatol 2012; 132:1672–80. [DOI] [PubMed] [Google Scholar]
- 34. Wei J, Duramad O, Perng OA, Reiner SL, Liu YJ, Qin FX. Antagonistic nature of T helper 1/2 developmental programs in opposing peripheral induction of Foxp3+ regulatory T cells. Proc Natl Acad Sci U S A 2007; 104:18169–74. [DOI] [PMC free article] [PubMed] [Google Scholar]
- 35. Wan YY, Flavell RA. Regulatory T‐cell functions are subverted and converted owing to attenuated Foxp3 expression. Nature 2007; 445:766–70. [DOI] [PubMed] [Google Scholar]
- 36. Zheng Y, Chaudhry A, Kas A, de Roos P, Kim JM, Chu TT et al Regulatory T‐cell suppressor program co‐opts transcription factor IRF4 to control TH2 responses. Nature 2009; 458:351–6. [DOI] [PMC free article] [PubMed] [Google Scholar]
- 37. Moran AE, Holzapfel KL, Xing Y, Cunningham NR, Maltzman JS, Punt J et al T cell receptor signal strength in Treg and iNKT cell development demonstrated by a novel fluorescent reporter mouse. J Exp Med 2011; 208:1279–89. [DOI] [PMC free article] [PubMed] [Google Scholar]
- 38. Isomura I, Palmer S, Grumont RJ, Bunting K, Hoyne G, Wilkinson N et al c‐Rel is required for the development of thymic Foxp3+ CD4 regulatory T cells. J Exp Med 2009; 206:3001–14. [DOI] [PMC free article] [PubMed] [Google Scholar]
- 39. Ruland J, Duncan GS, Elia A, del Barco Barrantes I, Nguyen L, Plyte S et al Bcl10 is a positive regulator of antigen receptor‐induced activation of NF‐κB and neural tube closure. Cell 2001; 104:33–42. [DOI] [PubMed] [Google Scholar]
- 40. Hara H, Wada T, Bakal C, Kozieradzki I, Suzuki S, Suzuki N et al The MAGUK family protein CARD11 is essential for lymphocyte activation. Immunity 2003; 18:763–75. [DOI] [PubMed] [Google Scholar]
- 41. Ruefli‐Brasse AA, French DM, Dixit VM. Regulation of NF‐κB‐dependent lymphocyte activation and development by paracaspase. Science 2003; 302:1581–4. [DOI] [PubMed] [Google Scholar]
- 42. Vahl JC, Drees C, Heger K, Heink S, Fischer JC, Nedjic J et al Continuous T cell receptor signals maintain a functional regulatory T cell pool. Immunity 2014; 41:722–36. [DOI] [PubMed] [Google Scholar]
- 43. Lee HM, Bautista JL, Scott‐Browne J, Mohan JF, Hsieh CS. A broad range of self‐reactivity drives thymic regulatory T cell selection to limit responses to self. Immunity 2012; 37:475–86. [DOI] [PMC free article] [PubMed] [Google Scholar]
- 44. Thornton AM, Shevach EM. CD4+ CD25+ immunoregulatory T cells suppress polyclonal T cell activation in vitro by inhibiting interleukin 2 production. J Exp Med 1998; 188:287–96. [DOI] [PMC free article] [PubMed] [Google Scholar]
- 45. Takahashi T, Kuniyasu Y, Toda M, Sakaguchi N, Itoh M, Iwata M et al Immunologic self‐tolerance maintained by CD25+ CD4+ naturally anergic and suppressive T cells: induction of autoimmune disease by breaking their anergic/suppressive state. Int Immunol 1998; 10:1969–80. [DOI] [PubMed] [Google Scholar]
- 46. Szymczak‐Workman AL, Workman CJ, Vignali DA. Cutting edge: regulatory T cells do not require stimulation through their TCR to suppress. J Immunol 2009; 182:5188–92. [DOI] [PMC free article] [PubMed] [Google Scholar]
- 47. Yang Y, Schmitz R, Mitala J, Whiting A, Xiao W, Ceribelli M et al Essential role of the linear ubiquitin chain assembly complex in lymphoma revealed by rare germline polymorphisms. Cancer Discov 2014; 4:480–93. [DOI] [PMC free article] [PubMed] [Google Scholar]
- 48. Sasaki Y, Sano S, Nakahara M, Murata S, Kometani K, Aiba Y et al Defective immune responses in mice lacking LUBAC‐mediated linear ubiquitination in B cells. EMBO J 2013; 32:2463–76. [DOI] [PMC free article] [PubMed] [Google Scholar]
- 49. Rantala JK, Pouwels J, Pellinen T, Veltel S, Laasola P, Mattila E et al SHARPIN is an endogenous inhibitor of β1‐integrin activation. Nat Cell Biol 2011; 13:1315–24. [DOI] [PMC free article] [PubMed] [Google Scholar]
- 50. Pouwels J, Nevo J, Pellinen T, Ylanne J, Ivaska J. Negative regulators of integrin activity. J Cell Sci 2012; 125:3271–80. [DOI] [PubMed] [Google Scholar]