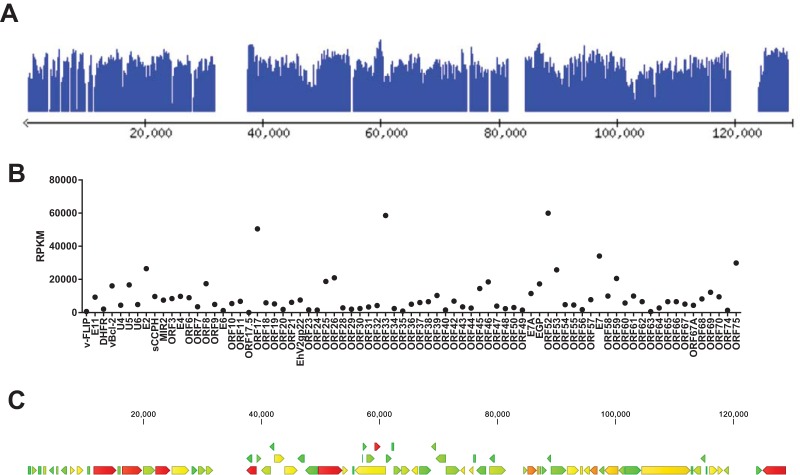
FIG 7 .
RNA-seq analysis from the MVI-it culture indicates that a majority of the BGHV8 coding sequences are transcribed. (A) Screen shot of RNA-seq reads mapped to each CDS of the BGHV8 genome. The data are presented in the Lightweight Genome Viewer (lwgv). The y axis is a log10 coverage scale, and the genomic position is displayed on the x axis. Interactive access to the coverage data across the BGHV8 genome is available at http://katahdin.mssm.edu/ravi/web/lwgv/lwgv.cgi?ann=nbghv_3.ann. (B) Reads per kilobase of transcript per million mapped reads (RPKM) for each CDS of BGHV8 are displayed. (C) A heat map imposed on the BGHV8 genome also illustrates the relative expression of each CDS. Green denotes the lowest RPKM values, yellow/orange indicates intermediate RPKM values, and red indicates the highest RPKM values. Raw reads and RPKM data are available through GEO (GSE76756).

