

Abstract
Chemical variation of Silybum marianum growing in the north, middle, and south of Egypt was investigated. Variation was assessed according to the content of the individual silymarin components in the fruits of the plant. The fruits were distinguished according to location, plant variety, and fruit color (maturity). Accelerated solvent extraction was used to standardize the silymarin extraction. Quantitative analysis of the content of silymarin components was carried out using HPLC with qNMR-controlled reference standards of taxifolin and seven major flavonolignans including silybin A, silybin B, isosilybin A, isosilybin B, silychristin, isosilychristin, and silydianin. The quantification method was validated in accordance with ICH guidelines. Principal component analysis and hierarchical clustering were carried out to create homogeneous clusters of samples based on the content of the silymarin components. Taxifolin had the lowest correlation relative to other silymarin components, whereas silybin A was positively correlated with silybin B. The samples clustered into three classes: silydianin-rich samples, samples with an average silymarin content of <18.8 mg/g, and one class enriched in silymarin (>18.8 mg/g). S. marianum growing in the Nile delta showed the highest silymarin content. No correlation was found between fruit color and silymarin content, indicating that the fruit maturity stage has no significance.
Keywords: Silybum marianum, Silymarin, Accelerated solvent extraction, Chemical variation, Principal component analysis, Agglomerative hierarchical clustering
1. Introduction
Milk thistle [Silybum marianum (L.) Gaertn., Asteraceae] is an annual or biennial herb, native to the Mediterranean and North African regions (Morazzoni and Bombardelli, 1995). The plant has an erect ridged stem that reaches to heights 150 cm and deeply lobed leaves characterized by white patches along its veins. The fruits of S. marianum are of achene type having shiny dark brown–black color. Two varieties of this species occur in Egypt; variety purple with purple corollas and variety albiflorum with white corollas (Boulos, 2002). The two varieties are growing wild along canal banks, roadsides, and waste ground. The plant is classified according to its ecological amplitude as a frequent species in the canal bank habitats of the Nile in Egypt (Mashaly et al., 2010).
Silymarin, in the form of a standardized extract prepared from milk thistle fruits, is widely used as hepatoprotective agent. Silymarin exerts its hepatoprotective activity through antiviral, anti-inflammatory, antioxidant, and immuno-modulatory actions in the liver and immune cells (Polyak et al., 2007; Ahmed-Belkacem et al., 2010; Morishima et al., 2010; Wagoner et al., 2010). Silymarin has also shown in vitro efficacy as a cancer chemopreventive agent by arresting human prostate carcinoma proliferation in cancer cell cultures (Tyagi et al., 2002) and in human cancer models (Singh et al., 2002). The name, silymarin, was originally introduced by Wagner et al. (1965) when describing the flavonolignans mixture as containing silybin, isosilybin, silydianin, and silychristin. Subsequently, this mixture has been further resolved into so far seven flavonolignans and one flavonoid (Fig. 1) that altogether comprise 65–80% of the milk thistle extract. Both silybin and isosilybin were subsequently resolved into pairs of diastereoisomers, silybin A & B and isosilybin A & B, respectively. The isosilybins A and B are regioi-somers of silybin A and B, respectively. The absolute configurations of these four isomers studied using 2D NMR and CD spectroscopy (Kim et al., 2003).
Fig. 1.

Chemical structures of silymarin components.
In 2014, the plant was placed at the sixth position among the twenty top-selling herbal dietary supplements in the natural and health food market and position among the forty top-selling herbal supplements in the mainstream multi-outlet channel market in U.S., at about $9.2 million and $16,4 million, respectively (Smith et al., 2015). According to the European Pharmacopoeia and the United States National Formulary, mature fruits of S. marianum yield not less than 1.5–2% of silymarin.
It is well known that medicinal plants collected from different locations may considerably differ in their active constituents, resulting in potentially different therapeutic efficacy. These differences are caused by various environmental conditions and habitats in which the medicinal plants are grown. The plants develop locally adopted subpopulations, known as ecotypes (Shokrpour et al., 2007). Variation in the ecotypes can be characterized by chemical or genetic means (Mahmood et al., 2010; AbouZid, 2014). Analysis of chemical variation by chromatographic or spectroscopic provides a means of measuring and standardizing the metabolites responsible for the therapeutic effects of milk thistle.
The present study was aimed at differentiating wild populations of S. marianum growing in Egypt based on their silymarin content as a potential source for silymarin products. The study was also designed to determine whether links exist between the chemical variation and the location, plant variety, or fruit color as an indicator of maturity of the fruits.
2. Materials and methods
2.1. Chemicals
Silymarin (S0292-10G, Sigma, China), silybin primary reference standard 92.53% (HWI ANALYTIK GMBH pharma solutions, Rülzheim, Germany), and taxifolin analytical standard 85% (Sigma–Aldrich, St. Louis, MO, USA) were used as reference compounds. Isosilychristin, silychristin, and silydianin were prepared by preparative column chromatography and identified by 1H NMR (Abraham et al., 1970; Diep et al., 2007; Napolitano et al., 2013). The solvents used in this study, n-hexane and acetone (Pharmaco-AAper, Brookfield, CT, USA) were of reagent grade and re-distilled. For analytical HPLC, methanol (Fisher Scientific, Fair Lawn New Jersey, USA), water and formic acid (Sigma–Aldrich, St. Louis, MO, USA) were of HPLC grade. Silica gel 60A was used for column chromatography (Fisher Scientific, New Jersey, USA, 200–425 mesh). Sephadex LH-20 (Sigma, Sweden) was used for column chromatography. Pre-coated silica gel plates ALUGRAM® SIL G/UV254 for TLC (E-Merck, 10 × 20 cm) were used for analysis of the extracts, fractions, and isolated compounds. A BRUKER Avance digital NMR spectrophotometer AV400 (9.4 T/400 MHz, Oxford magnet) equipped with 5 mm Z-gradient probe BBO (broadband observe) networked with MS Window-based computer with XWIN-NMR for acquisition and processing of the spectra, was used for acquiring the 1H NMR spectra.
2.2. Plant material
S. marianum fruits heads were collected from populations growing in nine different locations in Egypt during the period 26/3-15/4/2014. The altitude and latitude of the locations are shown in Table 1. Botanical authentication was carried out by Dr. Abdel Halim Mohamed, Flora and Phytotaxonomy Department, Agricultural Research Center, Cairo, Egypt. The fruits were manually separated from the heads and freed of the pappus. Color and size of the fruits were examined (Table 1). Length, width, and thickness of the fruits were measured (mean of six measurements) using a Manostat 15-100-500 (Switzerland) caliper.
Table 1.
Silybum marianum fruit samples collected from Egypt, three replicates were analyzed for each sample.
| Location governorate/city |
Coordinates | Population code |
Fruit sample code |
Variety | Fruit color |
No. fruits/head |
Fruit dimension (L, W, T in mm) |
Silymarin content (mg/g) |
|---|---|---|---|---|---|---|---|---|
| Assiut/Assiut | 27°11′58.56”N | P154 | P154 | purple | brown | 81±28.4 | 6.8, 2.9, 1.8 | 18.89±0.51 |
| 31°10’22.22”E | W154 | W154 | albiflorum | brown | 66±23.2 | 6.7, 2.9, 1.8 | 0.58±0.03 | |
| Beni-suef/Beni-suef | 29°5’4.69”N | P263 | P263 | purple | brown | 137±13.4 | 6.8, 2.8, 1.9 | 8.60±0.59 |
| 31°6’19.91”E | ||||||||
| Beni-suef/Alwasta | 29°25’47.17”N | P26394 | P26394 | purple | brown | 135±20.5 | 7.1, 2.7, 1.9 | 18.63±1.54 |
| 31°11’33.77”E | ||||||||
| Qaliubiya/Dandna | 30°19’53.69”N | 1P64 | 1P64 | purple | brown | 56±23.0 | 6.6, 2.9, 1.9 | 10.14±0.69 |
| 31°12’5.58”E | ||||||||
| Menofia/Kewisna | 30°33’31.51”N | 2P64 | 2P64 | purple | brown | 58±9.7 | 7.3, 2.8, 2.0 | 21.92±0.67 |
| 31°8’5.11”E | ||||||||
| El-beheira/Itai | 30°56’34.57”N | 3P64 | 3P64W | purple | white | 77±28.0 | 7.6, 3.0, 2.1 | 21.40±2.48 |
| Elbaroud | 30°35’13.98”E | |||||||
| 3P64Br | purple | brown | 77±28.0 | 7.2, 2.9, 1.9 | 21.49±1.37 | |||
| 3P64B | purple | black | 77±28.0 | 6.8, 2.8, 1.9 | 21.20±1.57 | |||
| 3W64 | 3W64 | albiflorum | black | 88±27.4 | 7.0, 2.8, 1.9 | 15.91±2.76 | ||
| Cairo–Alexandria | 30°57’45.27”N | 1P + 293 | 1P + 293W | purple | white | 116±40.7 | 7.6, 2.8, 1.8 | 19.69±1.00 |
| Road (1) | 29°49’58.05”E | |||||||
| 1P + 293Br | purple | brown | 116±40.7 | 7.6, 2.8, 1.8 | 14.20±0.81 | |||
| 1P + 293B | purple | black | 116±40.7 | 7.0, 2.8, 1.9 | 15.54±0.48 | |||
| 1W + 293 | 1W + 293 | albiflorum | brown | 119±43.1 | 7.4, 2.8, 1.8 | 9.16±0.16 | ||
| Alexandria/Borg | 30°58’33.40”N | 2P293 | 2P293 | purple | brown | 142±49.8 | 7.0, 2.9, 2.0 | 5.91±0.64 |
| Al-arab | 29°39’41.40”E | |||||||
| Cairo–Alexandria | 31°0’8.45”N | 3P293 | 3P293 | purple | black | 91±7.7 | 6.8, 3.3, 1.9 | 11.02±1.02 |
| Road (2) | 29°48’20.91”E |
2.3. Silymarin extraction
Accelerated Solvent extraction was carried out with a Dionex ASE350 instrument (Dionex Corporation, Sunnyvale, CA, USA) according to a reported method (Wianowska and Wiśniewski, 2015) with modifications. The whole ground fruits (1 g) was placed into a 34-ml stainless steel extraction cell containing filter paper at the bottom. The cell was tightly closed and placed in the extractor. The content of the cell was extracted with acetone at a temperature of 70 °C, at a pressure of 1700 psi, for 15 min. Two extraction cycles were used. For defatting, n-hexane was used at 50 °C, 1600 psi for 30 min. The extraction volumes were 61–64 ml. The extraction solvent was evaporated to dryness under vacuum, dried in a vacuum desiccator, weighed, and re-dissolved in methanol for further chromatography. Three replicates were extracted per each sample.
2.4. Flavonolignan analysis
High performance liquid chromatography analysis was performed on Waters 2695 system using Agilent ZORBAX SB-C18 column (5 μm, 4.6 × 250 mm, PN 880975-902, SNUSCLO10981, USA). A Waters 996 PDA detector was used to monitor the absorbance of the eluent at 288 nm. The mobile phase consisted of MeOH:H2O/0.1% formic acid with a gradient run initiated with 30:70 and increased linearly to 60:40 over 32 min. Flow rate was 1 ml/min. Ambient temperature was used. Empower™ software (Waters Corp., Milford, MA) was used to acquire, process, and analyze chromatographic data.
2.5. Validation of chromatographic method
For determination of linearity, different concentrations of silybin reference standard working solution were transferred to a series of 5-ml volumetric flasks and diluted to volume with methanol, to furnish eight solutions containing 3–630 μg/ml. Each of these solutions was injected in triplicate, and peak areas of silybin were recorded. A calibration curve was constructed relating peak area to the corresponding concentration, and the regression equation was calculated. Repeatability, as intra-day variation, was determined by triplicate analysis of sample 3P64B. Reproducibility, as inter-day variation, was determined by analysis of the same sample on three consecutive days. The limits of detection and quantification were determined in accordance with ICH recommendations. The accuracy of the method was assessed by analysis of medium and high concentrations of pure silybin primary reference standard. The results were compared with the expected results from the regression equation, and accuracy was calculated.
2.6. Isolation of silydianin, silychristin, and isosilychristin
S. marianum crude extract was monitored by thin layer chromatography (TLC) using chloroform (0.1% formic acid):acetone—9.5:0.5, 5:5, 8:2. The TLC plates were examined under ultraviolet light short (254 nm) wavelength, and sprayed with 10% sulfuric acid reagent. The crude extract (2.3 g) was loaded on silica gel (5 g) and the dried loaded silica was applied onto a silica gel column (120 g) using methylene chloride (0.1% formic acid) as a mobile phase and increasing the polarity by acetone (5–50%). Forty fractions (50 ml) were collected. The fractions obtained from column chromatography were concentrated under reduced pressure and monitored by TLC using chloroform:acetone:formic acid (75:16.5:8.5) as a solvent system and 10% sulfuric acid as a spray reagent. The fractions were monitored against authentic silymarin and silybin. Fractions 22 and 23, tested positive for the presence of silychristin, were pooled and further purified on Sephadex LH-20 column chromatography using methanol as a mobile phase. Thirty sub-fractions were collected, concentrated under reduced pressure, and monitored by TLC using chloroform (0.1% formicacid):acetone—9.5: 0.5, 5:5, 8:2. The TLC plates were examined under ultraviolet light short (254 nm) wavelength, and sprayed with 10% sulfuric acid spray reagent. Sephadex CC fractions 7 and 8 showed one spot at Rf value 0.32. These fractions were further analyzed by HPLC and NMR. Fractions 17 and 18, showed a distinct spot under the silybins at Rf value 0.44, were pooled and further purified on Sephadex LH-20 column chromatography using methanol as a mobile phase. Twenty two sub-fractions were collected, concentrated under reduced pressure, and monitored by TLC using chloroform (0.1% formic acid):acetone—9.5:0.5, 5:5, 8:2. The TLC plates were examined under ultraviolet light short (254 nm) wavelength, and sprayed with 10% sulfuric acid. Sephadex CC fractions 5 and 6 showed one spot at Rf value 0.44. These fractions were further analyzed by HPLC and NMR. Fractions 13–16 from the first silica column, tested positive for the presence of silybins, were pooled and further purified on Sephadex LH-20 column chromatography using methanol as a mobile phase. Thirty sub-fractions were collected, concentrated under reduced pressure, and monitored by TLC using chloroform (0.1% formic acid):acetone–9.5:0.5, 5:5, 8:2. The TLC plates were examined under ultraviolet light short (254 nm) wavelength, and sprayed with 10% sulfuric acid spray reagent. The isolated compounds were identified by comparing their spectroscopic data with available literature (Abraham et al., 1970; Diep et al., 2007; Napolitano et al., 2013).
2.7. Purity determination of isolated flavonolignans
An absolute qHNMR method was used for the determination of the purity of silydianin, silychristin, and isosilychristin, using an externally calibrated residual protonated solvent signal as internal calibrant (Pauli et al., 2014). DMSO-d6 was used as NMR solvent. The content of residual protonated DMSO-d5 in the DMSO-d6 lot was established using the internal calibration qHNMR method with silybin primary standard sample as calibrant. The purity of the calibrant was assayed by qHNMR method according to the manufacturer certificate of analysis to be 92.53%. Samples were weighed (0.01 mg accuracy), dissolved in 600 μl of DMSO-d6 (Lot no. 10E-645, Cambridge Isotope Laboratories, Inc., Andover, MA, USA) using a Pressure-Lok gas syringe (VICI Precision Sampling Inc., Baton Rouge, LA, USA), and transferred into 5-mm standard NMR tubes (NORELL Inc., Landisville, NJ, USA). The qHNMR spectrum was measured for the calibration sample using quantitative acquisition and processing parameters as follows: single 90° 1H excitation pulse with GARP carbon decoupling for measuring silydianin and isosilychristin spectra; and standard 30° 1H excitation pulse for measuring silychristin spectrum; relaxation delay 60 s, acquisition time 4 s, number of scans 64, non-spinning mode, sample temperature 25 °C, data points 64 K, dummy scans 4, and pre-acquisition delay 59.57 usec. Probe tuning and matching were performed on each sample. The 1H NMR data were analyzed using ACD NMR Manager, version 12.01. Processing involved zero filling to 262,144 data points, Fourier Transform, manual phase correction, baseline correction, calibration, integration, and peak assignment.
2.8. Statistical analysis
Results are expressed as mean ± SEM. Principal component analysis was used to visualize the correlation between S. marianum samples growing in Egypt using Microsoft Office XLSTAT 2015. Hierarchical clustering was used to create homogeneous clusters of the samples.
3. Results and discussion
3.1. Collection of S. marianum fruit samples
Fruits of S. marianum were collected from nine different locations including one from Upper Egypt, two from Middle Egypt, three from Nile delta, and three from Mediterranean flora (Table 1). Coordinates, altitude and latitude for these locations are shown in Table 1. The fruits were distinguished according to the plant variety; var. purple and var. albiflorum. They were further separated according to their color as creamy white, brown, or black.
3.2. Extraction of S. marianum fruits by accelerated solvent extraction
Silymarin is traditionally extracted from S. marianum fruits using a two-step process according to European Pharmacopoeia. The fruits are first defatted using n-hexane in a Soxhlet extractor for 8 h, and then silymarin is extracted using methanol for 5 h. This method is time consuming, uses large amounts of solvents and generates waste solvent, and importantly is associated with major losses of silymarin during the defatting process. The use of accelerated solvent extraction in the present study reduced time and solvent requirements, used a controlled temperature, and allowed static and dynamic extraction. Its use of solvents at elevated pressure, i.e., temperatures above the boiling points, increased the dynamic of the extraction; enhanced analyte diffusion through cell walls; and decreased solvent viscosity and surface tension. Acetone was used as an extraction solvent as it has been reported to produce the highest silymarin yield (Wianowska and Wiśniewski, 2015).
3.3. Development of a chromatographic method for silymarin determination
An HPLC method was developed to quantify individual silymarin components in the extracts. HPLC has been reported previously as a suitable method for quantitative analysis of silymarin components (Quaglia et al., 1999), comparing RP-18 and RP-8 sorbents for their ability to achieve baseline separation of the flavonolignans. While RP-18 showed good resolution for silybin and isosilybin, silydianin and silychristin resolution was insufficient. Increasing the water concentration in the mobile phase allowed the separation of the two diastereomeric silybins. On the other hand, while RP-8 stationary phase improved the resolution of peaks related to all flavonolignans, it did not resolve the two silybin diastereomers. In the current study, taxifolin and seven flavonolignans representing the major silymarin components were baseline separated (Fig. 2). Available reference standards allowed us to assign retention times for the following silymarin components: taxifolin (Rt = 13.168), silybin A (Rt = 27.138), silybin B (Rt = 28.139), isosilybin A (Rt = 30.174), and isosilybin B (Rt = 30.815). Silydianin, silychristin and isosilychristin were isolated using a two-step column chromatography scheme and identified based on their fingerprint 1H NMR data (Napolitano et al., 2013). The 1H NMR spectra of silydianin, isosilychristin, and silychristin, isolated in the current study as well as silybin (A + B) as primary reference standard are shown in Fig. 3. An absolute qHNMR method was used for the purity determination of these reference materials using the externally calibrated residual protonated solvent signal of DMSO-d6 as internal calibrant. The qHNMR purities and the HPLC retention times were as follows: isosilychristin 73.96% (Rt = 17.805), silychristin 80.80% (Rt = 19.687), and silydianin 84.83% (Rt = 21.455).
Fig. 2.

HPLC chromatogram showing the analysis of silymarin components. The key to peaks: taxifolin (Rt = 13.168), isosilychristin (Rt = 17.805), silychristin (Rt = 19.687), silydianin (Rt = 21.455), silybin A (Rt = 27.138), silybin B (Rt = 28.139), isosilybin A (Rt = 30.174), and isosilybin B (Rt = 30.815).
Fig. 3.

Collected 1H NMR spectra of isolated flavonolignans: primary reference standard sample of silybins (A), silychristin (B), isosilychristin (C), and silydianin (D).
3.4. Validation of the chromatographic method
Next, the HPLC quantification method was validated in accordance with the ICH guidelines. Stock solution of silybin primary reference standard was diluted to a series of concentrations with methanol to test the limits of quantification (LOQ) and detection (LOD). The intra- and inter-day precision was determined for one sample (3P64B) by analyzing three replicates on the same day and on three consecutive days, respectively. The relative standard deviation (RSD%) was taken as a measure of precision. Accuracy was determined using a recovery test upon addition of medium and high amounts of authentic standard samples of silybin (A + B). Each sample was analyzed in triplicate. The validation parameters for the developed method are shown in Table 2.
Table 2.
Validation parameters of the HPLC method for analysis of silymarin components.
| Validation parameter | Value |
|---|---|
| Linear range (mg/ml) | 0.003–0.630 |
| Regression equation | Y = [2.10^(−07)]X−0.066 |
| Regression coefficient | 0.999 |
| LOQ (mg/ml) | 0.003 |
| LOD (μg/ml) | 0.005 |
| Precision (repeatability RSD%, n = 3) | |
| Intra-day | 0.216 |
| Inter-day | 2.785 |
| Accuracy (recovery%) | |
| Medium concentration | 94.797 |
| High concentration | 93.490 |
3.5. Analysis of samples
Using the developed and validated HPLC quantification method, the extracts prepared from the samples of S. marianum fruits collected throughout Egypt were analyzed. The silymarin content in the fruits from different populations growing in Egypt varied between 0.06–2.19% (Table 1). Table 3 shows the content of individual silymarin components in different samples. The data revealed that the two samples of variety albiflorum, 1W + 293 and 3W64, collected from northern Egypt at 29° and 30° N, from Cairo–Alexandria desert road and El-Beheira governorate (north of Egypt), respectively, exhibited the same qualitative flavonolignan patterns typically found in purple varieties. On the other hand, W154 sample (variety albiflorum) collected from Assiut city 27° N (south of Egypt) showed a different flavonolignan profile.
Table 3.
Content of silymarin components in Silybum marianum samples collected from Egypt (mg/g fruits). Values are averages of three replica±standard error. For fruit sample codes, refer to Table 1.
| Fruit sample | Taxifolin | Isosilychristin | Silychristin | Silydianin | Silybin A | Silybin B | Isosilybin A | Isosilybin B |
|---|---|---|---|---|---|---|---|---|
| P154 | 1.64±0.03 | 0.48±0.03 | 4.12±0.11 | 1.29±0.10 | 3.59±0.10 | 5.69±0.14 | 1.59±0.05 | 0.48±0.01 |
| W154 | n. d. | n. d. | 0.27±0.01 | n. d. | 0.07±0.03 | 0.22±0.01 | 0.01±0.01 | n. d. |
| P263 | 0.95±0.04 | 0.54±0.18 | 0.56±0.08 | 4.40±0.53 | 0.20±0.05 | 0.53±0.08 | 0.89±0.03 | 0.53±0.03 |
| P26394 | 1.00±0.11 | 0.34±0.19 | 4.66±0.36 | 0.44±0.05 | 4.08±0.34 | 6.36±0.45 | 1.47±0.13 | 0.29±0.05 |
| 1P64 | 1.18±0.07 | 1.01±0.08 | 0.55±0.02 | 4.36±0.33 | 0.27±0.01 | 0.70±0.03 | 1.30±0.12 | 0.77±0.07 |
| 2P64 | 2.18±0.08 | 0.12±0.03 | 5.40±0.18 | 0.52±0.04 | 4.62±0.16 | 7.08±0.19 | 1.65±0.03 | 0.34±0.01 |
| 3P64W | 2.25±0.27 | 0.16±0.04 | 5.11±0.03 | 0.58±0.25 | 4.46±0.49 | 6.81±0.72 | 1.61±0.20 | 0.32±0.05 |
| 3P64Br | 2.40±0.17 | 0.14±0.01 | 5.19±0.30 | 0.54±0.05 | 4.41±0.32 | 6.85±0.40 | 1.63±0.09 | 0.32±0.04 |
| 3P64B | 2.31±0.18 | 0.16±0.01 | 5.08±0.36 | 0.54±0.05 | 4.41±0.35 | 6.75±0.46 | 1.62±0.12 | 0.33±0.04 |
| 3W64 | 1.35±0.25 | 0.08±0.03 | 3.86±0.67 | 0.39±0.08 | 3.42±0.58 | 5.35±0.88 | 1.23±0.22 | 0.24±0.05 |
| 1P + 293W | 1.61±0.08 | 0.37±0.03 | 4.55±0.21 | 0.76±0.10 | 4.02±0.19 | 6.24±0.11 | 1.69±0.09 | 1.69±0.03 |
| 1P + 293Br | 1.08±0.09 | 0.35±0.02 | 3.17±0.17 | 0.75±0.09 | 2.79±0.15 | 4.41±0.23 | 1.27±0.08 | 0.39±0.03 |
| 1P + 293B | 1.26±0.03 | 0.58±0.02 | 2.92±0.11 | 1.94±0.01 | 2.43±0.10 | 3.97±0.14 | 1.51±0.05 | 0.60±0.02 |
| 1W + 293 | 1.13±0.04 | 1.01±0.02 | 0.46±0.02 | 4.14±0.10 | 0.17±0.01 | 0.52±0.01 | 1.13±0.02 | 0.67±0.02 |
| 2P293 | 0.48±0.03 | 0.50±0.03 | 0.33±0.03 | 2.87±0.50 | 0.14±0.03 | 0.38±0.03 | 0.74±0.03 | 0.48±0.04 |
| 3P293 | 0.57±0.07 | 0.04±0.01 | 2.77±0.24 | 0.24±0.03 | 2.47±0.23 | 3.91±0.35 | 0.86±0.08 | 0.14±0.02 |
The accessions of fruits represented nine different locations, the two varieties purple and albiflorum, and three different colors of fruits: creamy white, brown, and black (Fig. 4). The color of S. marianum fruits (achenes) changes during maturation from creamy white to a light brown or even black color, depending on conditions of the maturation and/or storage. S. marianum deposits pigments in the sub-epidermal layer of the pericarp during its development (Upton et al., 2010; Martinelli et al., 2014), and this process depends on the influence of exterior factors (Stoiljković et al., 2007). It was previously reported that the silymarin content increases concomitantly with the ripening stage of the fruits (Elwekeel et al., 2013). There are two metabolic processes associated with the ripening of the fruits: pigment deposition, responsible for changes in the fruit pericarp, and silymarin formation and/or deposition. Therefore, it was a reasonable hypothesis that these two processes are related; i.e., that black fruits contain more silymarin than the lighter-colored ones. This would have potential implication for the selection of the fruits used for silymarin production in an industrial process or by consumers of the whole fruits. Usually the fruits available commercially exhibit a range of pericarp colors. In the case of S. marianum fruit samples collected from Egypt, samples from two populations (3P64 and 1P + 293) showed all three different colors of the fruits (Table 1), which were separated and analyzed for silymarin content. Notably, based on the present findings, the different-colored fruits are ripe, but immature with regard to pigment deposition. This finding contrasts a previous report that showed silymarin content changes with development of the fruits, i.e. fruits changing their color from creamy white (unripe & immature) to brown to black (ripe & mature).
Fig. 4.
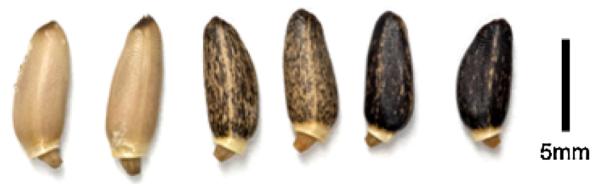
The three different colors of Silybum marianum fruits.
However, Table 1 shows that there is no significant difference in the silymarin content in fruits of different colors collected from population 3P64. This result is confirmed in the overlaid chromatograms of the three ripening stages of the fruits: white, brown, black. The white fruits showed more silymarin content in case of samples collected from population 1P + 293 (Fig. 5).
Fig. 5.

Chromatograms of Silybum marianum fruits (population 3P64) of white (front, solid line), brown (middle, dashed line), and black (back, dotted line) colors.
3.6. Principal component analysis
Principal component analysis (PCA) was carried out to study the relationship between S. marianum growing in Egypt, using Pearson’s correlation coefficient to show their degree of similarity. Cumulative variability (in%) was used to determine the number of factors to be used for data interpretation. Due to the high correlations between the entire variable as shown from the correlation matrix, there were 8 factors for the initial 8 silymarin components. F1 (76.60%) and F2 (16.48%) represented 93.08% of the total variability. Therefore, the variables were represented in the space of these two factors (Fig. 6). The correlation matrix showed that taxifolin has the lowest correlation with other silymarin components. In addition, silybin A and silybin B are positively correlated (r = 1). The outliers are the silydianin-rich samples (1P64, 1W + 293, P263, and 2P293), and S. marianum var. albiflorum collected from Assiut city that showed very low concentrations for the analyzed silymarin components.
Fig. 6.

Principal component analysis of the content of silymarin components in Silybum marianum samples growing in Egypt. Plot of the observations in the space of F1 and F2 representing 93.08% of variability. Fruit sample codes correspond to those in Table 1.
3.7. Agglomerative hierarchical clustering
Agglomerative hierarchical clustering (AHC) was carried out to create homogeneous clusters of samples based on the content of the individual silymarin components. ACH clustered the samples into three classes; the dotted line in the dendrogram (Fig. 7) represents the automatic truncation leading to three classes. The first class has four samples; the second and the third class each have six samples. The first class, displayed in green color, represents the silydianin-rich samples, as shown by PCA in the current study. The second class includes samples containing an average silymarin content (<18.8 mg/g). The third class is comprised of the populations that are most rich in silymarin content. All of the samples belonging to the high-content class were collected from the Nile delta, except for P154.
Fig. 7.

Agglomerative hierarchical clustering for Silybum marianum samples growing in Egypt. Fruit sample codes correspond to those in Table 1.
4. Conclusions
This study focuses on a wild plant of medicinal importance, S. marianum, growing in Egypt. Due to anthropogenic pressures and demand from economic development projects, the areas of wild plants are decreasing with a great loss of the natural biodiversity. Our data show that significant differences in the yield of therapeutically active phytoconstituents exist in Egypt’s wild milk thistle populations, and that these parameters as well as optimized extractions protocols can be used to drive the sustainable use this natural resource.
Supplementary Material
Acknowledgment
The authors appreciate the support by the Science and Technology Development Fund (STDF), Egypt, within the framework of the “Short Term Fellowship (STF) program” project ID 6081. This study received partial support through grant P50 AT000155 from NCCIH and ODS/NIH.
References
- AbouZid S. Authentication of Silybum marianum varieties using RAPD analysis. Plant Tissue Cult. Biotechnol. 2014;24:57–63. [Google Scholar]
- Abraham DJ, Takagi S, Rosenstein RD, Shiono R, Wagner H, Hörhammer L, Seligmann O, Farnsworth NR. The structure of silydianin, an isomer of silymarin (silybin), by X-ray analysis. Tetrahedron Lett. 1970;11:2675–2678. [Google Scholar]
- Ahmed-Belkacem A, Ahnou N, Barbotte L, Wychowski C, Pallier C, Brillet R, Pohl R, Pawlotsky J. Silibinin and related compounds are direct inhibitors of hepatitis C virus RNA-dependent RNA polymerase. Gastroenterology. 2010;138:1112–1122. doi: 10.1053/j.gastro.2009.11.053. [DOI] [PubMed] [Google Scholar]
- Boulos L. Flora of Egypt, Volume three (Verbenaceae—Compositae) Al Hadara Publishing; Cairo, Egypt: 2002. pp. 157–159. [Google Scholar]
- Diep TT, Kiem PV, Dong NT, Tung NH, Bang BT, Minh CV, Braca A. Silychristin and isosilychristin from the fruits of Silybum marianum (L.) Gaertn. J. Chem. 2007;45:106–109. [Google Scholar]
- Elwekeel A, Elfishawy A, AbouZid S. Silymarin content in Silybum marianum fruits at different maturity stages. J. Med. Plants Res. 2013;7:1665–1669. [Google Scholar]
- Kim N, Graf TN, Sparacino CM, Wani MC, Wall ME. Complete isolation and characterization of silybins and isosilybins from milk thistle (Silybum marianum) Org. Biomol. Chem. 2003;1:1684–1689. doi: 10.1039/b300099k. [DOI] [PubMed] [Google Scholar]
- Mahmood T, Nazar N, Abbasi BH, Khan MA, Ahmad M, Zafa M. Detection of somaclonal variations using RAPD fingerprinting in Silybum marianum (L.) J. Med. Plants Res. 2010;4:1822–1824. [Google Scholar]
- Martinelli T, Andrzejewska J, Salis M, Sulas L. Phenological growth stages of Silybum marianum according to the extended BBCH scale. Ann. Appl. Biol. 2014;166:53–66. [Google Scholar]
- Mashaly IA, El-Shahaby OA, El-Ameir YA. Floristic features of the canal bank habitats, Egypt. J. Environ. Sci. 2010;39(4):483–501. [Google Scholar]
- Morazzoni P, Bombardelli E. Silybum marianum (Carduus marianus) Fitoterapia. 1995;66:3–42. [Google Scholar]
- Morishima C, Shuhart MC, Wang CC, Paschal DM, Apodaca MC, Liu Y, Sloan DD, Graf TN, Oberlies NH, Lee DY-W, Jerome KR, Polyak SJ. Silymarin inhibits in vitro T-cell proliferation and cytokine production in hepatitis C virus infection. Gastroenterology. 2010;138:671–681. doi: 10.1053/j.gastro.2009.09.021. [DOI] [PMC free article] [PubMed] [Google Scholar]
- Napolitano JG, Lankin DC, Graf TN, Friesen JB, Chen SN, McAlpine JB, Oberlies NH, Pauli GF. HiFSA fingerprinting applied to isomers with near-identical NMR spectra: the silybin/isosilybin case. J. Org. Chem. 2013;78:2827–2839. doi: 10.1021/jo302720h. [DOI] [PMC free article] [PubMed] [Google Scholar]
- Pauli GF, Chen S, Simmler C, Lankin DC, Gödecke T, Jaki BU, Friesen JB, McAlpine JB, Napolitano JG. Importance of purity evaluation and the potential of quantitative H NMR as a purity assay. J. Med. Chem. 2014;57:9220–9231. doi: 10.1021/jm500734a. [DOI] [PMC free article] [PubMed] [Google Scholar]
- Polyak SJ, Morishima C, Shuhart MC, Wang CC, Liu Y, Lee DY. Inhibition of T-cell inflammatory cytokines, hepatocyte NF-κB signaling, and HCV infection by standardized silymarin. Gastroenterology. 2007;132:1925–1936. doi: 10.1053/j.gastro.2007.02.038. [DOI] [PubMed] [Google Scholar]
- Quaglia MG, Bossù E, Donati E, Mazzanti G, Brandt A. Determination of silymarin in the extract from the dried Silybum marianum fruits by high performance liquid chromatography and capillary electrophoresis. J. Pharm. Biomed. Anal. 1999;19:435–442. doi: 10.1016/s0731-7085(98)00231-3. [DOI] [PubMed] [Google Scholar]
- Shokrpour M, Mohammadi SA, Moghaddam M, Ziai SA, Javanshir A. Variation in flavonolignan concentration of milk thistle (Silybum marianum) fruits grown in Iran. J. Herbs Spices Med. Plants. 2007;13:54–68. [Google Scholar]
- Singh RP, Tyagi AK, Zhao J, Agarwal R. Silymarin inhibits growth and causes regression of established skin tumors in SENCAR mice via modulation of mitogen-activated protein kinases and induction of apoptosis. Carcinogenesis. 2002;23:499–510. doi: 10.1093/carcin/23.3.499. [DOI] [PubMed] [Google Scholar]
- Smith T, Lynch ME, Johnson J, Kawa K, Bauman H, Blumenthal M. Herbal dietary supplement sales in US increase 6.8% in 2014. HerbalGram. 2015;107:52–59. [Google Scholar]
- Stoiljković Z, Petrović S, Ilić B. Examination of localization of silymarin and fatty oil in Silybum marianum (L.) Gaertn. fruit. Chem. Ind. Chem. Eng. Q. 2007;13:55–59. [Google Scholar]
- Tyagi AK, Bhatia N, Condon MS, Bosland MC, Agarwal C, Agarwal R. Antiproliferative and apoptotic effects of silibinin in rat prostate cancer cells. Prostate. 2002;53:211–217. doi: 10.1002/pros.10146. [DOI] [PubMed] [Google Scholar]
- Upton R, Graff A, Jolliffe G, Länger R, Williamson E. American Herbal Pharmacopoeia: Botanical Pharmacognosy-Microscopic Characterization of Botanical Medicines. CRC Press; CA, USA: 2010. pp. 616–618. [Google Scholar]
- Wagner H, Horhamer L, Munster R. Structure of a new flavonoid from the Silybum marianum fruits. Naturwissenschaften. 1965;52:305. [Google Scholar]
- Wianowska D, Wiśniewski M. Simplified procedure of silymarin extraction from Silybum marianum L. Gaertner. J. Chromatogr. Sci. 2015;53:366–372. doi: 10.1093/chromsci/bmu049. [DOI] [PubMed] [Google Scholar]
- Wagoner J, Negash A, Kane OJ, Martinez LE, Nahmias Y, Bourne N, Owen DM, Grove J, Brimacombe C, McKeating JA, Pécheur E, Graf TN, Oberlies NH, Lohmann V, Cao F, Tavis JE, Polyak SJ. Multiple effects of silymarin on the hepatitis C virus lifecycle. Hepatology. 2010;51:1912–1921. doi: 10.1002/hep.23587. [DOI] [PMC free article] [PubMed] [Google Scholar]
Associated Data
This section collects any data citations, data availability statements, or supplementary materials included in this article.