Abstract
Multiphoton microscopy has emerged as a ubiquitous tool for studying microscopic structure and function across a broad range of disciplines. As such, the intent of this paper is to present a comprehensive resource for the construction and performance evaluation of a multiphoton microscope that will be understandable to the broad range of scientific fields that presently exploit, or wish to begin exploiting, this powerful technology. With this in mind, we have developed a guide to aid in the design of a multiphoton microscope. We discuss source selection, optical management of dispersion, image-relay systems with scan optics, objective-lens selection, single-element light-collection theory, photon-counting detection, image rendering, and finally, an illustrated guide for building an example microscope.
1. Introduction: Why Multiphoton Microscopy?
In the relatively short two and a half decades since the demonstration of a multiphoton microscope [1], multiphoton laser scanning microscopy (MPLSM) has grown into a vibrant and productive field. In particular, MPLSM has demonstrated its utility for noninvasive imaging deep within scattering media, such as biological tissue [2–10]. Additionally, multiphoton microscopy provides several contrast mechanisms, including two-photon excitation fluorescence (TPEF) [1,11,12], second-harmonic generation (SHG) [13–17], third-harmonic generation (THG) [18–21], sum-frequency generation (SFG) [22,23], stimulated Raman scattering (SRS) [24], and coherent anti-Stokes Raman spectroscopy (CARS) [25–29]. These contrast modalities are used to extract information pertaining to the structure and function of the specimen under consideration, which is not present in other optical imaging techniques. The application base of multiphoton microscopy continues to grow, encompassing a broad range of basic science applications and clinical diagnostics [3,6,14,30–50].
Because of the utility of MPLSM, one can purchase complete commercial MPLSM systems from the source laser to the data-analysis software. However, this convenience can come at a cost. By making your own home-built MPLSM system, not only can you reduce the expense, you can ensure flexibility in your platform through your understanding of its construction and also by the use of easily replaceable and adjustable off-the-shelf components.
Examples of home-built multiphoton microscopes can be found in the literature [51]. Of particular note is the Parker laboratory’s home-built two-photon microscope [52–55]. Other examples demonstrate how to convert an already present confocal fluorescent microscope to a MPLSM [56].
Because of the broad application base for multiphoton microscopy, this paper will present a guide to designing and building a MPLSM system—well suited for TPEF, SHG and THG imaging—from the selection of an ultrafast laser source to the image processing of the detected signal. With little exception, this microscope system will be assembled completely from off-the-shelf components.
First, we will provide a brief history of microscopy and the developments that led to multiphoton microscopy. Section 2 will explain the advantages of multiphoton microscopy over previous methods of fluorescence microscopy, namely, confocal microscopy. Then Sections 3–10 will provide a thorough guide for microscope construction, from the selection of a laser source to a brief discussion of data analysis and an example built.
We employ a variety of software applications for designing a multiphoton microscope. Many of them have overlapping functionality; however, they also have advantages and drawbacks when compared with one another. We present examples using ZEMAX [57] and Optica [58], ray-tracing tools, which we have used in our laboratory. Besides these, there are many other ray-tracing tools that range in price and application. Some of these are Code V [59], FRED [60], LensLab and Rayica [58] (packages for Mathematica), OpTaliX [61], OPTIS [62] (a tool set for SolidWorks), OSLO [63], and VirtualLab [64].
2. A Brief History of Microscopy from Light to Multiphoton Microscopy
There are many excellent articles and texts that provide a thorough background on the history of microscopy, help to provide a framework for topics germane to microscopy, and describe how the different forms of the microscope came to be [65–73]. There are also excellent articles specifically about nonlinear [74], multiphoton [26,31,33,34,37,38,40,50,75–83], and ultrafast microscopy [78,84–91]
The field of microscopy began with simple and sometimes novel instruments that provided the ability to view the previously unobservable through improvements to resolution, contrast, and magnification (the ability to discriminate between two objects on the basis of distance, color or intensity, and image size, respectively). The human eye is capable of resolving objects as small as 0.1 mm (about the width of a human hair). The white-light microscope can resolve objects as small as 0.2 μm (a blood cell is about 7.5 μm in width [67,73]).
2.1. The Light Microscope
The development and history of the microscope is replete with contributions and independent developments, advancements, and improvements from many sources and places over the course of a few centuries. However, the use of lenses (or lens analogues) and curved mirrors can be found as far back as the first century A.D. Interest in the fundamental structure of natural objects drove the development of the optical light microscope in the 16th and 17th centuries [92,93]. The invention of the single-lens microscope is attributed to the draper Antonie van Leeuwenhoek (1632–1723) who developed a technique for making small spherical lenses. These early microscopes were composed of a single lens that created a large virtual image of the sample analogous to a magnifying glass or loupe [71,73,94,95]. Concurrent with the development of the single-lens microscope, and inseparable from the development of the telescope, was the invention of the bilenticular microscope, for which credit is given to Zaccharias Janssen (1587–1638) and Hans Janssen (1534–1592).
Joseph Jackson Lister (1786–1869) developed the achromatic and spherical-aberration-free Lister objective. This was a landmark achievement for multiple-element microscopes that allowed them to finally be used for production of higher-quality images than their single-lens counterparts. Up to this point, chromatic aberration had been the limiting factor for multilens microscopes. Giaovanni Battista Amici (1786–1863) was the first to use an immersion fluid to increase the resolution. He also used an ellipsoidal-mirror objective to prevent chromatic aberrations, as proposed initially by Christiaan Huygens and Isaac Newton.
Humanity has been aware of, and attempted to model with varying degrees of success, the phenomenon of refraction as far back as Ptolomy (ca. 90–ca. 168). However, early lenses were constructed through a process of trial-and-error in which the quality of the optic was a function of the skill and experience of the lens designer [96–98]. This trial-and-error process was supplanted by Ernst Abbe (1840–1906), who was the first to establish a theoretical framework for quantifying advances in microscope design and describing the role of diffraction in image formation. Abbe noticed that a larger front aperture for an objective often dictated better resolution—though some aberration might be present. This observation led Abbe to formulate the parameter numerical aperture (NA), which along with wavelength yields the classical resolution limit:
| (1) |
| (2) |
Equations (1) and (2) embody the fundamental notion of Abbe’s theory of image formation. The theory states that sample features, which represent a spectrum of spatial frequencies, behave like diffraction gratings. These features diffract the incident light at angles inversely proportional to the features’ size (See Fig. 1). To form an image, different orders of the diffracted light must be focused and the interference of these orders creates the image. If light is diffracted at too great an angle, it does not enter the objective, and image information below a certain feature size is lost [40,67,73,99–109].
Figure 1.
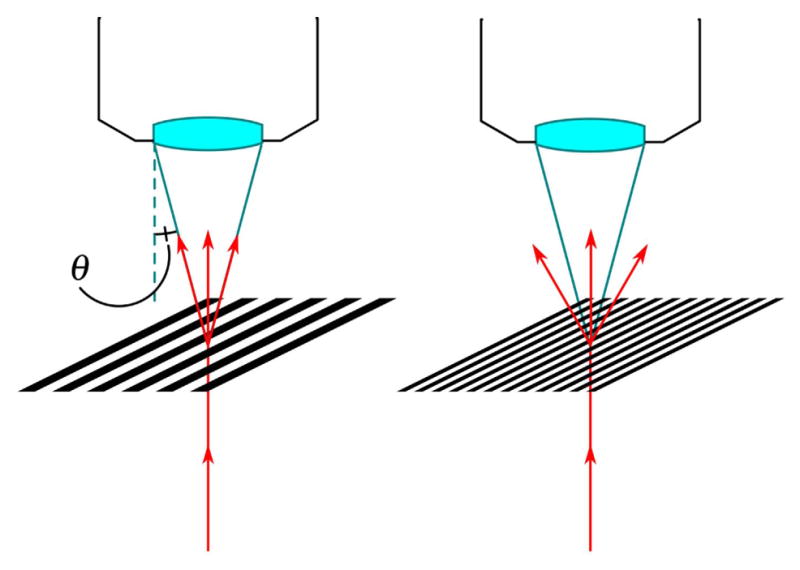
Abbe’s theory of image formation explains how diffracted light from the specimen is collected by an objective lens. Light diffracted at a larger angle than the acceptance angle (θ) of the objective is lost and, thus, so is the spatial information associated with it.
Improvements to contrast came largely from interference techniques. One of the most notable of these was developed by Frits Zernike (1881–1966) who developed phase-contrast microscopy (PCM). PCM translates phase shifts in light, which result from traveling through different parts of the sample (i.e., different optical path lengths), as intensity variations of the brightness [70,72,73,102,110].
2.2. The Fluorescent Microscope
The development of fluorescence microscopy provided additional contrast methods and also a means for improved specificity. Fluorescence microscopy was driven by two advancements. The first was the discovery of both intrinsic (or endogenous) and synthetic fluorescent molecules. The second was advancements in microscope design that used wavelengths in the ultraviolet (UV, 200–400 nm) as a means of improving resolution. The contrast of UV fluorescent microscopes was further improved by the addition of dark-field condensers and lateral illumination (a precursor to light sheet illumination [9,111–116]). These techniques prevented incident light from entering the microscope objective [67,69,102,117–121].
Fluorescence microscopy faces many of the same issues as all types of microscopy, which are noise, limited resolution, and optical aberration. Fluorescence microscopy also has challenges with regards to UV damage (i.e., absorption) of the specimen (e.g., photodamage, photobleaching) and scattering. Photodamage occurs because living cells are more prone to damage given their typical predisposition to absorb UV light [122]. This problem is only made worse by adding fluorescent probes. Photobleaching is the destruction of the fluorescent molecules where excitation illumination can transform the fluorescent molecules into nonfluorescent ones [73,123]. Visually this is realized as a continuous decrease in signal intensity. Scattering is a function of thick samples where the fluorescent light emitted by the probe is scattered on its way to the detector [6,124–130]. Conversely, the excitation beam also may be scattered on its way to the focus. Regardless, the result is a blurred image, decreased resolution and a loss of contrast [5,127,131–133].
Marvin Minsky (1927–) invented the confocal microscope, which eliminated the out-of-focus fluorescent photons from reaching the detector and also provided improved lateral resolution [40,67,69,73,134–137]. The conventional design of the optical microscope images the entire field of view (FOV) simultaneously and provides a high-quality image that is uniform across the field. This requirement is relaxed by allowing the microscope to image a single point at a time (as an example of the boundary between point scanning and wide-field imaging, see [138–141]). The trade-off is that the object, detector, or excitation light must now be scanned to build up an image. If the light from the object is collected by an objective and relayed to a single-element (e.g., photodiode or photomultiplier tube) detector, then a significant improvement in the resolution of the optical system can be realized. This may be achieved with a pinhole aperture at the object or at a conjugate image plane [134,142]. Incidentally, while not necessary for multiphoton microscopy, a pinhole aperture also can have a positive effect on resolution [143,144].
2.3. The Nonlinear Multiphoton Microscope
The obstacles with fluorescence confocal microscopy largely revolve around phototoxicity, limited imaging depth, out-of-focus flare, photo bleaching, and difficulties implementing UV-based lasers and optical systems. Some of these problems can be minimized by transitioning to a multiphoton microscope [31,50].
Multiphoton microscopy falls within the broader field of nonlinear optics or nonlinear optical microscopy (NOM) [27,48,74,76,79,83,91,121,145]. Maria Göppert-Mayer established the theoretical foundation of two-photon quantum transitions in her 1931 doctoral dissertation [146]. Annotated English translations of Göppert-Mayer’s theory of two-quantum processes can be found in Masters and So [147].
With single-photon fluorescence microscopy, the incident photon must match the energy to transition a fluorophore from a ground state to an excited state. With multiphoton and, in this case, TPEF microscopy, two incident photons in the near-infrared with half of the previous energy can cause the fluorophore to be excited provided that they occur within the same quantum event (within 10−16 s [37,148]). Denk, Stickler, and Webb demonstrated the first two-photon microscope in 1990 [1]. Multiphoton microscopy reduces the problems with photo-toxicity by using lower energy photons and limiting their absorption to a small focal region, as defined by the NA of the objective, where a multiphoton quantum transition is probable (see Fig. 2; see also [27,44,50] for additional diagrams of nonlinear optical microscopy modalities). This small focal volume also allows for the elimination of the pinhole aperture in confocal microscopy. The decrease in axial sectioning that occurs from working with longer wavelengths is largely offset by the improvement afforded by the two-photon process, where the signal declines as 1/r4; for single-photon process the signal declines as 1/r2. For higher order processes, the signal declines as 1/r2N, where N is the order [1,69,149].
Figure 2.
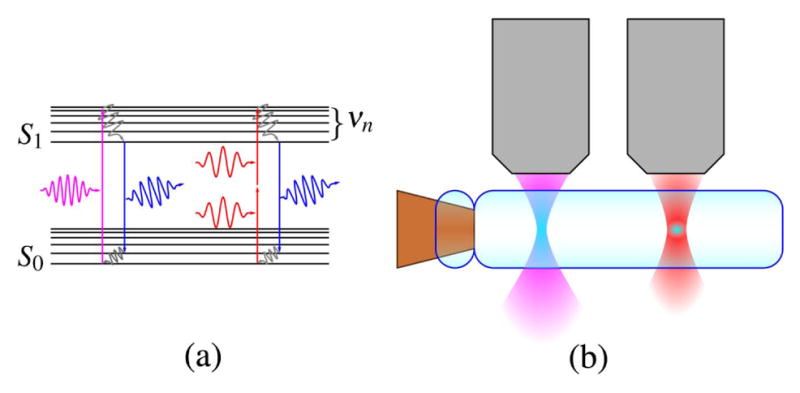
Jablonski diagram of a two-photon transmission and representation of single-and two-photon absorption in a sample.
In addition, photons in the near-infrared penetrate deeper (as far as 500 μm [5,8,150,151]) into the sample and thus provide great utility for deep tissue imaging.
TPEF represents only one nonlinear optical modality. In this paper we will present examples of TPEF and also SHG and THG images. Some other nonlinear optical modalities, as previously mentioned, are SFG, SRS, and CARS.
2.4. Multiphoton Laser Scanning Microscopy
A MPLSM system, as seen in Fig. 3, can be neatly divided into four parts: (1) an ultrafast pulsed-laser source; (2) the excitation optics, which are responsible for beam routing, pulse shaping, and focusing of the pulse train; (3) the detection optics, which are responsible for collecting the emitted contrast signal; and (4) the electronics that quantify the measured signal and store the data for later use.
Figure 3.
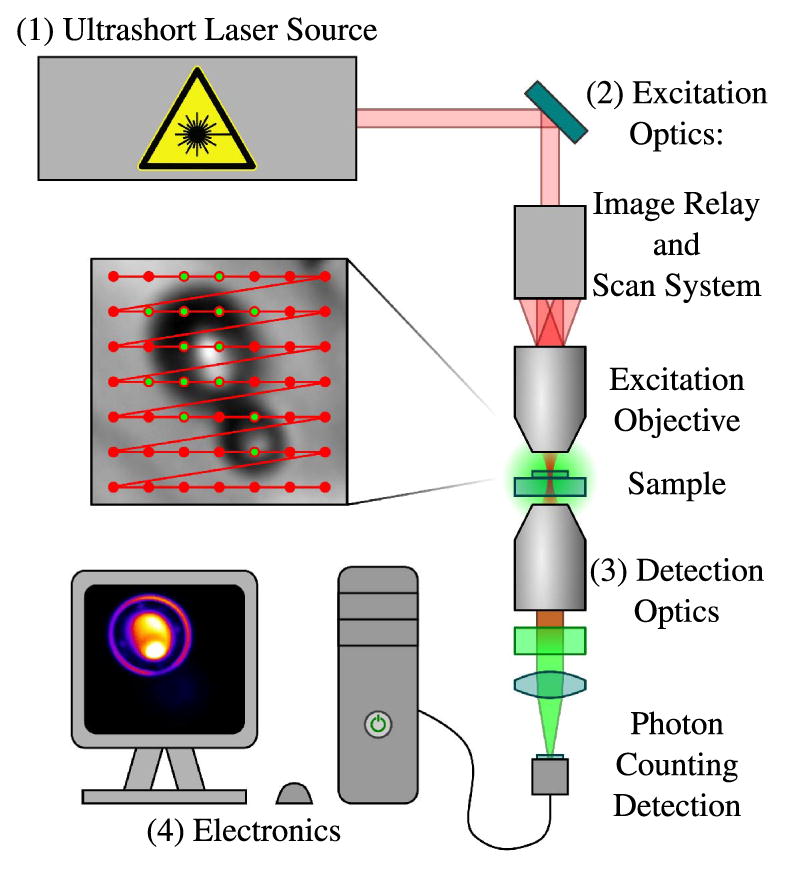
Multiphoton laser scanning microscope: (1) an ultrafast pulsed-laser source, (2) excitation optics, which may include scan optics, (3) detection optics, and (4) electronics for data storage and processing.
3. Sources
Nearly concurrent with the first applications of multiphoton laser scanning fluorescence microscopy [1] was the development of stable intracavity mode locking of femtosecond pulses in titanium sapphire (Ti:Al2O3 or Ti:sapphire) solid-state lasers [86,87,89,152–156]. This ultimately seated Ti:sapphire oscillators as the primary platform for nonlinear microscopy. Often referred to as the “workhorse” of ultrashort pulse lasers in the literature, the Ti:sapphire laser is still the most prolific source for nonlinear microscopy two decades later [11,126,157,158]. Besides the Ti:sapphire laser, there are many other available sources for multiphoton microscopy that have been reviewed in the literature [33,126,149,158–161]. For imaging modalities like CARS and SRS, a multibeam system, usually with adjustable convergence and wavelength, is required. These techniques and associated sources are more complex. However, the source laser can often be built on top of an existing multiphoton microscope (Ti:sapphire is a common example [162,163]) through the use of an optical parametric amplifier [164].
The science of ultrashort pulse laser sources for biological imaging applications has been driven by a number of considerations: to include the desire to target fluorophores outside of the 800–1000-nm center wavelength of a typical Ti:sapphire laser, the need to push to longer wavelengths in order to increase penetration depth in scattering media, and the demand for portable, rugged, and affordable clinical microscopy platforms.
In the past decade, the Yb3+ ion has been shown to be a promising dopant in a variety of crystal hosts used in rare-earth-ion diode-pumped solid-state femto-second lasers operating in the 1-μm wavelength range [159]. A thorough review of the spectroscopic properties of many Yb3+-doped hosts which include aluminates, borates, fluorophosphates, sesquioxides, and tungstates can be found in [165]. Most common of the Yb3+-doped hosts as a gain medium are the three double tungstates: Yb3+:KGd(WO4)2, or KGW; KY(WO4)2, or KYW; and KLu(WO4)2, Yb:KLuW, or KLuW—all of which exhibit similar spectroscopic properties. A significant amount of work has been done in the past decade to fully characterize KGW and KYW crystal properties and growth techniques [166,167]. KLuW, however, was more recently introduced as a promising laser crystal host [168] and is just starting to get a foothold among research groups exploring Yb3+-doped double tungstates.
Owing to its broad gain bandwidth, decades of oscillator development, and, most recently, the demonstration of a cost-effective direct diode-pumped system 169,170]] Ti:sapphire will likely remain the workhorse of ultrashort-pulse science and nonlinear microscopy for years to come. However, as mentioned above, KGW (and its sister crystal hosts) offers an attractive alternative, or better yet, a complement to Ti:sapphire-based nonlinear microscopy systems and opens a door to an extremely inexpensive means to image at a longer excitation wavelength (1020–1040 nm) and at higher average powers directly from the oscillator. In general, the advantage of Yb3+ lasers is that pump light is converted into laser light very efficiently and with relatively little heat production. This efficiency stems from a variety of properties that are typically discussed in terms of comparison relative to those of Nd3+-based lasers, since they also emit at just over 1-μm wavelength. Advantageous properties of Yb3+-doped double tungstates include large absorption and emission cross sections, sufficiently broad emission bandwidth for ultrashort pulse generation, and small laser quantum defect (~6%). The quantum defect, 1 – λp/λe, is defined as the fractional amount of the absorbed photon (pump) energy that is converted to heat due to the difference between the absorbed and emitted photon energies. The heat generated inside of the gain medium can degrade laser output power, beam quality and oscillator stability [171]. Other properties of Yb3+-doped double tungstates are the absence of excited-state absorption, cross relaxation and energy-transfer upconversion [172]. These three mechanisms are well-known challenges with many Nd3+-doped materials and provide alternate pathways for upper-laser-level depopulation and thus reduce efficiency. Additionally, a strong absorption line near 980 nm (Fig. 4) means that Yb3+-based laser materials can be pumped by InGaAs diode lasers, which are commonly used by the telecommunications industry and are commercially available in compact, high output power, relatively inexpensive, turnkey configurations. The development of Yb:KGW-based lasers is an area of active research and development [85,159,165,173–178] and has been demonstrated as a viable source for nonlinear microscopy [179,180]
Figure 4.
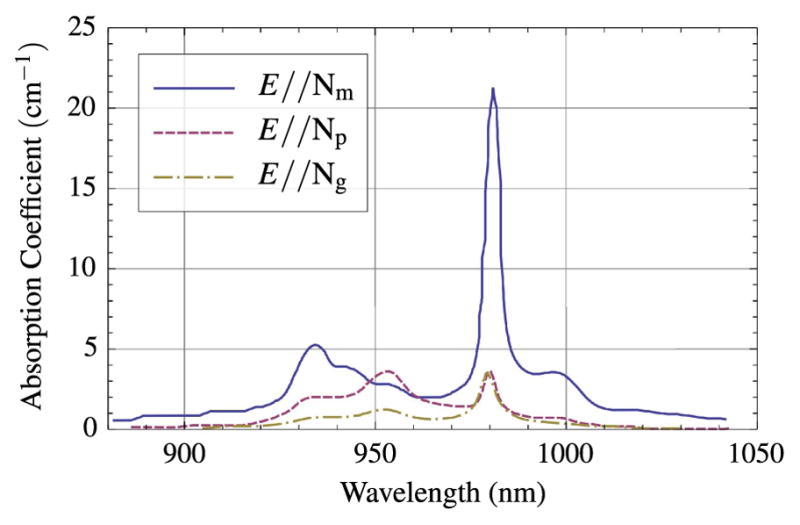
Room-temperature absorption spectra for Yb3+:KGW for polarizations parallel to the principal refractive index axes Nm, Np, and Ng.
In this section, we discuss the general characteristics of some of the common commercial systems that are available for nonlinear microscopy. The years of optical science and engineering behind the commercial systems today make them well-suited “black-box” sources for research laboratories that focus exclusively on the window into the biological sciences enabled by nonlinear microscopy. That said, many laboratories are finding it advantageous to design and build their own ultrashort-pulse laser sources. Though cost, flexibility, and maintenance are a few of the more pragmatic motivating factors for home-built systems, the ability to participate in the collective effort to push the science of short pulse lasers, as imaging tools, is expanding the number of laboratories designing lasers specifically to fit their research, rather than adapting their research, to accommodate the output characteristics of their laser. As such, we also present design and construction considerations for building your own source. Specifically, we discuss in detail a direct diode-pumped Yb:KGW home-built ultrashort-pulse oscillator that is a relatively inexpensive, and a practical first-time build suitable for a variety of nonlinear imaging applications.
3.1. Commercial Sources
3.1a. Ti:sapphire
There are commercial Ti:sapphire systems available to meet just about any biological imaging need. For example, broadly tunable oscillators with outputs ranging from less than 700 nm to well over 1000 nm can produce average power levels up to 2 W and pulse durations between 70 and 100 fs. These are desirable characteristics for a nonlinear microscopy platform given that they can generate output powers necessary to image more deeply in scattering tissue than early-generation Ti:sapphire lasers. They have short pulse widths for high peak power and they are generally operated through user-friendly interfaces. Though commercial platforms generating sub-10-fs pulses are available, these systems have generally been considered to be less than ideal for nonlinear microscopy applications because, at the requisite bandwidth, dispersion management presents a challenge that in most cases outweighs the significant increase in peak power. However, with careful compensation of higher order dispersion, these very short pulses have produced some significant imaging advantages [85,181,182].
3.1b. Yb:KGW
Though Ti:sapphire systems clearly dominate the commercial market for ultra-short pulse sources for nonlinear microscopy, one can purchase a turnkey Yb: KGW oscillator/amplifier system that can generate sub-500-fs pulses with average power of up to 4 W and repetition rates up to 7 kHz [183].
While Yb:KGW lasers are not broadly tunable by themselves (1030–1090 nm [173,184]) the addition of other components can increase the tunability dramatically. Optical parametric amplifiers [80], used in conjunction with Yb:KGW lasers, can be tuned from 620 to 990 nm [185], and from 1380 to 1830 nm [186]. Additionally, the use of nonlinear fibers can create a supercontinuum from 420 to 1750 nm [175]. This can in turn be used to generate a broadly tunable source that can generate sub-65-fs laser pulses from 600 to 1450 nm [187]. While Yb:KGW, by itself, is well suited to exciting fluorescent tags such as YFP, and even DsRed [188], it has been demonstrated that it can also be used to efficiently excite tags such as GFP through the use of a nonlinear fiber [189]. The addition of these tunable capabilities also presents an opportunity to implement more imaging modalities, such as CARS and SRS [190].
Not discussed here, but clearly a valuable laser source in microscopy, are femto-second fiber lasers [156,191–193] and fiber lasers used for SRS [194]. Fiber sources have recently been reviewed by Xu and Wise [161]. We have reproduced the results of Wise [195] with excellent result. Our home-built fiber sources based on this design routinely produce 150-fs pulses with average powers greater than 0.5 W at 50–60 MHz.
3.2. Building Your Own Source: an Example Home-Built KGW Oscillator
There are clear benefits to purchasing the proven commercial systems discussed above. They are reliable, easy to use, and increasingly tunable to a variety of applications. However, for roughly one order of magnitude decrease in the cost, designing, building, and maintaining your own home-built system is an option with tremendous advantages. In an optics laboratory equipped with a breadboard—3′ × 5′ is sufficient—or optics table and a modest suite of general hardware and mounts, one can expect to invest on the order of $30,000 for a complete ultrashort-pulse KGW oscillator. The general design of our example KGW oscillator is based on a laser developed by Major et al. [184]. The layout of the oscillator is shown schematically (top) and in a photograph (bottom) in Fig. 5.
Figure 5.
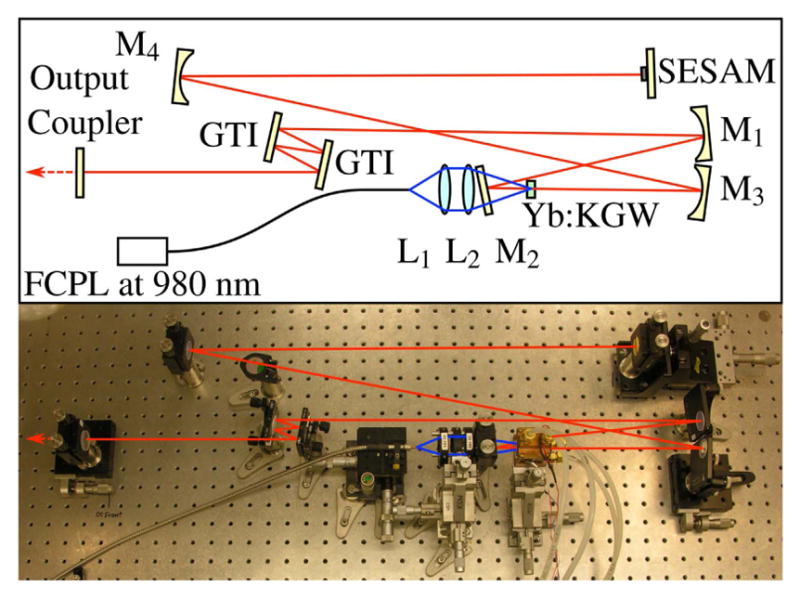
(Top) Schematic representation of Yb:KGW oscillator layout. Mirrors are labeled M1–M4; GTI, Gires-Tournois interferometer; Output Coupler; SESAM, semiconductor saturable absorber mirror; FCPL, fiber coupled pump laser. (Bottom) Photograph of the oscillator in the laboratory. Lines depicting the pump beam (blue, center) and the laser beam (red) are graphically added to the photo.
3.2a. Gain Medium
The gain medium in this example oscillator is 4-mm long, 5-mm wide, and 2-mm high, antireflection (AR)-coated, 5% Yb:KGW crystal (EKSMA OPTICS, Vilnius, Lithuania). 5% doping is fairly standard among the Yb3+-doped double tungstates but KGW crystals, as well as their nearly interchangeable KYW sister crystals, are available in a variety of orientations and dimensions. For end-pumped configurations, 3–5-mm-long crystals are typically used. Many of the efficiency advantages of Yb3+-doped double tungstates discussed above result from the rather simple energy level scheme consisting of only two relevant Stark manifolds: 2F7/2 and 2F5/2. However, there is also a downside to the energy scheme. The system is described as “quasi-three-level” (see Fig. 6) because the closely spaced Stark levels within each manifold are only “quasi separate” and are connected by a Boltzmann distribution. As such, the lower laser level of quasi-three-level systems is so close to the ground state that an appreciable population in that level occurs at thermal equilibrium. Our basic models of quasi-three-level KGW systems (based on [196–198]) show that the ideal length in the trade-off between gain path length and reabsorption effects is between 3 and 4 mm.
Figure 6.
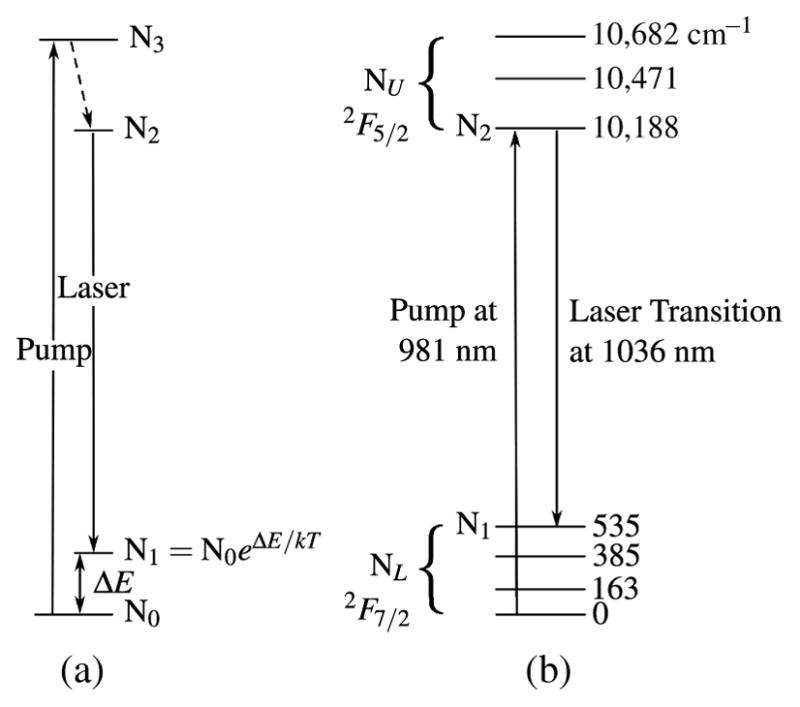
Quasi-three-level energy diagram. (a) General. (b) Yb:KGW with Stark levels shown in cm−1. Arrows indicate pump and laser transitions.
The crystal orientation in the cavity is shown in Fig. 7. The intracavity beam propagates along the Np semi-axis of the refractive-index ellipsoid (indicatrix, which coincides with the b-crystallographic axis [199]) and the generated laser radiation is polarized parallel to the Nm semi-axis of the indicatrix. This orientation is chosen based on the larger relative emission cross section for an electric field polarized parallel to the Nm axis in KGW. It is worth noting an interesting study conducted by Hellström et al. [200], who found that an alternative to the standard b-cut for KGW/KYW crystals has better thermal management properties. Called the ad-cut (athermal direction cut), this configuration required higher doping levels due to smaller absorption cross sections but may be worth consideration for situations where thermal lensing and mode quality become problematic.
Figure 7.
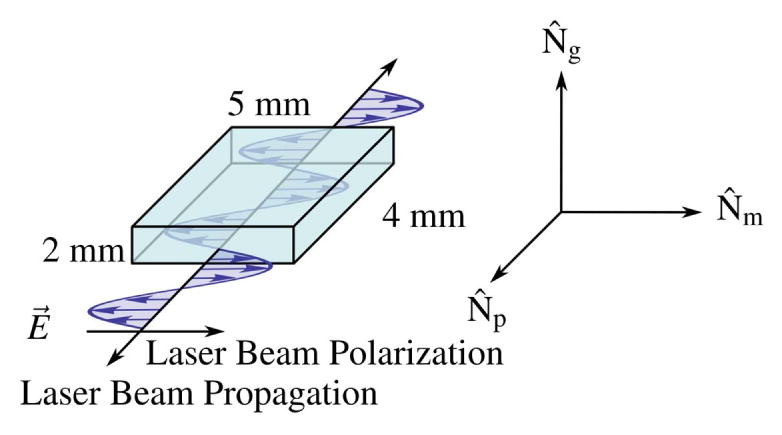
KGW crystal orientation in the oscillator cavity. Gain medium is cut along semi-axes of the refractive index ellipsoid (indicatrix).
Although the small quantum defect of KGW is beneficial for thermal management, the crystal must still be actively cooled due to the high intensity pumping. The crystal in Fig. 5 is cooled to 15°C from both sides by thermoelectric coolers (TECs; TE Technology, Inc., Traverse City, Michigan, USA) housed in a home-built water-cooled copper crystal mount, as shown in Fig. 8(a). However, we have had success with other mount designs, such as that in Fig. 8(b), which shows a design that cools less aggressively but provides better access to the crystal faces for alignment and cleaning.
Figure 8.
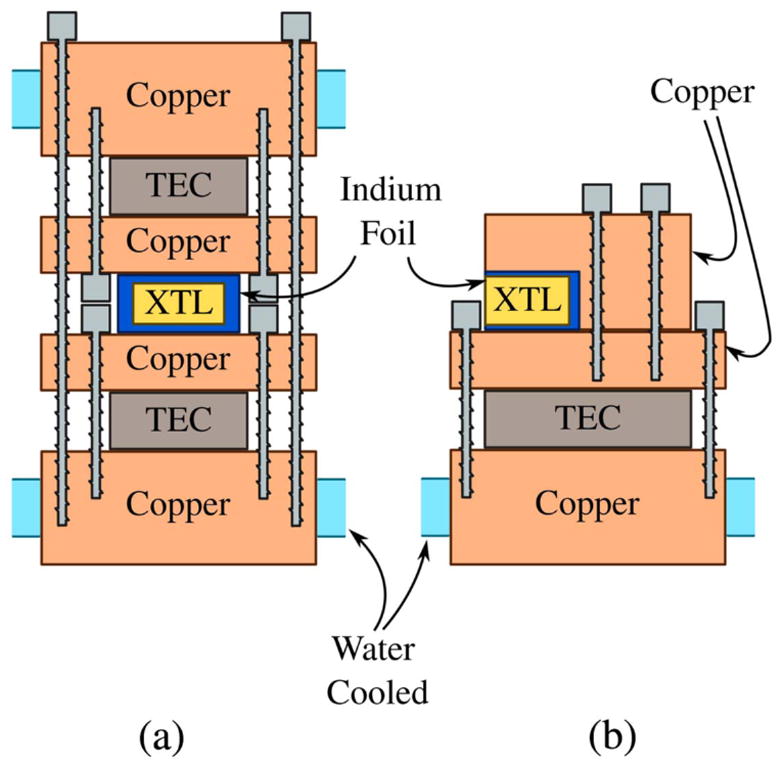
Two crystal-mount designs: (a) mount used in the oscillator shown in Fig. 5 and (b) mount used in another home-built KGW oscillator.
3.2b. Pump Source
There are many commercial vendors producing self-contained turnkey fiber-coupled laser pump modules (e.g., Apollo Instruments, IPG, QPC Lasers, nLight). Generally, the pump laser will constitute between 1/3 and 1/2 the cost of the KGW oscillator. Many of these systems advertise a central wavelength of 976 nm with anywhere from 2 to 5 nm of bandwidth. Because of the rather narrow absorption line around 981 nm in Yb:KGW (see Fig. 4), we have found significant increases in oscillator performance when operating the pump diodes at the high end of the manufacturer’s acceptable temperature range and thus pushing the emission line toward, or up to, 981 nm. The pump source for our example oscillator is a 25-W fiber-coupled diode module with a 200-μm core diameter emitting at 980 nm (F25-980-2, Apollo Instruments, Inc., Irvine, California, USA). The fiber is imaged 1/1 into the crystal and thus defines the pump- and laser-mode volume. In the system shown in Fig. 5 we image the fiber through two 40-mm singlets, L1 and L2. We have also built systems using a commercial lens assembly designed for low aberration multimode fiber applications (LL60, Apollo Instruments). Fiber coupling, alignment, and stabilization all benefit from the commercial lens assembly option, although careful design of a singlet imaging system provides an opportunity for cost savings and can work well.
3.2c. Cavity Elements
The pump light enters the cavity through a short-wave pass flat mirror, M2 (Layertec GmbH, Mellingen, Germany), coated for 98% transmission at the pump wavelength (980 nm) and 99.9% reflection at the laser wavelength (1040 nm). Mirrors M1 and M3 are highly reflective (≥99.98%, Layertec) curved mirrors with radii of curvature r = 500 mm.
A pair of Gires-Tournois interferometer (GTI) mirrors (Layertec), each providing – 1300 fs2 per bounce (four bounces per round trip per mirror) are used for dispersion compensation. In most of the early KGW/KYW laser designs, prism pairs were used for dispersion compensation in the cavity, which allowed oscillator designers to change the prism insertion distance to vary the center wavelength or bandwidth of the output pulses [173]. In the past few years, GTI mirrors have become a more popular means of dispersion compensation due to their compactness and alignment simplicity. There have been numerous theoretical treatments addressing the amount of negative group-delay dispersion needed to offset the self-phase modulation in the gain material and create a dispersion regime that supports a stable mode-locked cavity [173,201,202]. Researchers building oscillators for specific practical application often take a trial-and-error approach, especially with discrete-valued GTI mirrors, and simply increase the negative dispersion until the stable mode-locked output is reached. We have found that two bounces per GTI (eight bounces per cavity round trip) is simple to align and enables a stable mode-lock regime.
Passive mode locking is achieved by focusing the beam with a highly reflective curved mirror, M4 (r = 1000 mm, Layertec), onto a semiconductor saturable absorber mirror (SESAM, SAM-1040-2-25.4g; Batop GmbH, Jena, Germany) with a modulation depth (or maximum change in nonlinear reflectivity) of 1.2%, where the SESAM is used as an end mirror. Passive mode-locking techniques for the generation of ultrashort pulse trains are generally preferred over active techniques due to the ease of incorporating passive devices, such as SESAMs, into laser cavities. A SESAM consists of a Bragg mirror on a semiconductor wafer like GaAs, covered by an absorber layer. Pulses result from the phase locking of the multiple lasing modes supported in continuous-wave laser operation. The absorber becomes saturated at high intensities (i.e., where the multiple lasing modes are in phase at the absorber), thus preferentially allowing the majority of the cavity energy to pass through the absorber to the mirror, where it is reflected back into the laser cavity.
3.2d. Alignment Tools and Considerations
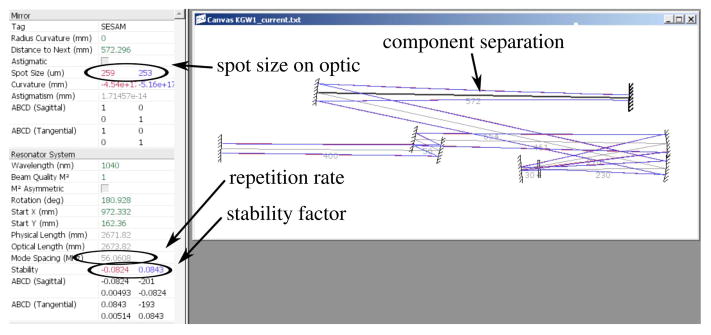
To determine the precise spacing between cavity elements, a laser-cavity modeling program (LaserCanvas5, developed by Philip Schlup; contact corresponding author for availability) was used that employs ABCD matrix formalism to establish cavity stability and resonant mode sizes for oscillators. For our design criteria, we wanted a relatively low-repetition-rate oscillator (roughly 50 MHz) in order to increase the average pulse energy. Figure 9 shows a screen shot of the cavity model as rendered by LaserCanvas5. The cavity design process is one of balancing four key parameters: the desired repetition rate, the laser mode size inside the gain medium, the laser mode size on the SESAM, and the cavity stability factor.
Figure 9.
Screen shot of the KGW oscillator as modeled by laser-cavity program LaserCanvas5. A few of the pertinent design parameters, such as distance between optical components, spot size on a selected component, and stability factor, are circled for emphasis.
We have found that a good initial design is to model a cavity geometry that produces a fluence on the SESAM on the order of five times the manufacturer-provided absorber saturation fluence. As mentioned above, our pump-fiber aperture, which has a diameter of 200 μm, is imaged 1/1 into the crystal, and, thus, we aim for a mode size with a waist very close to 100 μm. Given this constraint, the desired cavity repetition rate can be achieved by selecting the correct radii for the curved mirrors and by proper placement of the flat mirrors in the nearly collimated arms of the cavity. Though the criteria for a stable cavity is a stability factor of less than 1, we imposed a criteria of less than 0.1 to ensure long-term stable laser operation.
The SESAM, which is the optical component selected in the screen shot of Fig. 9, is one of the two components where the mode size is of critical importance. To benefit from the full modulation depth of the saturable absorber in constant-wave mode-locked lasers, the pulse energy must be high enough to bleach the absorber. To meet that condition, the pulse fluence on the SESAM should be approximately five times the manufacturer-provided absorber saturation fluence [203]. Another important parameter on the SESAM is the damage threshold. Listed by the manufacturer as an intensity value rather than a fluence, this provides a minimum bound on the spot size on the SESAM. A recent study by Li et al. [177] looks at spot size ranges that result in stable mode-lock output for a commonly used SESAM (identical to the one used in our oscillator) in a KGW laser. For our KGW laser, typical average output power is 2 W. Given our 10% output coupler and a repetition rate of 56 MHz, we have an intracavity pulse energy of 0.36 μJ. The spot waist on the SESAM is approximately 250 μm, yielding an energy density of 183 μJ/cm2, which is 2.6× the saturation fluence of 70 μJ/cm2. We also tested a mirror with r = 500 cm (M4) and obtained an energy density of 11.4× the saturation fluence and were also able to achieve stable mode lock—albeit at lower output power. In this higher-fluence configuration, the system would begin to multi-pulse when operating above about 1.5 W.
Although the LaserCanvas5 software is a tremendous tool for designing a cavity with the desired characteristics, it can still be quite challenging to align the cavity so that the pump mode and the intracavity laser mode are overlapped in the crystal. There are several techniques for aligning a cavity and many have their own “tricks-of-the-trade” for precise and efficient alignment. We provide one method for ensuring that you have sufficient pump mode overlap for lasing to occur. Once lasing occurs, one can simply “walk” the laser mode onto the pump mode by using the two end mirrors of the cavity: the output coupler and the SESAM. Figure 10 shows a schematic of the cavity during the alignment stage. Note that the output coupler is removed to maximize brightness of the alignment beam. This is especially important for low-power diodes. It is, of course, ideal to have an alignment diode at a wavelength as close to 1030 nm as possible, but 1064 nm works adequately. It is advantageous to align the pump beam first and then align the cavity mode on top of the established pump line. One of the challenges of aligning the pump beam is that many of the high-power (25–40 W) commercial turn-key pump systems have a minimum stable operating current, which normally corresponds to about 7–10 W of output power. Focused to 200 μm, the resulting intensity will burn standard pinholes or other alignment tools. One can purchase high-damage-threshold versions of just about any optical tool, but we provide a very simple and effective technique that requires only standard pinholes.
Figure 10.
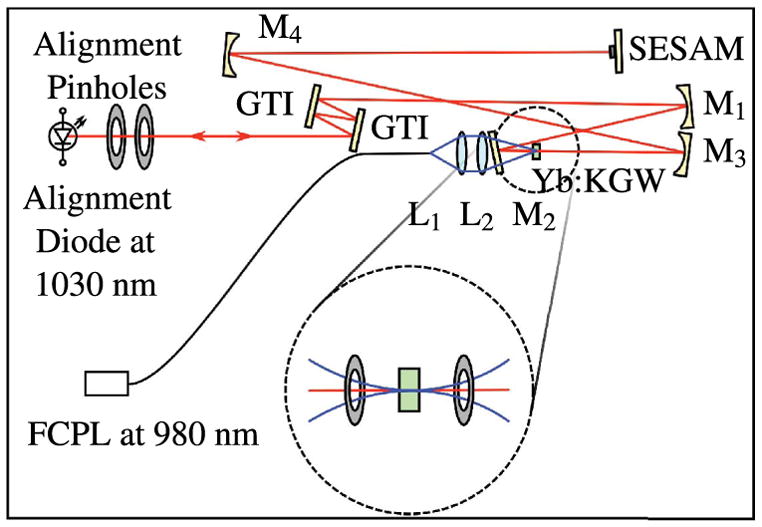
Alignment technique for a KGW oscillator.
The inset of Fig. 10 shows an arrangement of two identical aperture pinholes equidistant from the focus. Capturing the pump beam at these slightly expanded locations enables one to precisely align the pump beam such that the location of the waist is directly in the crystal. Once it is established that the pump beam is straight, level, and focused in the correct location, the pump beam can be turned off and the alignment beam can be brought through the cavity from the output coupler side, aligned to the same pair of pinholes flanking the crystal, then retro-reflected off of the SESAM and back upon itself at the entrance pinholes. Finally, one can replace the output coupler and once again manipulate the mount until the alignment beam reflects off the back of the output coupler onto itself. At this point, the pump can be turned back on at near its maximum power and a sensitive powermeter can be placed directly outside of the output coupler. Lasing will typically “flash” with slight systematic manipulation of the horizontal and vertical positioning of the output coupler mount. Lasing efficiency can be optimized with careful walking of the oscillator mode by iterating between fine adjustments of the output coupler and SESAM mounts.
Table 1 presents the laser component spacings for our home-built KGW laser oscillator.
Table 1.
KGW Laser Component Spacingsa
| Component Pair | Spacing (cm) |
|---|---|
| L1 to L2 | 3.2 |
| L2 to M2 | 2.5 |
| Output coupler to GTI | 40.0 |
| GTI to GTI | 5.0 |
| GTI to M1 | 46.2 |
| M1 to M2 | 27.0 |
| M2 to crystal front face | 3.0 |
| Crystal back face to M3 | 23.0 |
| M3 to M4 | 65.4 |
| M4 to SESAM | 57.5 |
See Fig. 5 for component names.
3.2e. Sample Oscillator Output Characteristics
Figure 11 shows plots of the output power of our example KGW oscillator for two different output couplers: T = 4% and T = 10%. The final configuration of the laser uses the 10% output coupler due to slightly better slope efficiency and mode-lock stability.
Figure 11.
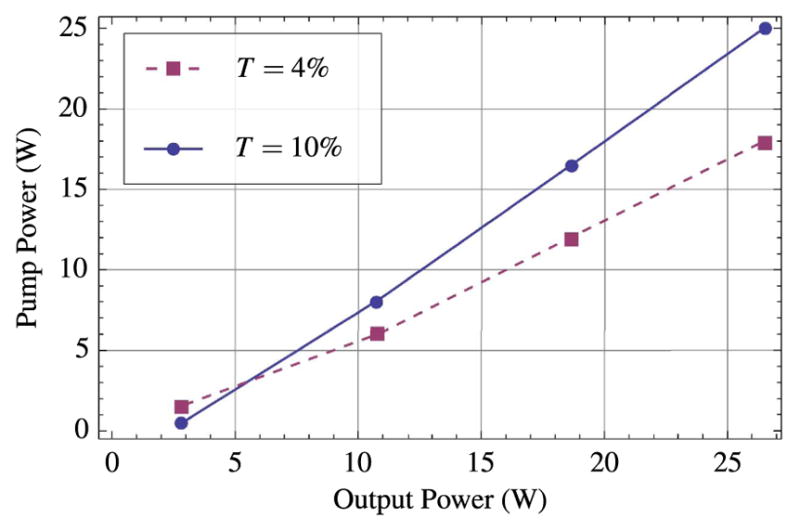
Average output power of mode-locked example KGW laser for output couplers with T = 4% and T = 10%.
The spectrum shown in Fig. 12 shows that the pulses are centered at 1039 nm and have a bandwidth of about 4.9 nm. At this bandwidth, the theoretical transform-limited pulse duration, assuming a sech2 temporal shape, would be 235 fs. The actual pulse duration, as measured by a second-order intensity autocorrelation (see Fig. 13), is 238 fs.
Figure 12.
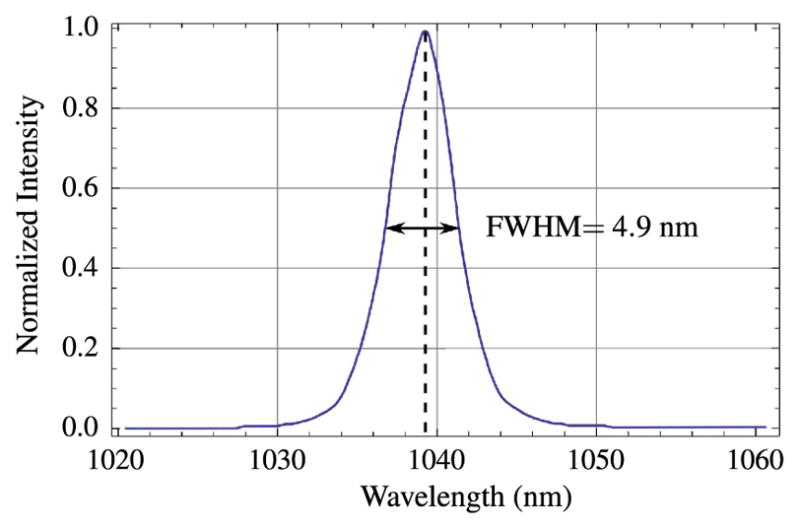
Pulse spectrum for the home-built KGW laser.
Figure 13.
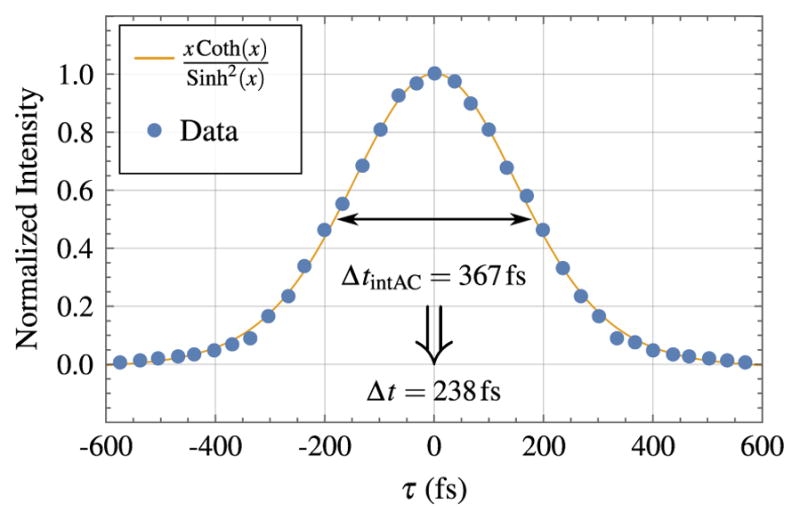
Intensity autocorrelation for the home-built KGW laser. The blue data points are fitted to a x coth(x)/ sinh2(x) function. The full width at half-maximum for the intensity autocorrelation (Delta;tint Ac) is 367 fs. For a sinh2 temporal shape, Delta;t = 238 fs.
In summary, our example KGW oscillator generates a 56-MHz pulse train with a maximum average power of 2.5 W, thus yielding pulse energies as high as 45 nJ. The pulses are centered at 1039 nm and have duration of 247 fs.
4. Dispersion in Optics
In Section 3, a powerful femtosecond laser source was described. The short pulses produced by this source enable multiphoton processes to be driven efficiently at the focus of the microscope objective. Yet, with short pulses come challenges such as dispersion: the frequency-dependent index of refraction for glass in the microscope, which results in chromatic effects that can effect pulse shape and thus reduce the excitation efficiency. Generating shorter and shorter pulses requires progressively larger spectral bandwidths; e.g., the spectrum of a 10-fs Gaussian pulse will require most of the visible spectrum [204].
For normal dispersion, as the femtosecond laser pulse passes through the glass of the microscope, the longer frequency components will arrive ahead of the shorter frequencies. This positive dispersion of the laser pulse results in a decrease in the amplitude and broadening of the pulse shape. Dispersion reduces the excitation efficiency and results in a decreased signal intensity. Characterizing and compensating for dispersion can be an important part of an MPLSM [78,87,89,205–209].
To demonstrate the effects of dispersion, we consider a “forward-moving” ultra-short pulse with a Gaussian temporal profile with a time duration of τ measured as the full width at half-maximum of the temporal intensity profile. The temporal profile is written as
| (3) |
where the shape factor, Γ, is given as
| (4) |
The Fourier transform of Eq. (3) provides the positive spectrum:
| (5) |
Equation (5) may be propagated through the system by multiplying it by the exponential of the spectral phase (the phase of the electric field in the frequency domain), which gives us
| (6) |
The phase (i.e., argument) of the exponential in Eq. (6) may be expanded in a Taylor series, which allows the contribution of each term to be addressed:
| (7) |
| (8) |
The first-order term in Eq. (8), ϕ0, is constant, does not affect the pulse shape, and only introduces a time delay. All of the higher order terms, ϕ1, ϕ2, …, are dependent on ω and do affect the pulse propagation and shape. ϕ1 is called group delay (GD). ϕ2 is called group delay dispersion (GDD). The higher order dispersive terms, ϕ3, ϕ4 are referred to as third-order dispersion (TOD) and fourth-order dispersion (FOD), respectively.
The spectral phase as a function of optical path length (P) for a pulse propagating through a dispersive medium is
| (9) |
The dispersive terms from Eq. (8) then may be expressed in terms of P:
| (10) |
| (11) |
| (12) |
| (13) |
An important supplemental expression relates GDD to the pulse duration:
| (14) |
The effects of dispersion from each separate ordered term are shown in Fig. 14. Even-ordered dispersive terms cause symmetric broadening of the pulse. Odd-ordered dispersive terms higher than ϕ2 give the pulse a skewed appearance and add a ringing-like feature that can appear on the leading or trailing edge of the pulse depending on the sign.
Figure 14.
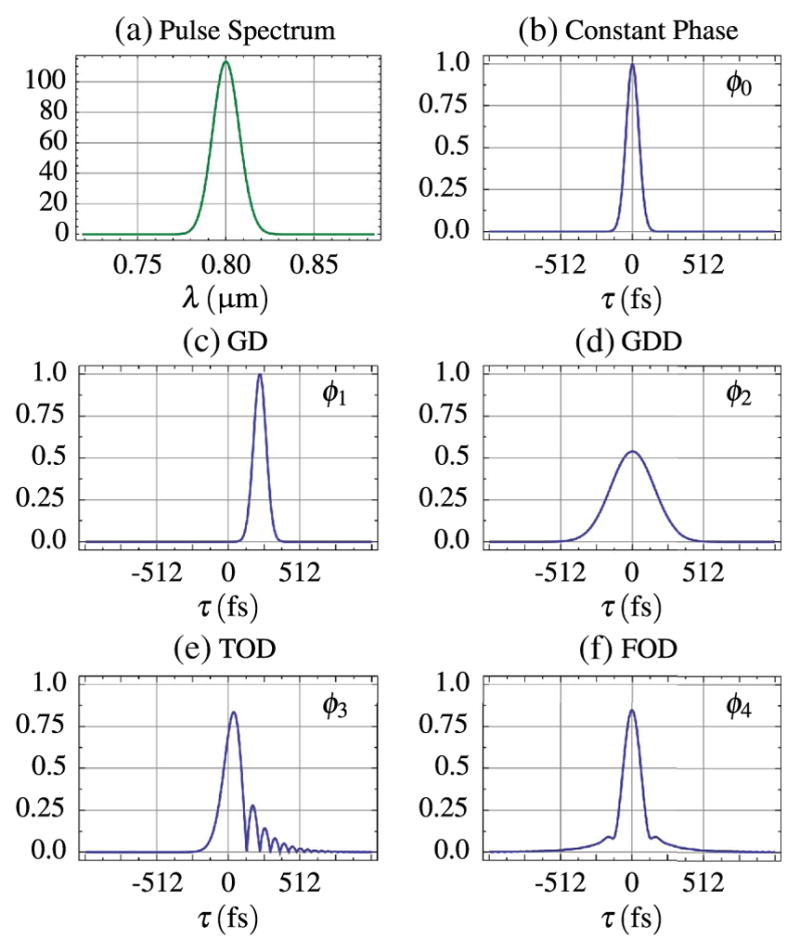
Pulse width bandwidth as seen in (a), in the temporal domain (pulse width, τin, is 64 fs) (b) and temporal envelopes as affected by each order of dispersion: (c) 225 fs of ϕ1, (d) 3375 fs2 of ϕ2, (e) 50, 625 fs3 of ϕ3, and (f) 759, 375 fs4 of ϕ4.
Wollenhaupt et al. present an elucidating example (Table 12.2 in [210]) in which the effect of increasing amounts of GDD on pulses of different temporal lengths is tabulated. A typical multiphoton microscope with an 800-nm source may have as much as 4000 fs2 of GDD [211]. This amount of GDD would result in a 160-fs pulse broadening to 174.4 fs. However, a 10-fs pulse would broaden to 1109.1 fs. This demonstrates that the use of shorter pulses does not always guarantee an improved multiphoton signal and also of the importance of dispersion compensation.
For more discussion of pulse propagation, we recommend [160,204,210].
4.1. Dispersion Compensation
Is dispersion compensation necessary in a microscope? For imaging processes that scale nonlinearly with excitation intensity, dispersion compensation would seem to provide an unambiguous improvement in excitation efficiency (i.e., the ability to generate nonlinear signal photons). However, it is important to calculate the “photon economics” in order to evaluate the net impact of a dispersion-compensation system on signal photon generation. To optimize the excitation efficiency within the microscope it is desirable to maintain a diffraction-limited focal spot that is transform-limited in time. Just as spherical aberration can extend the focal volume spatially and reduce the excitation efficiency, dispersion in beam expanders, scan optics, and microscope objectives can extend the pulse duration and also degrade the pulse quality. There are multiple strategies that can be employed to precompensate for the dispersion of these optics, to ensure a transform-limited, or near-transform-limited, pulse at focus. Notably, the efficiency of the compensation scheme itself should be considered to ensure that there is a realizable gain in the final image. For example, if we assume a simple square pulse shape, the average detected second-order signal can be estimated to scale as
| (15) |
where N is the pulse repetition rate, E is the pulse energy, τ is the pulse duration, and A is the area. In this instance, we are looking at a second-order nonlinearity such as TPEF or SHG. Notably, we see that the detected signal scales inversely with pulse duration. If our compensation scheme reduces the pulse duration by a factor of 2, the detected signal will increase by a factor of 2. However, if the transmission of our compensation scheme is 50% (Etransmitted = 0.5 × Eincident), even with the reduction in pulse duration, our net detected signal is actually down by a factor of 2. Thus, any consideration of a dispersion compensation scheme, as outlined in this simplistic analysis, needs to include the transmission efficiency. A useful rule of thumb is that, for imaging with a second-order nonlinearity, if the transmission efficiency of the compensation system is α and the reduction in pulse width is β, then α2β must be greater than 1 to realize a measurable signal gain:
| (16) |
For example, if we are able to reduce the pulse duration by a factor of 2, β = 2, then the above rule of thumb suggests we need our transmission of the compensator, α, to be greater than 71%.
In a microscope, the combination of scan optics, tube lenses, dichroics, and objectives can result in GDD of the order of 5000 fs2. For many users, with a pulse duration of ~100 fs and modest dispersion from the microscope of ~3300 fs2, the pulse stretches to ~130 fs. This 30% increase constrains the compensation arm efficiency to be >88%.
Keeping transmission efficiency in mind, a second decision affecting the choice of compensator is the ability to compensate for higher order dispersion, which can also limit the pulse duration [212]. Table 2 lists the sign of the GDD and TOD for glass, prisms, gratings, and grisms.
Table 2.
Sign Value of Second- and Third-Order Dispersion for Glass, Prisms, Gratings, and Grisms
| GDD | TOD | |
|---|---|---|
| Glass | + | + |
| Grating | − | + |
| Prisms | − | − |
| Grisms | − | − |
Table 2 shows that glass in general exhibits positive GDD and TOD, and, as such, it is desirable that the compensator match the magnitude of the dispersion but be opposite in sign. It is evident that gratings, with the resultant mismatch in the sign of the TOD, can quickly become limiting: the grating’s TOD dispersion adds to that of the glass and, thus, most compensators used for multiphoton microscopy employ prisms. Prisms can be cut at Brewster’s angle, and, consequently, prism compensators have excellent transmission efficiency [213,214]. Choice of the prism glass is critical. Glasses like SF10 seem desirable because prisms made from these materials are highly dispersive, and a compact prism geometry results. However, while the TOD from the prism has the correct sign, it is incorrect in magnitude. Consequently, the pulse duration at focus quickly becomes TOD limited as a result of the prism compensator [215]. This has driven the glass choice to materials such as fused silica. Fused-silica prisms still ultimately limit the TOD compensation, but pulse durations of less than 20 fs can be compensated in microscopes, which is adequate for most systems.
The less dispersive glass choice requires a greater prism separation. However, compact geometries can still result by a careful choice of geometry, such as demonstrated by Akturk et al. [216]. Using a single prism in conjunction with a corner cube and roof mirror, they created a compact dispersion-compensation system with good throughput. Using PBH71 glass, they achieved 15, 000 fs2 of dispersion at 800 nm with a transmission efficiency of 75%. The displacement between the corner cube and the prism in this instance was just 30 cm. One of the nice advantages of the system is that a single prism design is much more amenable for use with systems in which the wavelength is tuned over a broad range. Akturk et al. show that only a 10° rotation of the prism is required to accommodate the wavelength range of 700–1100 nm.
A notable change in dispersion-compensation methods has been the availability of mirror coatings that have substantial GDD suitable for pulse-width correction while maintaining high reflectivity (>99%) over a broad wavelength range (0.7–1.0 μm). For example, a coating may have −200 fs2 of GDD at 800 nm. For a microscope that has dispersion on the order of 3000–5000 fs2, 15–25 reflections off the coating are required for complete GDD compensation. The net transmission is then 78%–86%. For a 100-fs pulse at 800 nm this range of dispersion equates to pulses stretched from 130 to 150 fs, meaning that the signal gain as a result of pulse width reduction will be almost exactly offset by the transmission losses.
It is interesting to note that the ratio of TOD to GDD is relatively constant for most materials. At 800 nm, this ratio is approximately +0.247 fs. The ratio of TOD to GDD for a prism compensator does not match that of materials and, as such, is why the prism compensator itself ultimately becomes the limiting element in terms of achieving transform-limited pulses at focus. The combination of a grating written onto a prism (or grating and prism separated only by a small air gap) is known as a grism [217]. Grisms not only have the correct sign of GDD and TOD correction, but they can be engineered to have the correct ratio of 0.247 fs. Thus, grisms enable quartic-phase-limited dispersion compensation, for large material path lengths. They can be configured such that throughput of >70% is achievable [218]. Grisms are the best choice when the glass path length in the microscope becomes significant: of the order of 10, 000 fs2.
4.1a. Dispersion Compensation and Pulse Compressors
There are many examples of dispersion compensation or pulse compression systems. These include the use of diffraction grating pairs [219–221], prism pairs [214,215,222–224], chirped mirrors [225–227], and the use of spatial light modulators (SLMs) or acousto-optic modulators (AOMs) for pulse shaping [89,160,207,228–234].
4.2. Pulse Measurements
It is important to have detailed knowledge of the spatial and temporal characteristics of an ultrashort pulse—especially for pulses below ~200 fs—at the focus of an objective so as to ensure optimum resolution and the highest efficiency for nonlinear photon production [230]. Quantitative metrics of the pulse intensity are also necessary in the case of in vivo samples so as to maintain sample viability. Inefficient pulse shapes can lead to undesirable bleaching. In this section we present the method of an interferometric two-photon absorption autocorrelation (TPAA) in a photodiode along with examples of dispersion for first-, second-, and third-order autocorrelation measurements. The strength of interferometric autocorrelation methods is that they are straightforward to implement and are suitable for optimizing the excitation efficiency for most multiphoton imaging applications. They are, however, fundamentally limited in terms of their inability to extract the actual pulse shape and phase of the pulse. [210]. As such, a Gaussian or hyperbolic secant (sech) shaping function is usually assumed. Thus, a suite of much more sophisticated pulse measurement techniques has been developed that are well matched to a microscope; namely, frequency-resolved optical gating (FROG [235–241]) and spectral phase interferometry for direct electric field reconstruction (SPIDER [208,240–244]) are able to provide additional information. Furthermore, multiphoton intrapulse interference phase scan (MIIPS [209,239,240,245–250]) not only measures the pulse but can shape it, as well. There are many papers that detail the utility of performing autocorrelations as a measure of a microscope system’s two-photon imaging performance [149,215,236,251,252].
4.2a. Interferometric Autocorrelations
Autocorrelation measurements are taken by sweeping an identical copy of the pulse across itself. This is accomplished by propagating the pulse through an interferometer where one of the arms has a variable length and is thus capable of providing an adjustable time delay (τ). A balanced autocorrelator provides equal amounts of material and coatings such that each pulse experiences an identical amount of dispersion. Additionally, interferometric autocorrelations can be performed such that the full back aperture of the objective is used—the measurement is taken at the full NA of the objective—and thus gives an accurate representation of performance under imaging conditions [47,253].
To take an autocorrelation of the beam with meaningful pulse-width information, you must have a material at the focus of your objective capable of producing a nonlinear, intensity-dependent signal. This intensity-dependent interaction acts as the ultrafast gating function, which allows a time-dependent measurement of the pulse with a detector that has a bandwidth or frequency response substantially below that of the optical pulse.
A typical and easy method of obtaining the autocorrelation is to measure the TPEF of a sample containing a fluorescent dye. Easier still is to employ the use of a GaAsP photodiode that has a two-photon spectral response from 600 to 1360 nm [252]. This bandwidth adequately covers the tunable range of a Ti:sapphire laser and the typical central frequencies of many other lasers used for multiphoton microscopy. Additionally, GaAsP photodiodes are inexpensive and are not susceptible to the problems of photobleaching or photodamage typical of fluorescent dyes.
Figure 15 is an example of three different autocorrelations. The first-order correlation does not reveal anything about the pulse width except for the coherence length of the laser. The higher order autocorrelations, which make use of a nonlinear, intensity-dependent signal, can provide information about the amount and types of dispersion in the pulse. For interferometric autocorrelations of the second order, the ratio of the peak of the enveloping function to the nonzero baseline is 8/1, whereas for a third-order autocorrelation the ratio is 32/1 [149]. Figure 16 presents an example of the effect of GDD on an ultrashort pulse as measured by a second-order autocorrelation.
Figure 15.
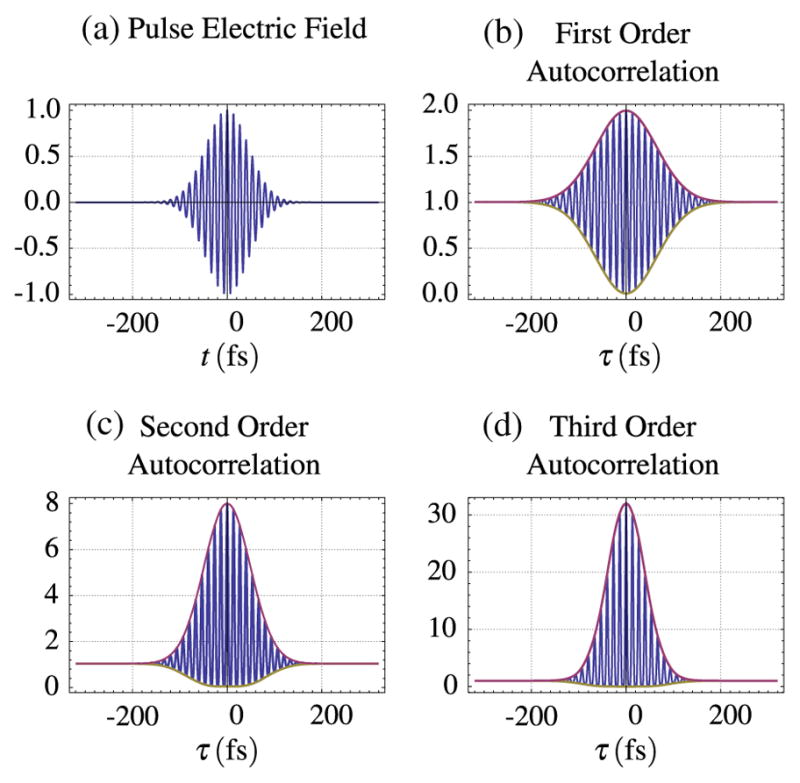
Autocorrelation orders
Figure 16.
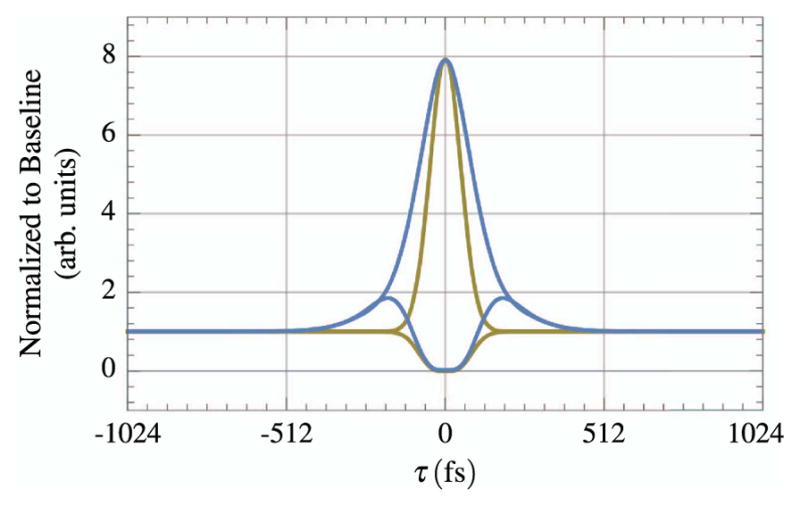
Example of the effect of 3375 fs2 of GDD on a second-order autocorrelation of an ultrashort pulse (τin = 64 fs). The initial pulse is in yellow and the disperse pulse is in blue. The envelopes are normalized to the baseline value.
5. The Image Relay System
Up through Section 4 we have focused on how to produce and maintain short, high-energy laser pulses in a microscope system. While these are essential aspects of a MPLSM system, we have yet to discuss the process of constructing an image by using a raster-scanned focal spot of the laser. In this section, we give a brief description of the image-construction process (Section 5.1) and outline the fundamentals of laser scanning (Section 5.2). We then briefly discuss the limitations of paraxial system design (Section 5.3). We will also discuss the use of computer-aided optical design for optimizing the spatial properties of the focused pulse while scanning (Sections 5.4 and 5.5), as well as improving FOV and field curvature (Sections 5.3a and 5.5). Finally, we expand our discussion to cover multifocal approaches to increase data acquisition rates (Section 5.4). Alignment techniques are not discussed in this section, but Heintzmann [254] presents a basic and accessible introduction to laser-beam alignment from beam collimation to mirror and lens alignment.
5.1. Image Construction in MPLSM
As outlined in the Section 2, a significant advantage of MPLSM over other imaging modalities is its relative insensitivity to scattering by turbid (e.g., biological) media. Nonlinear contrast mechanisms limit the excitation to within the laser focal volume, as mentioned in Section 2.3. This enables whole-field detection—elimination of the confocal pinhole—where the nonlinear signal is collected and quantified by a nonimaging detector, such as a photomultiplier tube. Since the signal is known to have originated from the focal point, all the collected nonlinear light can be attributed to that location in the specimen.
To form an image, the intensity of the nonlinear signal is quantified for each voxel by scanning the focal point relative to the specimen. While images can be formed by scanning the specimen while the laser focus remains stationary—a relatively simple and straightforward solution—scanning the laser focus across a static sample is often more desirable because of superior image acquisition speed and specimen stability, although it is more difficult to implement. Laser scanning requires that the beam’s incident angle vary while remaining centered on the objective’s back aperture; this prevents vignetting. Thus, the process of scanning not only determines the FOV but also can have a dramatic effect on the efficiency of excitation across the region of the scan.
The simplest version of a multiphoton microscope has a single focal point that is scanned through the region of interest. While numerous multifocal MPLSM systems have been reported [31,139–141,144,255–263], we treat the single-focus system first to illustrate the problem of beam delivery to the specimen. We then broaden the discussion to include multifocal imaging techniques and discuss some of the unique issues that arise from such systems.
5.2. Single Focus System
While systems for scanning 2D planes in the object region with arbitrary orientation have been reported [42,45,82,264–273], we will concentrate on systems that decouple the axial scanning from the lateral scanning. In such a system, volumetric images are collected by the sequential scanning of a lateral plane, oriented perpendicular to the optical axis, as the axial position of the specimen is varied. Lateral scanning of the focal volume is the key to image formation in this configuration.
To laterally deflect the focal spot in the object plane, a controlled incident angle is applied to the collimated excitation beam at the back aperture of the objective lens. This is shown schematically in Fig. 17. In the paraxial approximation, the magnitude of the deflection in the object plane (Δ) is proportional to the focal length of the objective lens (f ) and the angle of incidence with respect to the optic axis (θ) at the optic’s back aperture. The crux of laser scanning is to design a system to change the angle of incidence of the spatially collimated illumination at the back aperture of the objective lens without vignetting.
Figure 17.
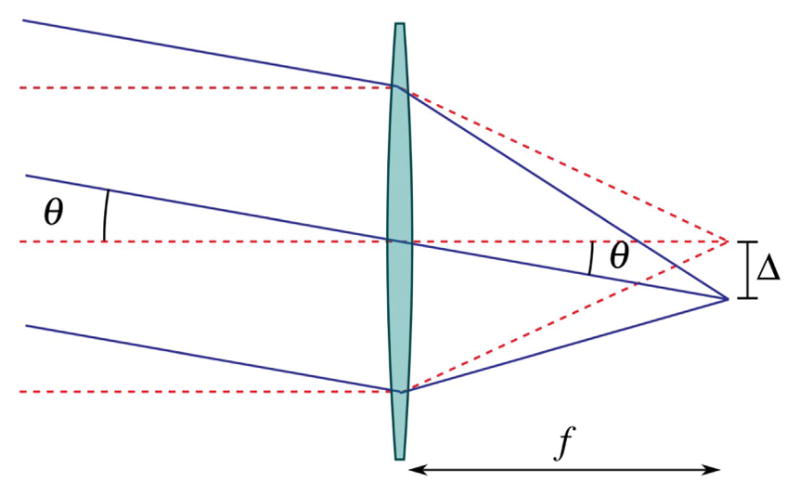
Lateral scanning with an infinity-corrected optic. To deflect the focal point in the object region, the angle of the collimated input beam must be varied with respect to the optic axis without translating the beam position at the input of the lens. The focal point of the illumination is deflected in the object region by Δ = f tan θ ≈ f θ in the small angle approximation.
Scanning the angle of a laser beam can be accomplished in a variety of ways, including acousto-optic deflectors (AODs [274–276]), resonant [54,277] and nonresonant [30,33] galvanometric scan mirrors, polygonal scan mirrors [12,278], and microelectronic mirror (MEMS [279–281]) devices. The predominant method is to use a pair of galvanometric scan mirrors, one for each lateral dimension, to deflect an incoming beam in the lateral plane, and examples of this design are presented in related texts [90,135,282–284]. This is shown for one lateral dimension in Fig. 18, where the optical axis is indicated with a dashed line. At the back aperture of the objective, we require that the beam be collimated and incident, such that it does not walk off the aperture (vignetting), with an angle that varies as the scanners are rotated. The scan optics provides a system for mapping the angle of beam deflection by the scan mirrors to the angle of beam incidence on the objective. A straightforward solution is to image relay the scan mirrors to the back aperture of the objective lens using a double-sided telecentric system.
Figure 18.
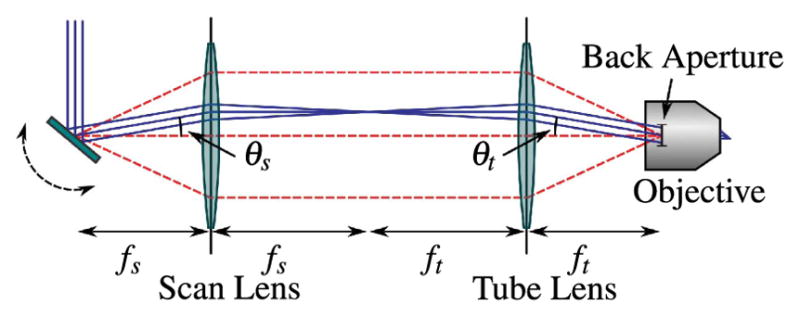
Simple laser scanning system in the paraxial approximation. A collimated input beam is deflected by a scanning mechanism, such as a galvonometric mirror. Two lenses are used in a 4f configuration to image the scanning device to the back aperture of the illumination objective, as indicated by the red dashed lines. The lens closest to the scanner is referred to the scan lens, and has focal length f s, while the other lens is referred to as the tube lens and has focal length f t.
Image telecentricity is where the stop is placed before the optics such that the chief rays for different field angles are parallel at the focal plane. The reverse of image telecentricity is object telecentricity, and a combination of the two systems in series is double-sided telecentricity [285]. A lens is not inherently telecentric, as this is a function of stop placement. However, when a scan lens is referred to as telecentric, it usually means that the lens not only satisfies the F-theta condition—that the image height scales linearly with scan angle—but that the stop is placed at the scanning device so as to ensure telecentricity.
To build a relay system with double-sided telecentricity, the first relay lens is placed one focal length after the scan mirrors, the second relay lens is placed one focal length before the objective back aperture, and the relay lenses are separated by the sum of their focal lengths. Notice that the telecentric region is between the lenses as opposed to other double-sided telecentric systems in which there is telecentricity on either side of the relay system. This configuration is referred to as a 4f relay system due to the position of the relay lenses. Any difference between their focal lengths results in some magnification, which can be useful as outlined in Sections 5.3 and 5.4. This system ensures that the chief rays for different field, and in our case, scan, angles are parallel between the relay lenses and the beam does not walk off the objective back aperture as it is scanned.
5.3. Paraxial Scan System Design
Designing a laser-scanning microscope with an imaging system for the scanners is straightforward in the paraxial approximation. As an example, suppose that we have the following constraints for designing a MPLSM system for which a 500-μm FOV is required, with a lateral spatial resolution (d) of ~1 μm. Given a source wavelength of 1040 nm (corresponding to our Yb:KGW laser oscillator), we want to select an objective lens that will provide the required spatial resolution, and a pair of image relay lenses that will allow image formation over the desired FOV.
First, let us select an objective lens based on the spatial-resolution requirement. While the characteristics of the objective lens will be discussed in detail later in Section 6, we briefly note that the lateral spatial resolution under two-photon excitation with tightly focused excitation light is well described by a Gaussian fit to the intensity distribution in the object region. The spatial resolution as the 1/e radius of the maximal intensity for the square of the illumination point spread function (IPSF2), which is defined in [99] (cited by [37,73,286]) as
| (17) |
where λ is the wavelength of the illumination light and NA is the numerical aperture of the objective lens. We define the lateral spatial resolution of the imaging system as the full width at the 1/e2-point of the IPSF2: . Solving for NA, under the assumption that it is less than 0.7, we find that an objective lens with 0.65 NA is sufficient to provide approximately 1 μm spatial resolution with 1040 nm illumination light. Thus we select a 40 × /0.65 NA objective lens. Given this objective, we now select a scan lens and tube lens that will provide the desired FOV. Practically, this amounts to selecting a tube lens with an appropriate f -number (f /#): the ratio of the focal length to the aperture of the lens.
The aperture of the tube lens (At) must be large enough to support the full diameter of the illumination beam at the maximum scan angle (θmax). Thus the aperture of the tube lens must be greater than or equal to the sum of the beam diameter (Db) and the maximum displacement of the chief ray from the optic axis:
| (18) |
Since the spatial resolution we computed above is achieved only when the back aperture of the objective is filled, we will assume that Db is equivalent to the diameter of the back aperture. Under the paraxial approximation, the diameter of the objective back aperture (Ao) is
| (19) |
θmax is related to the focal length of the objective lens and the desired FOV. Once again, exploiting the paraxial approximation, this angle is
| (20) |
As expected, the aperture of the tube lens is set by the desired FOV, focal length, and NA of the objective lens:
| (21) |
The focal length of an infinity-corrected objective lens can be determined by the magnification of the lens and the focal length of the manufacturer-prescribed tube lens (see Section 6). For the UIS-series Zeiss lens (Zeiss, Thornwood, New York, USA) we have selected, the focal length of the tube lens is , so the focal length of the objective lens is
| (22) |
Equations (21) and (22) can be used to determine the required aperture of the tube lens in terms of the desired FOV and the parameters obtainable from the objective lens (i.e., the magnification and the NA):
| (23) |
provided that the manufacturer-prescribed focal length of the tube lens is known.
While Eq. (23) serves as a quick rule of thumb for selecting the aperture of the tube lens, it is more often the case that the aperture is fixed and the focal length of the tube lens is a free parameter. Therefore, it is more useful to rearrange this expression to
| (24) |
For a given aperture, Eq. (24) provides a good rule of thumb for selecting the focal length of the tube lens. In the present example, we will assume that the aperture of the tube lens is 30 mm, requiring that the focal length of the lens be less than or equal to 200 mm.
In the simplest case, the focal lengths of the scan and tube lenses are equivalent. However, in some cases magnification is required to fill the aperture of the tube lens. Appropriate magnification of the beam is achieved by adjusting the ratio of focal lengths between the tube and scan lenses. With the scan-lens focal length determined, the aperture of the scan lens can be computed to ensure selection of a lens with the proper f /#.
In the present example, a beam diameter of ~5.34 mm is not so large as to warrant beam expansion within the scan system, and it is practical to select a set of identical scan and tube lenses.
Additionally, these equations may be used to determine θs; this ensures that the scanning mechanism can provide the required deflection to achieve the prescribed FOV.
5.3a. Large Aperture Telecentric Lens for Nonparaxial Approximation
In Section 5.3 we made an initial design of the scan system with the paraxial approximation, meaning that the angle of deflection from the optical axis is small. While this is a good first-order approximation for suitable commercially available scan lenses, for realistic scan systems the effect of field curvature is also important to consider, as it can distort the spot size over the image plane. Additionally, since a large FOV is desirable for faster mosaic imaging, the problem is only compounded the farther off-axis we scan.
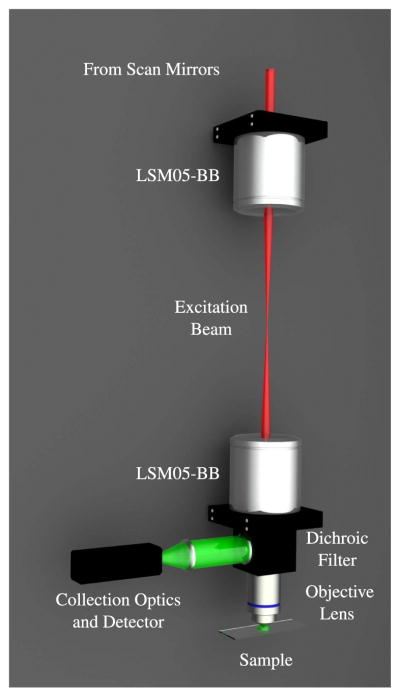
Without the paraxial approximation, even slight deflections can cause the focal spot to experience deviations from optimal focusing–which is achieved for on-axis light propagation. Standard achromatic lenses are designed to not only minimize chromatic aberrations, but typically to minimize spherical aberration, as well. Unfortunately, this optimization is for on-axis light. Consequently, when a collimated laser beam is scanned off-axis through a standard achromatic lens, the beam becomes significantly aberrated. This includes spherical aberration, coma, astigmatism, and field curvature. However, as previously discussed in Section 5.2, certain lenses are designed and optimized for scanning applications. Figure 19 shows a comparison between an achromatic lens and a scan lens designed for telecentric scanning (both commercially available); the figure demonstrates the quality of focus for both lenses over a scan range and the curvature of the focal plane. Because of the scan lens’ superior performance, two of them will be used for the relay system between the scan mirrors and objective back aperture (rendered in Fig. 20). Figure 21 demonstrates the ability of the commercial scan lenses for acquiring large FOV images.
Figure 19.
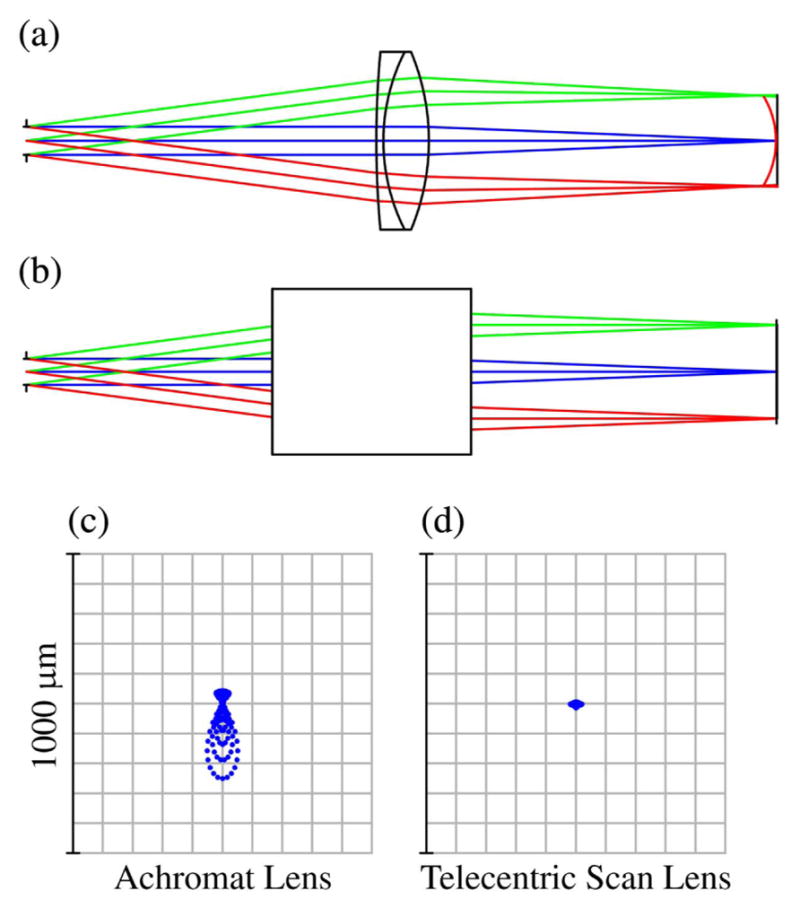
ZEMAX comparisons of off-axis focusing performance between a commercial achromatic lens and a commercial telecentric scan lens. Lens diagrams (a) and (b) are the achromatic and LSM05-BB lenses, respectively. (a) also shows the field curvature of the focal plane in red. Spot diagrams (c) and (d) compare the focal spots of the lenses for 7.5° of deflection from the optical axis.
Figure 20.
Computer rendering of the basic microscope system. The two large optics in the relay system are broadband-coated (850–1050 nm) 1.6× OCT Scan Lenses (LSM05-BB, ThorLabs), which allow for a large FOV and, because they are designed for optical coherence tomography (OCT), the scan lenses satisfy the telecentric condition.
Figure 21.
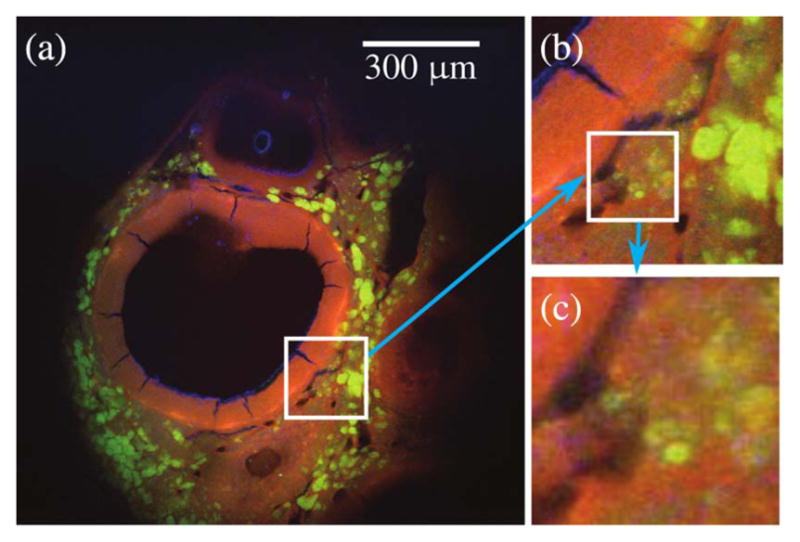
Large FOV images of fixed murine ovarian tissue obtained with MPLSM using commercial scan lenses. 300 μm scale bar. The objective lens used was a 40 × /0.65 NA Zeiss A-Plan.
5.4. Multiple-Focus Systems
In the past decade, there has been significant effort to develop multifocal multiphoton laser scanning microscopes that parallelize the image acquisition process, enabling a high-speed capability to capture processes in real time, and open a window into dynamic systems [31,139–141,255–259,261–263,287]. The idea of capitalizing on the abundance of power available in the latest ultrashort pulse laser designs to generate an array of focal points was first introduced in 1998 [31,138]. Sheetz et al. [179] have demonstrated a Yb:KGW oscillator that produces six temporally and spatially separate beams directly from the cavity. For this lateral array of multiple foci, the requirement to translate an angular deflection into a lateral shift in the foci remains. However, the optical configuration needed to transform an array of beamlets into separate foci at the sample plane, and to do so in such a way that the foci can be scanned without vignetting, becomes more complex.
Figure 22 demonstrates what the multifocal scan optics must accomplish. The beamlets must be overlapping and collimated at the back aperture of the objective; the spot formed by the overlapping beamlets must remain fixed on the objective back aperture as they are scanned in two lateral dimensions. In Fig. 22, the angular scan range is indicated by the dashed lines representing the outer marginal rays of the outer beamlets.
Figure 22.
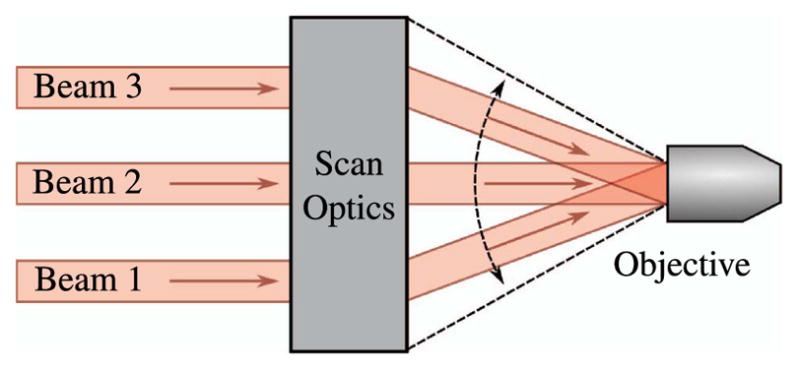
Telecentric scanning of multiple foci.
To achieve overlapping collimated beamlets that are properly sized to slightly overfill the back aperture of the objective lens, the scan optics must be designed with three primary considerations:
The lens system must focus the beamlet array to telecentric stops at the scan mirrors and at the back of the objective lens.
The lens system must offset the position of the beamlet waists from the focus of the lateral beamlet array; in other words, the necessity of overlapping the beamlets on the objective back aperture while maintaining collimation of the individual beamlets, as shown in Fig. 22. This requires that the tube lens act on beamlets that are diverging from a minimum waist position, yet have parallel chief rays.
The lens system must serve to magnify the beamlets so that the collimated spot size appropriately overfills the objective lens.
Fittinghoff and Squier [140] present a theoretical treatment of imaging multiple Gaussian beamlets to an objective that gives a good starting point for lens parameters (focal lengths and spacing) that can be refined with a paraxial ray-tracing program. However, their three-lens scan-optics system uses two closely spaced scan mirrors and forms one telecentric stop directly between the two scan mirrors, which is imaged to another telecentric stop at the back of the objective. This is common practice in many scanning-microscopy setups because commercial scan mirrors typically come mounted together in a closely spaced, periscope-type configuration, and the benefits of such simplicity usually outweigh the downside of minor vignetting caused by the fact that the telecentric stop is not exactly on either of the scan mirrors. It may be considered inconsequential for applications where only small scan angles are normally required. However, we chose to mount two scan mirrors separately so that one of the scan mirrors could later be replaced with a rotating polygonal mirror for video-rate imaging applications. Doing so clearly adds to the complexity of the scan-optics system but benefits from the ability to place telecentric stops exactly at each scan-mirror surface, which increases the lateral area that one can scan without vignetting.
The schematic of an optical system designed to scan multiple beams with separated horizontal and vertical galvonometric scanners is shown in Fig. 23. The system is independent of both the method used to generate multiple foci and the number of foci. However, the details of the system components and geometry, provided in Table 3 and shown in Figs. 24–29, are for the multifocal system used to scan six foci generated directly from the oscillator [179]. Here, a one-dimensional (1D) array of six ~1 mm diameter parallel beams with 5 mm interbeam separation is used. All lenses are achromatic doublets designed and coated for 1-μm light (CVI Laser Optics, Albuquerque, New Mexico, USA). The first lens, L1, has a 2″ aperture and a focal length of 750-mm and focuses the beams onto the first of two 5-mm clear-aperture galvanometric scan mirrors (driven by SC2000; GSI Group, Inc., Bedford, Massachusetts, USA). The focal point of L1 forms the first of three telecentric stops in the optical system. Lenses L2 and L3 are 1″ aperture lenses with focal lengths of 40-mm and form a 1/1 telescope to image the telecentric stop from the first scan mirror to the second scan mirror. Lens L4 has a 1/2″ aperture and a focal length of 19-mm. This lens serves to bend the principal axes (i.e., chief rays) of the beamlets to be mutually parallel while sharply focusing the individual beamlets such that they will expand to overfill the back aperture of the objective. Lens L5 is a 1″, 100-mm tube lens that recollimates each magnified beamlet and overlaps it to the third telecentric stop at the back aperture of the objective, as shown in the magnified inset of Fig. 23.
Figure 23.
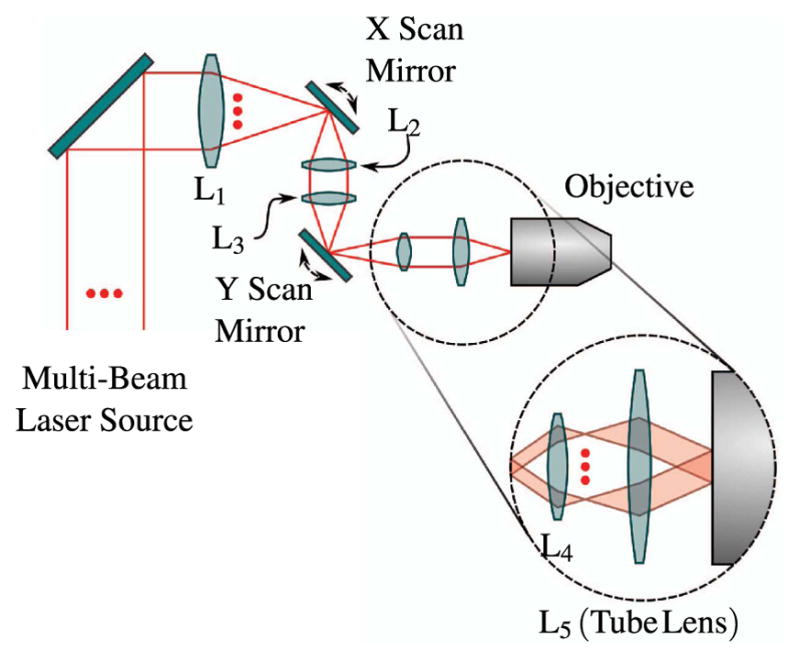
Schematic representation of multifocal scan optics. Achromatic doublets are labeled L1–L5. Magnified inset shows beam configuration on the back aperture of the objective required for scanning. For clarity, only the outer two beamlets of the array are shown.
Table 3.
Focal Lengths and Spacings for Five-Lens Multifocal Scanning System for a Home-Built Microscopea
| Element | Focal Length (mm) | Distance to Next (mm) |
|---|---|---|
| L1 | 750 | 752 to M1 |
| M1 | ∞ | 45 to L2 |
| L2 | 40 | 50 to L3 |
| L3 | 40 | 45 to M2 |
| M2 | ∞ | 12 to L4 |
| L4 | 19 | 114 to L5 |
| L5 | 100 | 110 to Obj |
L1–L5, lenses as labeled in Fig. 23; M1 and M2, horizontal and vertical scan mirrors.
Figure 24.
Multifocal scan optics: large-scale screen shot of entire five-lens system as modeled in Optica software.
Figure 29.
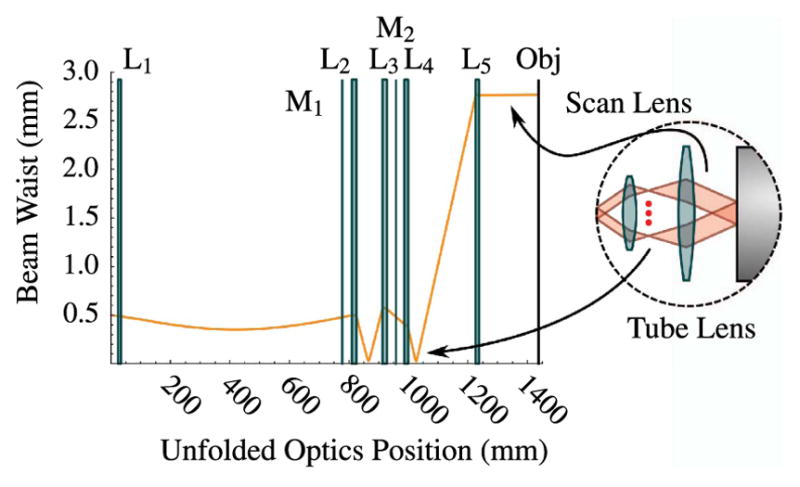
Multifocal scan optics: beam size of the central beamlet throughout the five-lens scan-optics system.
The five-lens scan optics system was modeled using the Rayica-Wavica ray-tracing and Gaussian beam propagation package (Optica Software, Urbana, Illinois, USA) that runs within Mathematica (Wolfram, Champaign, Illinois, USA). Figures 24–29 provide screen shots of the model output at various stages of the five-lens system to illustrate the performance of each lens and the criteria for assessing whether the beams are sufficiently expanded, collimated, and overlapping at the objective such that we can scan without vignetting.
Figure 24 shows a broad view of the entire five-lens scanning model. Exact focal lengths and element separation distances for the scan-optics systems for a home-built microscope are given in Table 3.
The first lens in the model, L1, simply overlaps the beamlets onto the first scan mirror and maintains collimation by negating the divergent nature of Gaussian beams. This telecentric stop will ultimately be image relayed to the back aperture of the objective.
The first scan mirror (horizontal) is placed at the focus of L1. This telecentric stop is imaged 1/1 to the second scan mirror by the second and third lenses, L2 and L3 [Fig. 25(a)]. The telecentricity of the image relay is demonstrated in Fig. 25(b) by changing the angle of M1 in the model to simulate scanning. There is some flexibility in choosing the focal lengths of L2 and L3; the desired orientation and footprint of the scan optics system will usually be the determining factor.
Figure 25.
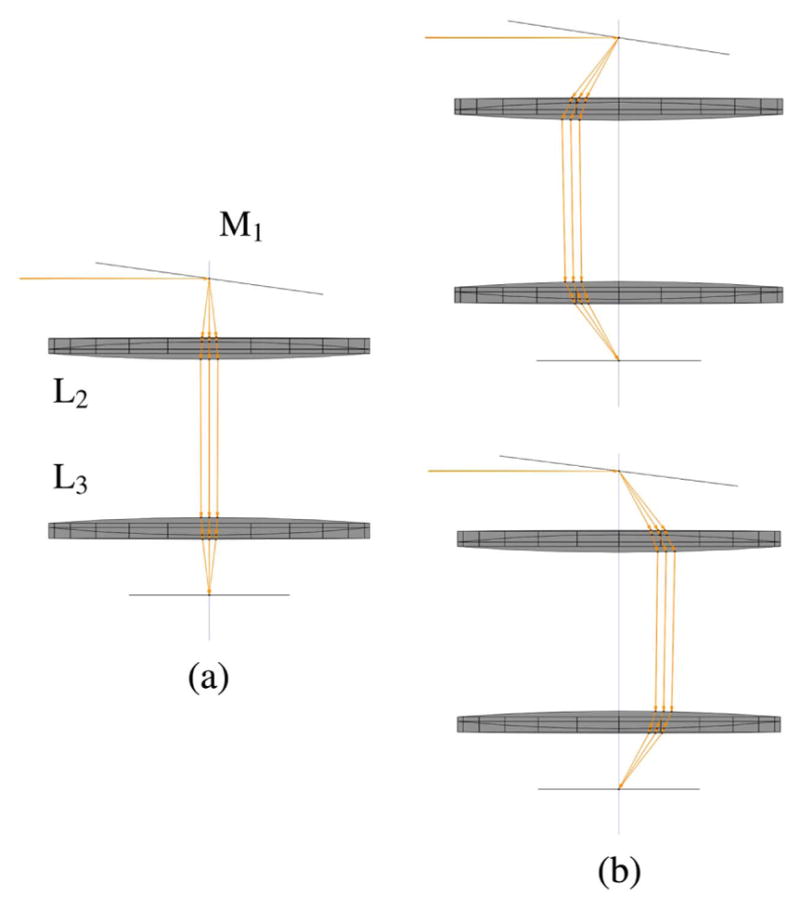
Multifocal scan optics: (a) L2 and L3 imaging the telecentric plane at M1 to M2 and (b) testing telecentric scanning by changing the angle of M1.
The fourth lens, L4 will be the shortest focal length in the system. As shown in Fig. 26, this high optical power lens serves to rapidly focus the individual beam-lets and collimate the principal axes of each beamlet. This is the key stage of the five-lens scanning system, as L4 and L5 provide the necessary magnification to fill the objective lens back aperture. Additionally, they image relay the telecentric stop at M2 to the objective back aperture, thus ensuring beamlet collimation and preventing vignetting. Note that the aspect ratio is significantly altered to stretch vertically and enable visual tracing of the beamlets’ principal and marginal axes.
Figure 26.
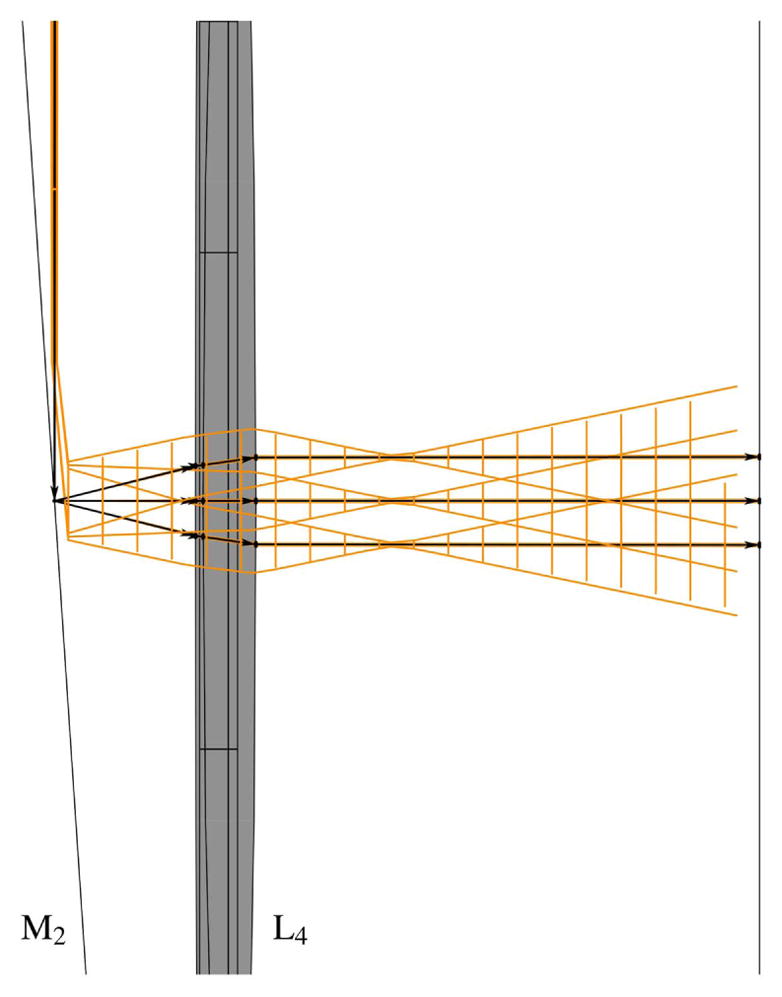
Multifocal scan optics: lens L4 serves to quickly focus the individual beamlets to their waists and bend the principal axes of each beamlet so as to be parallel.
The fifth lens, L5, or the tube lens is matched to the objective lens to correct for chromatic aberrations. As such, it is often the case that L5 is the defining optic for the focal lengths used in the rest of the system (see Section 5.3). As shown in Fig. 27, this lens is placed at a distance very near its focal length from the point at which the individual beamlets are focused by L4. It thus serves to collimate the individual beamlets and overlap them at the back aperture of the objective lens. The size of the vertical black line, representing the objective in the model, is exactly the diameter of the back aperture.
Figure 27.
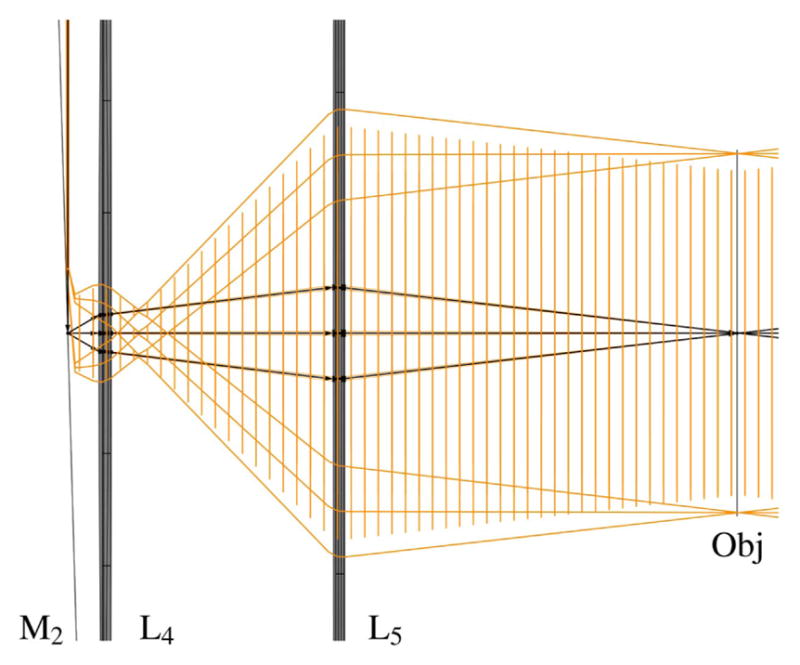
Multifocal scan optics: lens L5 serves to overlap the collimated beamlets to the back aperture of the objective.
The final step of the modeling is to test the telecentricity of the beams at the back aperture of the objective upon scanning. As was done in Fig. 25, we can show the movement of the chief rays of each beamlet upon changing the scan mirror angle. Figure 28(a) shows the chief rays of the three beams through L4 and L5 and onto the objective lens, and Fig. 28(b) shows that the chief rays remain overlapped and fixed at the objective plane.
Figure 28.
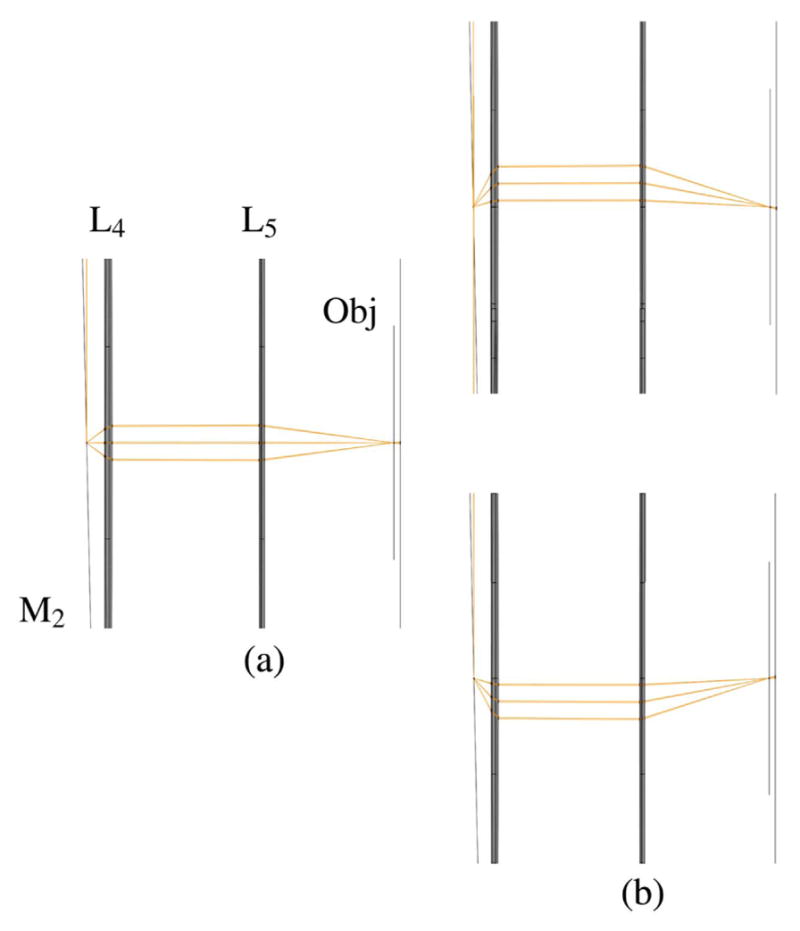
Multifocal scan optics: (a) L4 and L5 relaying the telecentric stop at M2 to the objective lens and (b) testing telecentric scanning by changing the angle of M1.
There is one final tool that is useful to confirm the collimation and beam size at the objective. Although we can visually judge the collimation level and beam size in Fig. 27, we can also plot the beam size throughout the entire scan system. Figure 29 shows that the beamlets are indeed collimated after L5 and that the beam radius is approximately 2.8-mm, which will just overfill a 5-mm diameter objective-lens back aperture. Note that our objective lenses come in a variety of entrance pupil diameters but most are in the 5–8-mm range.
5.5. Computer-Aided Optical System Design for Scan Optics Selection
In creating a microscope from square one, a challenge that is often encountered is how to design a scan system that matches the specifications of the objective. As mentioned in Section 5.3, it is conceivable that the objective will be matched to a tube lens from the objective manufacturer. In addition, the distance between the tube lens and the objective is specified. How then is an effective scan system coupled to this lens combination?
One of the best tools available for lens assessment and optical system analysis is the OpticStudio lens design program (Zemax [288], Redmond, Washington, USA). In this section, a step-by-step guide is presented that illustrates an evaluation strategy for using off-the-shelf optics in a simple scan system, and how to use a program such as OpticStudio to facilitate lens choice and placement. For the design presented in this section we used ZEMAX [57], a previous version of OpticStudio.
We will assume that the tube lens is an f = 160 – mm equiconvex singlet, and needs to be placed 100 mm in front of the objective. A design wavelength of 1040 nm is used. (Select 1.040 μm in the wavelength dialogue box, Wav.) First, choose an entrance pupil diameter of 7 mm (this is an estimate of the entrance pupil or back aperture for the objective) and select Afocal Image Space in the Gen menu, as shown in Fig. 30. We are setting up the evaluation of this system backward: from the objective to the scan mirrors. Initially we are looking only on-axis; use 0° for the field.
Figure 30.
Select 7 mm for Aperture Value and click Afocal Image Space (Gen); use 0° for the field (Fie).
The tube lens will be a simple equiconvex singlet made of n-BK7 and 3-mm thick. By deploying the Lens Data Editor (click on LDE), shown in Fig. 31, and using a Marginal Ray Height solve (M) on the last thickness, we can find the back focal distance of the singlet at the design wavelength.
Figure 31.
LDE with an f = 160 – mm singlet tube lens loaded.
Notably, in ZEMAX, the Marginal Ray Height solve is performed using paraxial equations. Next, a commercial lens is inserted for evaluation. In this case, it is assumed a magnification factor of M ≃ 2 is desirable to up-collimate the beam to completely fill the objective. From the lens catalogs (Tools > Catalogs > Lens Catalogs), an f = 80 – mm achromat is selected (Fig. 32).
Figure 32.
An f = 80 – mm achromat is selected from the lens catalog.
The lens is inserted at surface 4, resulting in the new LDE shown in Fig. 33.
Figure 33.
LDE with the achromat inserted at surface 4. Note that the semi-diameter of surface 2 has now been set to 15 mm, a typical value for a tube lens singlet.
To minimize aberrations using the lens shape, we need to reverse the lens elements of the achromat that was just inserted. This follows the rule of thumb that the surface with the greatest optical power should face the farthest image or object conjugate. ZEMAX makes it straightforward to reverse elements using the reverse element tool: Tools > Miscellaneous > Reverse Elements. The thickness of surface 3 for the LDE shown in Fig. 34 has been increased to 240 mm (~fsinglet + fachromat), and the thickness of surface 6 has been increased to 100 mm. Our basic layout now looks like that shown in Fig. 35.
Figure 34.
LDE with the achromat reversed.
Figure 35.

2D layout of the system. The beam is clearly reduced in size and not perfectly collimated (i.e., weakly focusing).
Examination of the Optical Path Difference (OPD; click on Opd to display the OPD Fan) illustrates what Fig. 35 reveals: the lens separation is not optimized and is dominated by defocus (i.e., the output beam is not perfectly collimated). The OPD is shown in Fig. 36.
Figure 36.
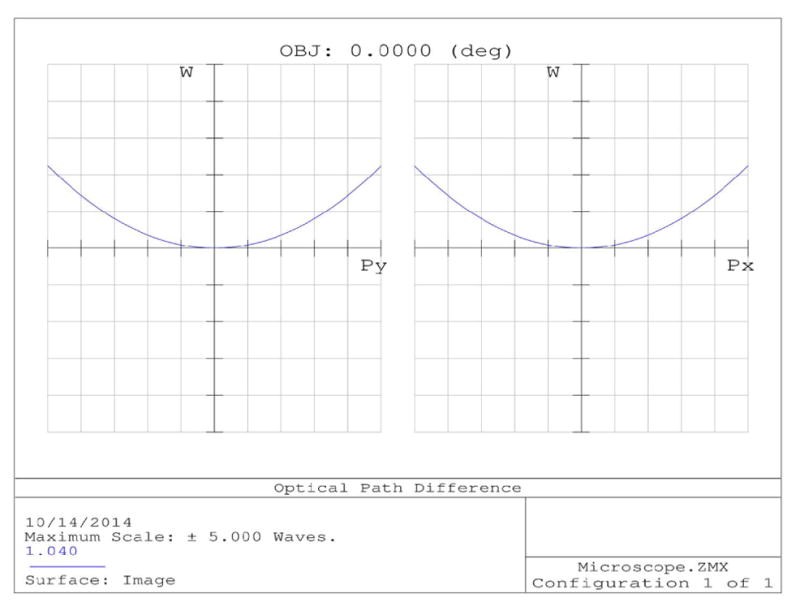
OPD Fan of the telescope prior to optimization. Note the scale of 1.0 wave per division. The quadratic shape indicates the beam is dominated by defocus (i.e., not collimated). The edge of the pupil in both the tangential and sagittal planes reaches a maximum of 2.2 waves.
ZEMAX can readily optimize and evaluate the lens separation of afocal systems (hence the reason the Afocal Image Space option was checked in our first step in the Gen menu). The LDE is modified to make surface 3 a variable thickness, as shown in Fig. 37.
Figure 37.
LDE prior to optimization. The thickness of surface 3 is changed to variable (V).
The merit function must now be constructed (Editors > MeritFunction). In this case choose Tools > Default Merit Function… and select RMS, Angular Radius, and Centroid from the drop-down boxes in the Optimization Function and Reference dialog, as we are attempting to optimize beam collimation. Optimize the configuration by clicking on Opt and select Automatic; the surface thickness is reduced by slightly more than 10 mm (240.0 mm goes to 229.8 mm, see Fig. 38).
Figure 38.
Optimized LDE. The interlens separation (thickness, surface 3) is reduced by ~10 mm.
The OPD Fan has changed significantly, as shown in Fig. 39. Note the scale change, which is now 0.002 waves per division. The maximum OPD toward the edge of the pupil (both planes) is now only – 0.007 waves; ZEMAX has added a small amount of defocus to offset higher order spherical aberration.
Figure 39.
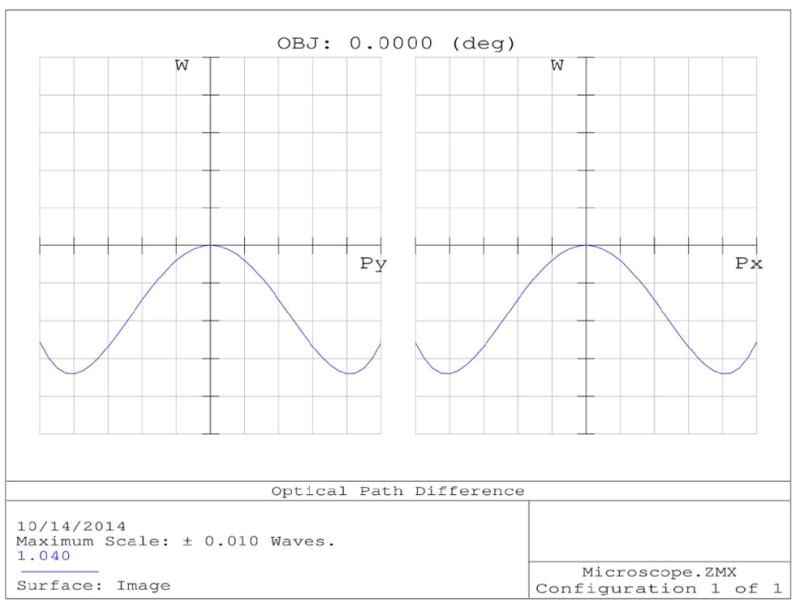
OPD Fan after optimization.
The optimization is also apparent in the system layout, which shows a collimated output beam (Fig. 40).
Figure 40.

Layout after lens separation is optimized.
The performance of the system can now be analyzed in terms of off-axis performance. A Chief Ray Height solve is added at surface 6, and an additional field angle of 3° is added. The LDE and system layout are shown in Figs. 41 and 42, respectively.
Figure 41.
LDE with a Chief Ray Height solve (C) on surface 6.
Figure 42.

Layout for two field angles: 0° in blue and 3° in green. The scan mirror will be placed at the final image plane.
Once again, like the Marginal Ray Height solve, the Chief Ray Height solve uses paraxial equations to locate the plane where the chief ray height goes to zero. In principle, this is where a scan mirror should then be located (~95 mm behind last surface of achromat). The system can now be completely reversed (Tools > Miscellaneous > Reverse Elements…) and a scan mirror (Tilt about x, used at 90°) added to examine the performance of the system (Tools > Coordinates > Add Fold Mirror) as a function of scan angle (see Figs. 43 and 44). With the system reversed, the Entrance Pupil Diameter (EPD) in the Gen menu is modified to be 3.5 mm. The stop is placed in front of the first surface of the achromat. The ratio of the semi-diameter at the image surface (IMA, surface 11) to the input semi-diameter is 3.5:1.75 = 2, indicating that the target magnification of 2 has been achieved (at least on-axis).
Figure 43.
LDE with system reversed, mirror added.
Figure 44.

System reversed with a fold mirror added that simulates a single axis of a scanning system.
To simulate and examine the performance of the system as it is scanned, the Tilt/Decenter… tool is utilized. Select Tools > Coordinates > Tilt/Decenter Elements… to add a pair of coordinate breaks about the fold mirror (see Fig. 45). The additional coordinate breaks make it possible to examine the effect of scanning the mirror without rotating the entire graphic as the scan angle is varied.
Figure 45.
LDE with additional coordinate breaks (surfaces 3 and 5) to simulate scanning of the mirror.
A convenient tool to step through different scan angles is the Multi-Configuration Editor (MCE). Select the MCE, Editors > Multiconfiguration, or click on MCE. Add two more configurations by selecting Edit > Insert Config from the MCE submenu or type Ctrl + Shift + Insert. Change the operand from MOFF (default) by clicking on it, and select PRAM, surface 3, parameter 3 (see Fig. 46). The value that is placed in the field under any of the Config columns is then the tilt about x (parameter 3) on surface 3. In this example, the tilt is 0°, 1.5°, and 3°, respectively. The system can be made to “scan” by double clicking on the desired Config. The active configuration has the asterisk. By using 3D layout (click on L3d), all the configurations can be viewed simultaneously. In the 3D Layout dialogue box, click on Settings and select All in the Configuration dialog, as well as Color Rays By: Config #. Figure 47 shows the complete system in all configurations.
Figure 46.

Multi-Configuration Editor.
Figure 47.

Layout showing three different scan angles: 0° (blue), 1.5° (green), and 3.0° (red).
The net performance of the system can be evaluated as shown in Fig. 48. In this case the OPD is plotted for each of the three configurations.
Figure 48.
OPD in the scan system as a function of scan angle: (a) 0°, 0.002 waves per division; (b) 1.5°, 0.04 waves per division; and (c) 3°, 0.2 waves per division.
As the angle is changed the beam develops defocus (i.e., not perfectly collimated) that is different in the tangential and sagittal planes as a function of scan angle. Thus, the excitation field will be curved, and the Strehl ratio of the beam will diminish at higher scan angles.
In this example, we have set up a simple optical system that evaluates the performance of a commercially available achromat for use as a scan lens at low angles, coupled with the design constraint that a tube lens, which is a singlet, located a specified distance behind the objective be used. Increasingly, scan lenses optimized for the broad range of near-infrared wavelengths used in multi-photon microscopy are becoming available. These new scan lenses can result in significantly improved off-axis performance. Recently, a series of scan lenses has been evaluated for this application by Negrean and Mansvelder [289].
6. The Objective Lens
The primary focus of Section 5 was on how to relay the laser to the back aperture of the excitation objective and also implement a scan system that would not vignette the beam by walking it off of the back aperture. While we have made mention of the objective lens already, in this section we more thoroughly address objective lens parameters and discuss briefly how to select an appropriate objective for your microscope.
Historically, as with the traditional white-light microscope, the objective lens is defined as the resolution-limited optic that forms the real image before the microscope eyepiece [73]. In the case of an infinity-corrected objective lens there is an additional optic, the aforementioned tube lens, which forms the image from the infinity projected image plane produced by the objective. Traditionally the illumination of the sample at the image plane is provided by the condenser optic, often located beneath the sample stage or opposite to the objective lens, which collects light from the illumination source and focuses it to the sample plane. The condenser optic includes a condenser diaphragm (iris), which allows the user to adjust the cone angle of the illumination to match the acceptance angle of the objective lens, and also an illumination diaphragm, which allows the user to adjust the illumination at the sample so as to match the FOV of the objective lens. Additionally, condenser optics are optimized to reduce the effects of spherical and chromatic aberrations [73].
With a multiphoton microscope, the predominant change to the microscope design is that the illumination is now provided by a pulsed near-infrared laser source. The condenser optic is replaced by an objective lens, which focuses the laser illumination sufficiently so as to excite the sample. Excited light can be detected in epi-illumination by traveling back through the excitation objective to a detector, or it may be detected in trans-illumination by proceeding through the sample and then being collected by the condenser optic and relayed to a detector. Both illumination geometries are discussed more fully in Section 7.2.
6.1. Characteristics of the Objective Lens
Objective lenses occupy a vast parameter space due to the large number of features offered. We will provide a brief, nonexhaustive description of some of the most prevalent characteristics to help familiarize the reader with options available to them. More thorough descriptions of the types of available objectives can be found in [119,290]
6.1a. Numerical Aperture
When selecting an objective lens for excitation in a multiphoton microscope, the first parameter to consider is usually the numerical aperture (NA), as this parameter has the most immediate effect on the quality of resolution. The NA is defined in Eq. (1) and is reproduced here:
where n is the index of the immersion medium and θ is half the aperture angle for the cone of light formed by the objective lens at the front optic. NA dictates the ability of the objective to focus the excitation beam; it also is a measure of the objective’s capacity to collect excited photons.
6.1b. Resolution Criterion
The image of any self-luminous point produces a diffraction pattern at the image plane. This pattern is referred to as an Airy disk and has a 0th-order central spot followed by rings of increasing order. A well-focused spot will exhibit full extinction of light between the orders. The size of the spot is a function of wavelength and also of the NA of the imaging optics. Resolution is a measurement of the ability to discern between two adjacent spots separated by a distance d, either laterally or axially. Lateral resolution is referred to as spatial resolution or resolving power. Axial resolution is referred to as depth of focus.
There are many representations of the resolution limit and they are dependent on different criteria and also on the assumptions made during calculation. The three main criteria that one encounters are the Rayleigh, Abbe, and Sparrow criteria and are applied in situations where you have two luminous points in a dark field:
| (25) |
| (26) |
| (27) |
The Sparrow criterion is where there is no reduction at all and this criterion is generally applied only in astronomy. The Rayleigh criterion, which is perhaps the most prevalent of the three in microscopy, is where there is a 20%–30% reduction in peak intensity between two adjacent Airy disks where the 0th-order peak of one lies directly over the first minimum of the other. The Rayleigh criterion is a good measure of what will be discernible by the eye. However, finer resolutions for the separation of adjacent objects are achievable through analysis of photon statistics [291–293]. These methods are particularly useful in single-molecule microscopy, where the self-luminous samples may be approximated as point sources (see Fig. 49) [294–297].
Figure 49.
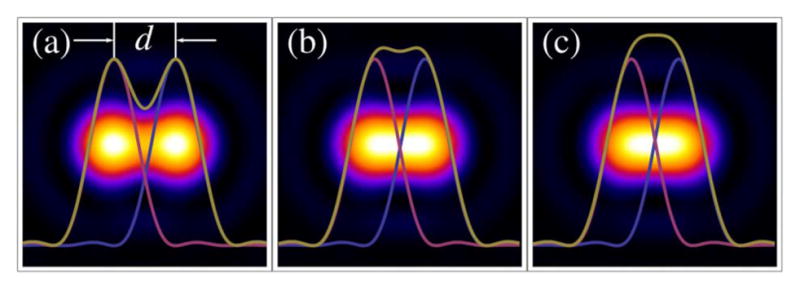
Resolution focal spots and lateral PSFs for (a) the Rayleigh, (b) Abbe, (c) and Sparrow criteria.
The Rayleigh criterion gives the resolution limit for spatial resolution and depth of focus as
| (28) |
For a multiphoton microscope, the NA is a measure of how tightly the excitation light of the laser beam may be focused. The lateral or axial intensity profile of the focal volume is referred to as the point spread function (PSF). For multiphoton processes, the PSF is raised to the power N, which corresponds to the order of the nonlinear process. Thus the resolution is improved by [17,149]:
| (29) |
| (30) |
Equations (25)–(30) are based on paraxial assumptions where, for small angles, sin(θ) ≃ θ.. Above NAs of 0.7, these approximations begin to deviate from both the nonparaxial scalar solution [298] and the full vectorial calculations (which account for polarization) for the PSF [100,299,300]. Since, multiphoton microscopy often utilizes objectives with NAs larger than 0.7 it is important to consider this deviation. The study of image formation with diffracted light is a rich and active field stemming from early papers that laid the foundation [301,302] to contemporary research [106,303–305]. Other documents of interest include [99,101,104], and specifically [103], which deals with confocal microscopy, and books [100,105,110,306].
The 1/e radius of the maximal intensity for the square of the intensity point spread function (IPSF2), which was presented in Section 5.3, is reproduced here along with the associated depth of focus:
| (31) |
| (32) |
6.1c. Immersion Oil
Immersion oils allow for higher NA by raising (i.e., matching) the index of refraction between the objective and sample. By trying to index match the materials it allows a more effective collection of the diffracted light. An NA of 1.4 is typically the best value achievable with most immersion fluids. NAs in excess of 1.5 have been demonstrated by using solid immersion lenses [307]. Band coloring for different immersion fluids is presented in Table 4.
Table 4.
Immersion Band Colors
| Immersion | NA | Band Color |
|---|---|---|
| Air | 0.025–0.95 | No Color |
| Water | 0.3–1.3 | White |
| Glycerol | 0.8–1.35 | Orange |
| Oil | 0.7–1.45 | Black |
| Special | — | Red |
6.1d. Field of View
In addition to NA, the objective lens’ field size or field of view (FOV) is also very important. FOV is a measurement of the diameter of the circular visible portion of the sample. If FOV is not expressly stated by the manufacturer it may be calculated from the objective lens’ magnification (M) and its field number (FN), where FN is always given in millimeters:
| (33) |
Additionally, FOV plays a role in the objective’s ability to collect nonballistic photons in a scattering sample [5,125,129,308]. FOV is very important for a trans-illumination geometry because the collection optic’s FOV should match or exceed that of the excitation objective to ensure efficient collection of nonlinearly produced photons.
6.1e. Magnification
Magnification is a ratio of the size of the image produced by the microscope to the size of the sample and may range from 0.5× to 250×. Magnification is written on the barrel of the objective and is often represented by a colored band (see Table 5). It is important to remember that magnification is not equivalent to resolution. The overall magnification of the microscope becomes particularly important when forming an image on a two-dimensional (2D) detection array such as a CCD camera. The finest feature size resolvable by the objective should be magnified sufficiently so as to be discernible by the detection equipment (e.g., matched to the size of the detector’s pixel pitch).
Table 5.
Objective Magnification Colors
| Magnification | Colored Band |
|---|---|
| 0.5 | No color |
| 1 × –1.5 × | Black |
| 2 × –2.5 × | Brown |
| 4 × –5 × | Red |
| 10× | Yellow |
| 16 × –20 × | Green |
| 25 × –32 × | Blue-Green |
| 40 × –50 × | Light Blue |
| 60 × –63 × | Dark Blue |
| 100 × –250 × | White |
For a nonimaging detection geometry the objective lens’ magnification parameter is not as crucial as is the FOV. This is because all light detected by the single-element detector is attributed to be within the focal spot of the excitation beam.
6.1f. Working Distance
The working distance (wd) is defined as the distance from the front lens element of the objective or collection optic to the nearest surface of the coverglass or sample [102] while the source of photons is in sharp focus. Working distances for high-NA objectives are usually of the order of a fraction of a millimeter. This presents difficulties when trying to resolve fine features in scattering media at depths of the order of 1 mm. Table 6 presents some general values of magnification, NA, and wd. High-NA objectives that have long working distances usually achieve this by having a large front aperture. However, these objectives tend to be as much as 5 times the cost of a standard 0.65 NA objective lens and so they represent a substantial investment.
Table 6.
Magnification, NA, and Working Distance Values for a Variety of Air Immersion Objectives
| Magnification | NA | wd (mm) |
|---|---|---|
| 10× | 0.2 | 16.1 |
| 20× | 0.4 | 7.3 |
| 50× | 0.55 | 2.0 |
| 63× | 0.75 | 1.7 |
| 100× | 0.9 | 0.28 |
6.1g. Optical Corrections
Optical corrections compensate for a variety of optical aberrations. Some of the most common correct for chromatic aberration; achromats, apochromats, and super achromats are corrected over two, three, and four colors, respectively. Additionally, some objectives correct for Petzval (i.e., field) curvature of the focal plane.
6.1h. Objective Recommendation
Some recommendations for multiphoton microscopy objectives can be found in the literature [77,309,310]. Reference [311] provides an analysis of the performance of high-NA immersion objectives for deep-tissue light collection.
7. Collection Theory and Optics
In previous sections, we have discussed how to produce an excitation spot that is transform limited in time and diffraction limited in space. In this section, we discuss strategies for collecting the contrast signal with high efficiency. As in previous sections, we begin with a broad overview of the problem. We then discuss strategies for optimizing collection efficiency, and finally move on to our own work with a custom-designed, home-built collection lens, and compare it to other collections strategies with direct measurements of collection efficiency.
7.1. Single-Element Detection Basics
The detection system can play a critical role in the signal-to-noise ratio (SNR) of final images through the efficient collection of photons. The typical MPLSM system utilizes whole-field detection with a single-element detector, such as a photomultiplier tube (PMT), to measure the signal intensity for each voxel in a data set. There are two primary paradigms for multiphoton imaging: (1) where the excited light is collected in the back direction (epiillumination), and (2) where the excited light is collected in the forward direction (transillumination).
7.1a. Scattering Ambiguity
Many samples, especially thick biological samples, exhibit strong scattering of both the excitation and signal light. This has the effect of distorting the wavefront of the light and results in a degradation of the image quality. This decrease in image quality is particularly noticeable in microscopes where imaging detection is used. Usually a single focus is scanned, i.e., raster scanned or scanning Lissajous, or a multifocal array is generated and likewise scanned in parallel. Either way, the image is constructed by integrating the signal on a 2D detector like a charge-coupled device (CCD). With a turbid sample, nonballistic photons may scatter and register at an incorrect position on the 2D detector. This appears as a visible blur or fog on the image.
Solving the scattering problem for single-focus multiphoton microscopy (SMM) scanning is relatively simple and is similar to flying-spot microscopy. With both confocal and multiphoton microscopy the detected signal can be attributed uniquely to the focal region of the laser within the sample. This is accomplished by calibrating the position of the scan mirrors with the position of the laser’s.
With multifocal multiphoton microscopy (MMM) the solution is more challenging. Multifocal or extended geometry scanning designs seeks to acquire images more rapidly by parallelizing image acquisition. The difficulty is that this usually requires a detector that matches the dimensions of the illumination geometry: e.g., for a line focus, a 1D array; for a 5 × 5 array of focal spots, a 2D array. Kim et al. [261] demonstrated a solution to multifocal scattering that uses a multianode PMT. The technique assumes that most of the photons from one of the focuses will arrive at the corroborating PMT anode. However, in the case of photons arriving on other PMT anodes, the signal can me “unmixed” or deconvolved and return excellent images, which were reported as deep as 75 μm.
Additionally, as the density of the foci increases with MMM, the sectioning capability of the microscope will decrease to overlap of the PSFs [138]. To compensate for this, the arrival times of the pulses are staggered and the temporally multiplexed pulses will no longer overlap [139,140,256]
Now that the pulses are staggered in time, they arrive separately at the detector. There is no longer a need for a multidimensional array provided that there are electronics that can demultiplex and reconstruct the image [278,287,312]. This is called differential multiphoton microscopy (DMM). This is particularly advantageous as now one can image deeply in scattering media and acquire an image at a faster rate than SMM.
7.1b. Nonimaging Detection
One characteristic of confocal microscopy is the necessity to place a confocal pinhole at a conjugate image plane of the sample. This requires descanning the signal light by relaying it back through the scan optics and then extracting the signal through the use of dichroic filters. Furthermore, while the use of a confocal pinhole spatially filters out-of-focus flare, it also negatively impacts the SNR, and, so, a balance must be struck between resolution and signal intensity.
Multiphoton microscopy allows for single-element detection geometries in which the signal light does not need to be descanned, nor does a conjugate image of the sample need to be formed. The nature of the multiphoton process limits the production of signal photons to well within the focal spot of the laser. This spatial filtering fills a similar function to that of the confocal pinhole. The advantage provided by multiphoton microscopy is that, now, nonballistic photons that reach the detector can be attributed to a position in the sample within the PSF of the focal spot. Additionally, by not having to descan the signal, potential signal loss from the additional optical elements is reduced. All of this has the effect of increasing the signal intensity, which is particularly important when trying to image deep in a scattering medium.
Multiphoton microscopy has the additional advantage that, with longer wavelengths, the excitation light is not scattered as strongly as it would be for the shorter wavelengths of linear microscopy.
7.2. Epi- and Transmission-Illumination
Detection of contrast in the epi-direction and the transmission direction require different schemes to be optimized. Let us begin with detection in the epi-direction, in which we will assume that the contrast mechanism is fluorescence.
Physically, epi-detection corresponds to measuring the fluorescent signal through the same objective used to focus the excitation beam. This is possible due to the incoherent nature of fluorescent light, which destroys the phase information from the illumination beam. As a result, photons from a fluorescent specimen are emitted in all spatial directions. For a homogenous distribution of fluorophores the pattern of light emission is best described by a spherical distribution with homogeneous angular distribution.
When imaging in the epi-direction, it is important to consider the effect of scattering. In general, if collection is restricted to the epi-direction, it is due to an optically opaque specimen that will exhibit significant scattering at deep imaging depths. As such, it is desirable to utilize a collection lens with the largest FOV possible, implying lower magnification [Eq. (33)]. Simply selecting a lens with low magnification is often not desirable, as there is often a corresponding decrease in the NA of the lens, as well, which negatively impacts the spatial resolution [313]. To solve this problem, numerous commercial objectives are available today that strike a balance between NA and magnification, thereby optimizing collection efficiency while maintaining a high spatial resolution; it is easy to find objectives with an NA near 1 and a magnification of 20×.
There are several designs that allow for additional light to be collected in excess to that collected through the front aperture of the excitation-side objective: liquid light guides (LLGs [314]) and custom optomechanics [315–318] are some relevant examples.
As a rule of thumb, the collection efficiency of a microscope may be optimized by simply imaging the back aperture of the objective lens to the active area of the photosensor [319]. This step helps ensure that highly scattered photons are optimally routed to the detector. Conversely, collection in the transmissive direction implies that specimens are optically thin as compared to those restricted to only the epi-detection.
7.3. Choice of Dichroic Filters and Optical Filters
Isolating the signal of interest from other sources of contrast is critical in the design of a collection system. This consists of a combination of dichroic beam splitters and optical filters to allow only a single contrast modality to impinge on each detection channel. In many situations, it is difficult or impossible to obtain perfect rejection of background signal, or other excitation signals, on each channel. This may arise from endogenous fluorescence that has not been accounted for or simply from cross talk of broad fluorescence spectra. Without good rejection of background signal, the dynamic range of the data set can be easily flooded with unwanted contrast, resulting in a reduction in SNR. The best practice is to select filters, dichroic beam splitters, and detectors to optimize the amount of signal for each channel. In the event that there is crosstalk due to broad spectra, postprocessing techniques may be applied to enhance SNR and normalize each channel. This process is discussed in detail in Section 9.
7.4. Design of a Collection Optic for Transmission Detection
The default epi-collection optic in a MPLSM is the excitation objective. Improving collection in the epi-direction is therefore largely a matter of selecting a better, and often, more expensive objective with a larger NA or FOV.
Alternatively, a transmission collection optic can be designed so as to optimize the NA and FOV while relaxing the design constraints on a resolution-limited objective lens.
Trans-illumination geometry multiphoton microscopes feature either a system of two matching objectives (see Fig. 3), one to focus the illumination and excite the sample and the other for collection of the transmitted light, or a system in which the light is focused by an excitation objective, and then collection is performed by the condenser system with added detection equipment. Multiple modes of excitation may be detected in the transmitted signal by use of filters or by temporal discrimination [82].
This matching objective system implies that as the NA increases, the working distance decreases if the front aperture of the objective remains the same. Thus, increasing the NA of the microscope is usually accompanied by a decreased ability to both excite and collect deep in tissue, a reduction in FOV, and a significant increase in system cost. For this section, we will address the value of a custom-designed collection optic for trans-illumination geometry microscopes.
To overcome some of the limitations of the matching objective arrangement, we have designed a simple inexpensive collection optic with high numerical aperture (COHNA) suitable for single-element detection. COHNA has a front focal length of 1.5 mm, an NA of 0.95 in air, and a robust transverse alignment sensitivity of 1 mm (which corresponds to a FOV of similar size). It also facilitates easy exchange of filters so as to select different imaging modalities. A theoretical model for collection efficiency, consistent with previous work by [308], is presented, based upon which numerical estimations of collection efficiency are calculated for COHNA and an ensemble of objectives. An experimental comparison is conducted by measuring the photon count from TPEF of Rhodamine 6G sample cells through both coverglass (170 μm) and a glass slide 1.2 mm). Additionally, TPEF images of femtosecond-laser-machined channels ) in a 1.2-mm-thick fused silica substrate are taken for comparison of COHNA and one stock objective. Finally, two laser-machined structures in a thick substrate (~4 mm) are examined using a harmonic-generated response from a 1038-nm Yb:KGW fundamental (see Section 3.2), and these results are compared with white-light images.
To provide an analytic comparison of objectives to COHNA, which have either comparable NA or working distance, we develop a simple theoretical equation for the collection efficiency of an optic. We employ the terms and metric for collection efficiency established by Zinter and Levine [308], where the photon source is treated as an isotropic point source that radiates into 4π, and where we define collection efficiency as a measure of the percentage of light that is gathered from the total 4π sr. Our equation uses NA to specify the aperture angle θNA subtended by the source in order to calculate the percentage of light gathered. To determine collection efficiency of an optic when the NA is limited by operating at a distance longer than the prescribed working distance, we expand the previous expression by using nonparaxial ray-tracing equations (i.e., sin θ ≠ θ, and rays are traced through flat surfaces using Snell’s law) and incorporating the new distance to the photon source to calculate the new effective NA. This model assumes a transparent material with only ballistic scattering of photons within the medium. Due to limitations in our knowledge of specific lens design for individual objectives, the model is limited in that it cannot predict nonimaging high-collection regimes of the commercial objectives.
7.5. Collection Theory
We assume an isotropic point source of fluorescence photons produced within the bulk at a depth of z0 with no photons generated outside of this focal volume. We neglect the effects of a turbid medium, surface roughness, and FOV [5,125,129] in order to provide a simple analytic equation to be used for predicting the relative performance of different collection optics.
TPEF is an optimal source because of the uniform emission of photons into the 4π sphere. COHNA may also be used for second- and third-harmonic microscopy. The difference is that, for harmonic generation, the emission of the photons is in the propagation direction of the excitation beam, and that it diverges as (1/N)1/2, where N is the power of the harmonic relative to the fundamental [155,320]. This means that, in general, a lower NA optic than the excitation objective can collect the harmonic signal.
Since our source is isotropic and radially symmetric we can define an equation as a function of NA or θNA, as opposed to using solid angle (Ω) as the defining parameter for the collection efficiency of any given objective or collection optic.
To determine the collection efficiency (CE) of a collection optic, we use the angular aperture to calculate the percentage solid angle of a sphere that is subtended by a cone of light dictated by the NA as a function of the polar angle θ, which is given by
| (34) |
In terms of NA, Eq. (34) becomes
| (35) |
From Eq. (35), we see that, as NA approaches the index of refraction, our percentage of collected light approaches 1/2.
Equations (34) and (35) assume an optical system with no loss due to reflection. We calculate the reflection losses from transmission curves provided by the objective manufacturers. The transmission efficiency for COHNA is calculated from the product of individual transmission curves for the different glass types involved and can be found along with the transmission efficiencies (Tλ) for the other objectives in Table 7.
Table 7.
Optic Specifications and Predicted Collection Efficiency
| Make and Model | NA | NAeff | n | Tλ = 566 μm | CE |
|---|---|---|---|---|---|
| Olympus UPLSAPO10X | 0.4 | 0.4 | 1.0 | 90% | 4.75% |
| Zeiss 44 00 52 01 | 1.2 | 0.79 | 1.33 | 85% | 10.13% |
| Olympus UPLSAPO20X | 0.75 | 0.72 | 1.0 | 90% | 20.61% |
| COHNA | 0.95 | 0.95 | 1.0 | 88% | 30.33% |
While Eqs. (34) and (35) readily give us the percentage of gathered light provided that we know the NA, when we try to collect through multiple media of thicknesses larger than the design specifications for wd or the expected cover-glass thickness (cg), we then need to determine the effective NA of the objectives in this regime. Determining the effective NA enables us to compare the theoretical performance of stock objectives to a custom collection optic. Typically, z0 is the same as cg, except when the photon source is located deep within the substrate.
We make numerical estimates of the effective NA of three stock objectives by using nonparaxial ray-tracing equations [321,322]. We place a 0.4-NA Olympus objective, which has a long working distance, at the correct position from the source so as to operate with its prescribed NA. For the theoretical predictions the other two stock objectives are placed within a millimeter of the glass slide, and for the experiment this distance is adjusted so as to maximize the count rate of detected photons. This ensures that we maximize the effective NA of these objectives. The total distance between the source and the front optic surface of the objective/optic is designated by d. The optical parameters and predicted collection efficiencies are provided in Table 7.
7.6. COHNA Design
Multiphoton microscopes, particularly for nonlinear harmonic microscopy, have often employed two matching objectives in a trans-illumination geometry. The excitation objective focuses the light to the sample, and either the sample or the focus is scanned (see Section 5). The second objective serves as a collection optic and transfers the endogenously produced signal to a detection surface, such as a PMT [47,88,149]. Notably, for many applications it is important that the collection objective not make contact with the specimen, and as such, this is one of the design constraints for our optic. As discussed, the microscope objective is a resolution-limited imaging optic responsible for forming an intermediate image before the eyepiece [73,323]. Since we use a single-element detection paradigm, we wish to design a collection optic that removes the resolution-limit design restraint and, instead, relays the collected light to the detection surface. This type of optic is typically referred to as a nonimaging optic and is often used in the fields of radiometry or photometry [324–328]. These optics focus on optimizing radiative transfer (concentrations) and illuminance distribution (illumination) instead of on producing an image. A variety of designs and applications have been presented [325,329–333] that use a variety of ray-tracing tools and software-based optimization techniques. In our case, we wish to optimize the concentration by maximizing the radiant flux from an isotropic point source to the single-element detection surface while neglecting illumination. Often in nonimaging optical design, an optic is characterized by its light collection power (étendue or geometric extent). This is a useful description when working with extended sources; however, since we are collecting light from an idealized point source we use a simplified version of the model presented by [308] for calculating the collection efficiency.
The design uses an inverted two-lens Abbe condenser-like system to collect and collimate the light, which allows for the use of both absorptive and interference filters [73,334]. The inverted condenser is followed by a singlet, which focuses the light onto the detection surface of a PMT. We selected lenses with relatively high transmission for the ultraviolet A (UVA: 315–400 nm) spectrum, thus providing access to the THG response for our KGW excitation source. The lenses also have a relatively short focal length to accommodate a short total track (i.e., axial extent) for the system, which would make it comparable in physical size and length to the stock objectives.
The lenses for the initial design are selected from stock optics. This selection is based primarily upon the design requirements for a large front focal length and a large NA. These design parameters naturally lead to lenses with large optical diameters and small f /#s. Lenses were also chosen based on glass type and their ability to transmit light from the UVA up to 1 μm. Once lenses were selected, we modeled our design using thin- and thick-lens paraxial ray-tracing equations. Despite the characteristic assumptions of thin-lens (where the lens thicknesses are small in comparison with optical diameter) and paraxial equations (where we deal with small ray angles and small heights relative to the length of the optical system), the first- and second-order designs provide a starting point that is remarkably close to the computer-aided optimized result (Fig. 50).
Figure 50.
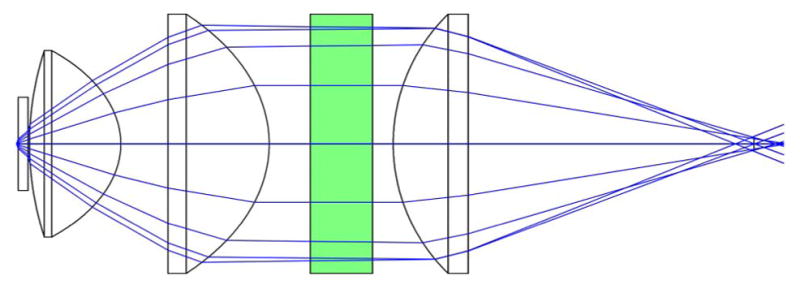
Optimized layout of the lenses, which have been adjusted to provide collimation between the last two lenses for an interference filter (in green) and a sufficiently small spot size for the single-element detection surface.
By using optical design and optimization software, we are able to make the fine adjustments in the intralens distances to ensure collimation between the condenser-like system and the focusing lens and also to provide a sufficiently small spot size (~1 mm) on our PMT detection surface (9.5 mm) for a variety of wavelengths (350–600 nm).
The final design components and specifications are provided in Table 8. The relative position of the first two optics (the condenser-like system) in COHNA are the most sensitive in terms of axial alignment. The interlens distance between these two optics can vary by ±2 mm with negligible effects on the quality of collimation between the condenser-like system and the focusing singlet. The axial alignment of the filter glass in the system is inconsequential for absorptive filter glass and also for interference filters, provided that the collimation is good between the second and third lenses. The distance between the second and third lenses can vary greatly to accommodate a variety of geometries for implementing dichroics and multimode detection paradigms. The front and back focal lengths of the system can easily be found in practice by varying the relative position of COHNA to the detector and sample in order to maximize the detected signal strength.
Table 8.
Optical Elements and Spacings for COHNA
| Surface Number | Description | Optic Number | Thickness | Glass Type |
|---|---|---|---|---|
| 1 | Glass slide | 0.150 mm | air | |
| 2 | 0.950 mm | silica | ||
| 3 | 0.150 mm | air | ||
| 4 | Opto-Sigma aspheric lens | 023–2250 | 8.800 mm | B270 |
| 5 | 4.554 mm | air | ||
| 6 | Edmund Optics aspheric lens | 49589 | 9.750 mm | fused silica |
| 7 | 3.955 mm | air | ||
| 8 | Generic glass for interference filters | 6.000 mm | Borofloat | |
| 9 | 2.000 mm | air | ||
| 10 | Edmund Optics singlet | 48821 UV-VIS 0.5–1% Loss |
7.250 mm | C79–80 |
| 11 | 27.542 mm | air |
An excellent example of the design process is found in Velzel [285].
7.7. Results
To compare COHNA against the stock objectives we measured photon counts from the TPEF response of a 1-μM solution of Rhodamine 6G in methanol excited by our 1038 nm Yb:KGW laser. All measurements were 1-min scans with the same power at focus. COHNA produced measurably better collection efficiency based on a relative comparison to the collection efficiencies of the other objectives. All of the stock objectives are infinity corrected. We used the same filters for all measurements and the same focusing lens, as well (48821 UV-VIS; Edmund Optics, Barrington, New Jersey, USA). These results are presented in Fig. 51. The predicted relative performance of COHNA in comparison with the other objectives matched the experimental results. COHNA performed the best, followed by the Olympus UPLSAPO20X, then the Zeiss 44 00 52 01, and then finally the Olympus UPLSAPO10X. The Olympus UPLSAPO10X was the only optic that deviated significantly from the theory. In practice, we encountered a nonimaging regime with the UPLSAPO10X within the prescribed working distance where the collection efficiency was much greater than predicted by the prescribed NA.
Figure 51.
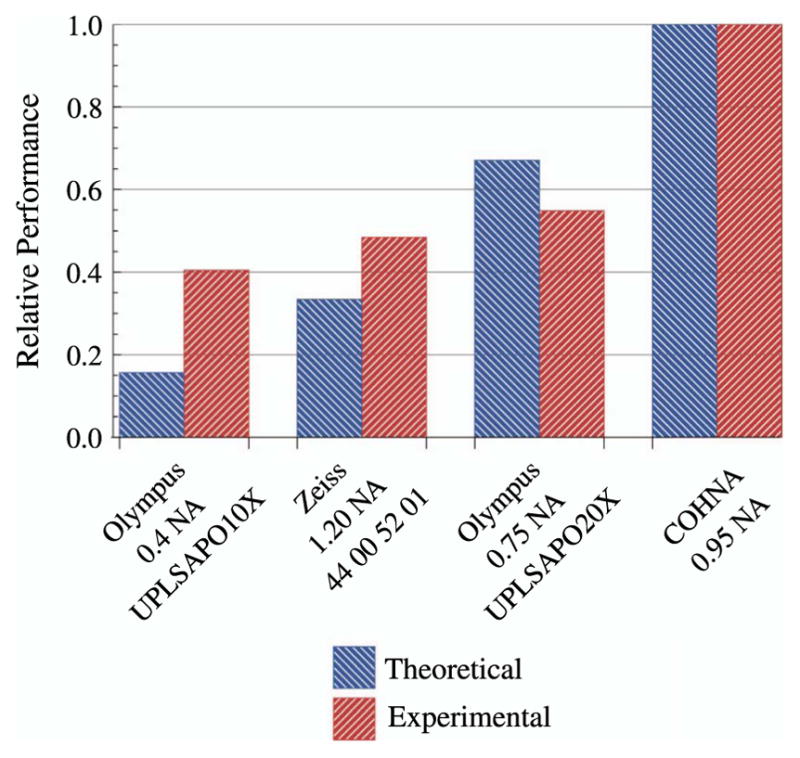
Comparison of the measured results and predictions for collection efficiency of three stock objectives and our custom measurement optic (COHNA), where the results are normalized with respect to COHNA.
A comparison was also made by imaging femtosecond-pulse laser-machined channels in 1.2-mm-thick fused silica with COHNA and the Olympus UPLSAPO20X. The samples were coated in fluorescent dye and excited by our 1038 nm Yb:KGW laser. Images of the trenches are presented in Fig. 52. The ratio of total photon counts between the two images (1.46/1) agrees within 1% of the theoretical predictions in Table 7, namely, of a 47% increase in collection efficiency for COHNA over the Olympus UPLSAPO20X.
Figure 52.
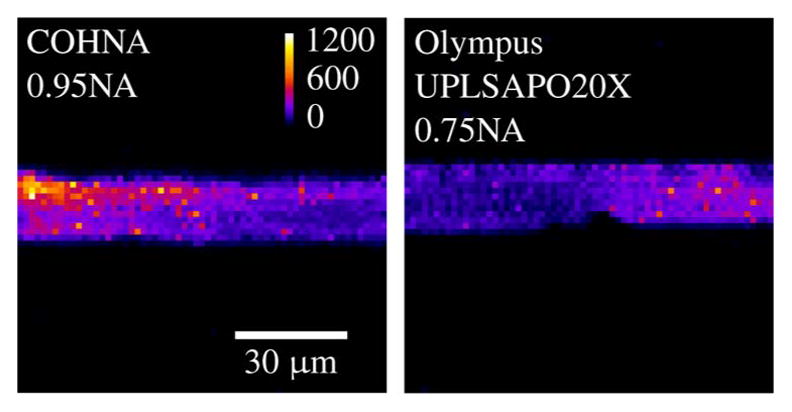
TPEF images of laser-machined trenches in 1.2-mm-thick fused silica.
7.7a. Images Taken with COHNA through Thick Substrates
Having characterized the performance of COHNA, we then used the collection optic to acquire images of a laser-machined structure. This structure was located within a few hundred micrometers of the surface. However, the substrate was 4.09-mm thick, making efficient collection with standard objectives prohibitive. We used our KGW with an average power of 300 mW into the microscope (approximately between 60 and 75 mW at the focus) and an Olympus 0.75 NA 40× objective for excitation. The sample was placed such that the 0.75 NA excitation objective could focus on the structures. COHNA was positioned to collect the SHG and THG signals through the sample.
7.7b. Bubble Patterns in Fused Silica
The sample contained a laser-generated bubble pattern in a 4.09-mm-thick fused-silica slide. Under certain exposure conditions (femtosecond pulses in the cumulative regime) [335], the formation of self-organized patterns, characterized by highly regular bubbles, in a 2D or 3D network is observed. The bubble pattern was formed by translating a fused-silica glass sample through the focus of a femtosecond laser beam. The cumulative energy deposits from the pulsed laser beam produced thermal effects, thus creating the bubble micro-explosion, which, when coupled with certain translation speeds of the sample, created self-organized bubbles in the material. Figure 53 shows an example of a highly regular 2D network.
Figure 53.
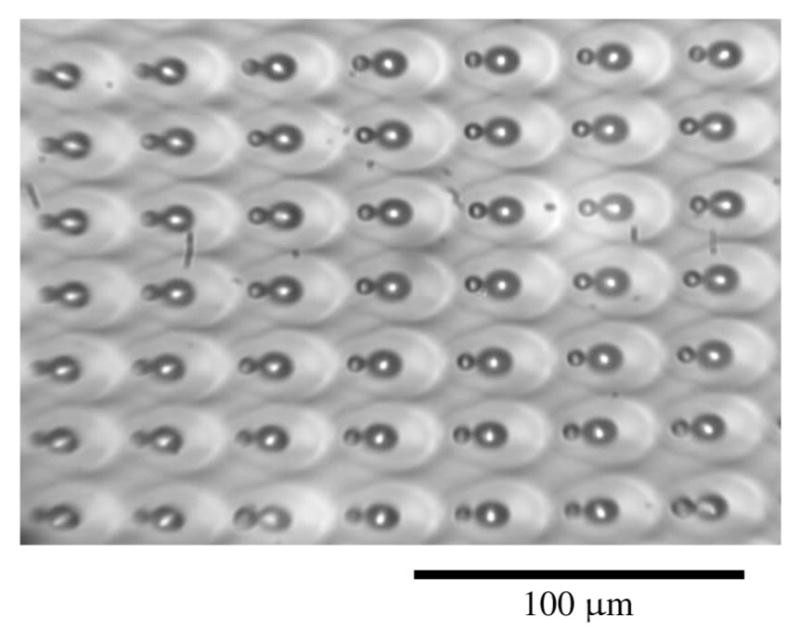
Example of a 2D bubble network imaged with white-light illumination.
These structures are 3D and have fine features that make them difficult to observe with classical white-light absorption microscopy. Figure 54 (sample provided by [335]) provides a comparative view of the different imaging modalities, both separate and overlaid on a white-light image. The observation of these bubble structures with THG microscopy allows us to see not only the detail of the 3D structure of the laser-affected zone, but also details inside the structure themselves (see Fig. 56).
Figure 54.
Montage of a single bubble pair with and without white-light illumination seen with different overlays of SHG and THG modalities.
Figure 56.
Montage of the projected 3D reconstruction of a single bubble assembly. Images are presented at different rotation angles (displayed in the lower left corner) clockwise about the y axis.
In comparison to the white-light image, a number of interesting structures were observed in THG. Both white-light and THG images show the central vacuole; however, in THG a halo structure around the central bubble with small round nodules appearing in the intra-halo-vacuole area were also observed. In Fig. 55 the THG image also shows an additional halo structure within the laser-affected zone.
Figure 55.
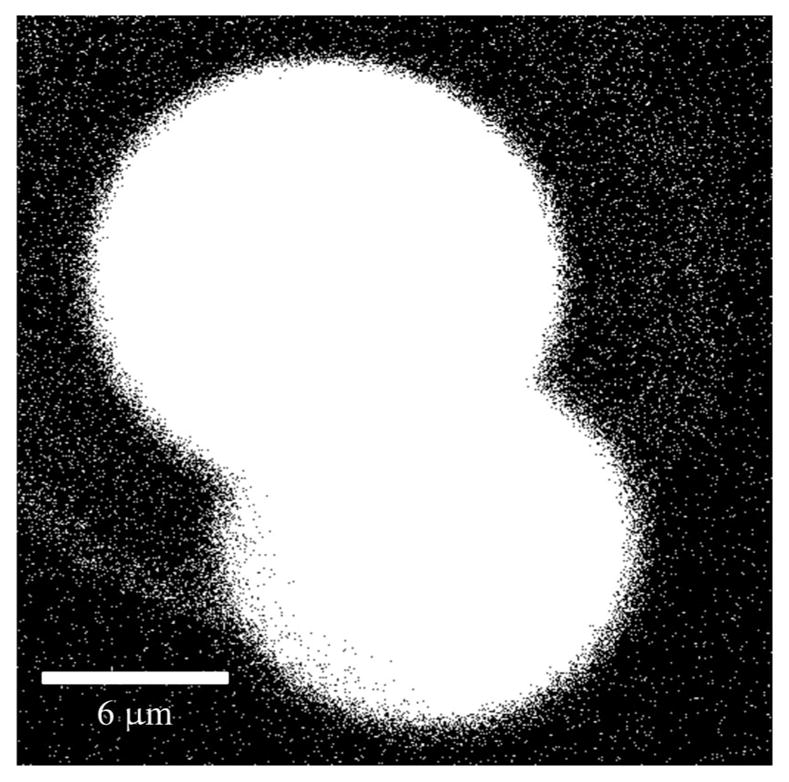
THG image with a binary calibration demonstrating the laser-affected zone.
Detection in SHG produced a faint image that was only three to four counts above the background noise. Despite the SNR in SHG, the central vacuole and the additional halo structure within the laser-affected zone were visible. The SHG halo structure was distinct from the primary THG halo structure seen in Fig. 54, but was visible in the THG binary contrast image in Fig. 55.
A 3D projection of the fused-silica bubble sample was created by adjusting the sample height by equal increments (Fig. 56). In THG the 3D nature of the laser-affected zone is fully revealed. Comet-like shapes are visible (see in particular Label B in Fig. 56). The length of these structures (Label B), stretching along the laser propagation axis, seems to be correlated with the bubble diameter. For instance, the smaller bubble seen in the top view in Fig. 56 yielded a shorter comet tail. The small bubble (in the top view) was formed first. The bubbles seem to have formed through successive bubble nucleation and coalescence events, as highlighted by [335]. Indeed, the THG image in Fig. 56 (Label A) reveals the presence of a tiny satellite bubble close to the largest bubble.
8. Photon-Counting Detection
8.1. Detector Selection
Up to this point we have discussed the physical construction of a multiphoton microscope, from the selection of the laser source to the objective lens and collection optics. Now all that remains, in terms of acquiring a signal, is the selection of a detector. When selecting a detector there are many criteria to consider: spectral response, quantum efficiency, noise, rise time or bandwidth, dead time, single-element versus array detector, and cost [336–339]. We limit our discussion of detectors to only single-element devices and primarily to PMTs. However, there are other texts [336,337] that present an excellent introduction to many types of optical detectors, both single element and array.
Often with microscopy techniques like confocal and multiphoton, the light level from the sample (number of photons) is below 108 photons/s and subject to a non-negligible amount of noise. The general solution for detection of these weak signals is the use of a photomultiplier tube (PMT) in conjunction with a pulse amplifier so as to provide a large analog signal.
PMTs are widely used nonimaging single-element detectors that are utilized in the low-light conditions common to both confocal and multiphoton microscopy. PMTs provide an excellent balance of quantum efficiency, response time, wavelength sensitivity, and linearity. Unfortunately, PMTs do not discriminate between multiplying the signal and the noise and thus multiply the uncertainty due to the shot effect ([340,341], as cited by Driscoll et al. [342]). Additionally, dark current or thermal noise—the signal produced by the PMT in the absence of any signal light—is also multiplied by the dynode chain and degrades the SNR of the measurements.
When selecting a PMT, it is important to consider the quantum efficiency as a function of wavelength. Quantum efficiency is a ratio of the number of photons incident on the PMT that produce an electron-hole pair to the total number of incident photons. Additionally, it is important to consider the rise time of the PMT’s electronics as, during this window, any detection of additional photons is censored [342,343].
We have found that the H7422P (Hamamatsu, Bridgewater, New Jersey, USA) is an well -suited detector for MPLSM due to its broad spectral response, fast rise time, high quantum efficiency, and large detection area. Hamamatsu PMTs that are designated with a P are vetted for higher quantum efficiencies.
Besides the PMT, avalanche photodiodes (APD) are another single-element detector with high sensitivity. However, they can be more difficult to implement due to a small detection area, usually about 1 mm diameter, and comparatively long quenching times. When deciding whether to use an APD or a PMT, on account of the APD’s sensitivity, one must weigh the gains from sensitivity with the potential loss from reduced concentration of light on the detection surface. Also, one must consider the desired image acquisition rate as APD quenching times generally cause a sizable increase in this rate [336,337,339].
An exciting and relatively new detector is the Hybrid PMT (HPD), which combines PMT and APD technologies. This detector’s unique feature is its ability to distinguish between single and multiphoton detection events with reliable fidelity and potentially helps prevent the obstacle of photon pile-up in single photon counting [337,343].
8.2. Photon Counting or Analog Integration
With the aforementioned low-light levels, the discrete nature of photons is apparent as shot noise, which degrades the SNR of the measurements (Fig. 57 presents one example of shot noise). At this point, it is necessary to consider whether a photon-counting design or an analog-integration design will be more advantageous for improving the SNR. Count rates of the order of 108 photons/s would require an equally fast, if not faster (~100 MHz), analog-to-digital converter in order to digitize and quantify the signal from discrete photons. High-speed and inexpensive electronics such as field-programmable gate arrays (FPGAs) and high-speed complex programmable logic devices (CPLDs), make implementing a photon-counting system an attractive and cost-effective option for imaging [82,344,345]. Additionally, these electronics allow for specialized photon-counting techniques, such as spectral photon counting [345] and differential multiphoton microscopy via a temporally multiplexed beam [179,262,286,287]. Besides multiphoton microscopy, photon-counting techniques have been developed for time-correlated single photon counting (TCSPC), which, in turn, has been used for fluorescence lifetime imaging microscopy (FLIM), whereby image contrast is provided by discriminating between fluorophores’ emission decay [346–353].
Figure 57.
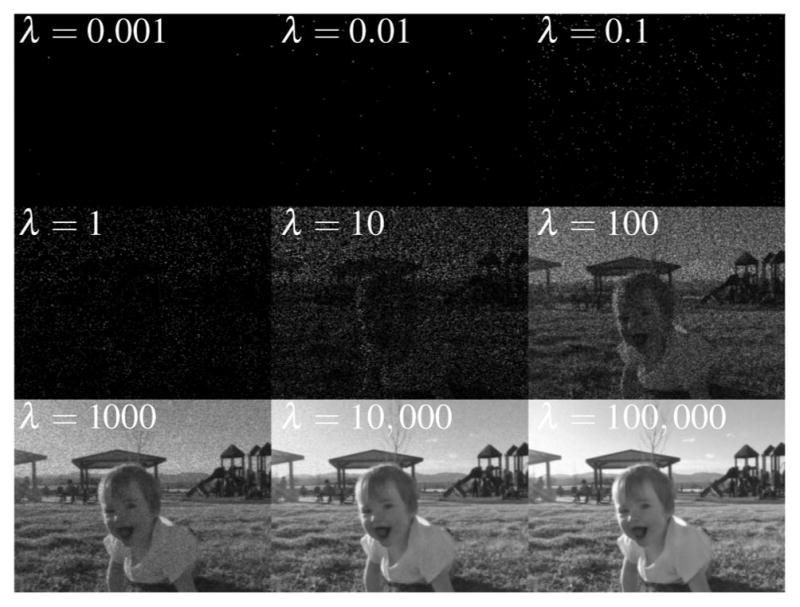
Successive images progressing from extremely low light levels that demonstrate the effect of shot noise on image quality, where λ is the average number of photons per pixel.
In analog-integration measurements, the PMT’s output signal is integrated over some period of time, thus the data acquisition system will report a voltage that scales with the number of pulses. During this period, any contributions to the signal from the PMT’s dark current or other sources of noise are summed along with signal-generated photoelectrons, thus contributing to the uncertainty in the measurement. Additionally, since the PMT may generate pulses with different widths and amplitudes, not all pulses will contribute to the integrated signal equally. These uncertainties are particularly noticeable at very low count rates. One does not necessarily need high-speed electronics to overcome the obstacles in analog integration. Multiplicative and dark-current noise can be removed by feeding the signal through a discriminator to remove the non-photon-generated noise and then through a high-speed, high-gain pulse amplifier such that it saturates (i.e., signal conditioning). This produces separate signal pulses that are clipped to a uniform height and thus contribute to the analog signal equally [90,136]. This method is effective as long as the signal current from the PMT is composed of clear, temporally distinct pulses and not does not approach a continuous signal. Additionally, analog integration is not suitable for DMM, as the arrival time of temporally multiplexed pulses is necessary for discrimination of different beamlets [90,343].
Photon counting is a measurement method in which the current pulses above some threshold value are assumed to be the result of a signal photon arriving at the detection surface of the PMT. Each pulse is tallied by high-speed data acquisition electronics, and the sum total is recorded. The pulses that fail to rise above this threshold value are considered the result of the PMT’s dark current (any current from the PMT that is not the result of an excited photon from the sample). The effect of using a discriminator to remove non-photon-generated signal current is to improve the SNR. Since a PMT cannot easily discriminate between one and multiple simultaneous incident photons, photon counting is advantageous as long as there is clear temporal resolution between detected signal photons. Otherwise, photon pile-up effects begin to degrade the SNR [351]. Additionally, there is some rise time associated with the detection equipment, which dictates a period where another signal photon, if incident on the PMT, would not be counted. This period where a photon would not be counted is referred to as the censored period or pulse-pair resolution. As this source of uncertainty in the measurement grows, it becomes advantageous to switch to an analog-integration measurement system [342].
For photon-counting measurements, the standard deviation of shot noise is given by the square root of the number of counts ( ). The SNR is the number of counts over this uncertainty [136,342]:
| (36) |
Equation (36) represents the Poisson limit: the minimum achievable uncertainty in a photon-detection measurement. Ideally, the shot noise would be the only contributor to the uncertainty in any photon-detection measurements. However, additional contributions to the uncertainty come from thermal noise, stray non-signal light, other dark-current sources, and noise contributions from the electronics. For a general discussion of noise sources from PMTs, see the technical manuscript on PMTs by Hamamatsu [343]. For an excellent discussion on the effects and sources of noise on the SNR, see [136,351].
So when should one should one switch from photon counting to analog integration? Driscoll et al. [342] present an excellent examination of the effect of noise on photon-counting and analog-integration statistics. Figures 2(a) and 2(b) in Driscoll et al. show a comparison of the noise levels between photon counting and analog integration at low light levels. For photon-counting systems that cannot distinguish between multiple near-simultaneous counts, Driscoll et al. present the maximum likelihood estimate (MLE)—a metric for determining when photon counting produces a better SNR than analog integration.
Additionally, Driscoll et al. include another method for accounting for simultaneous and near-simultaneous photon-detection events, in which the rise time effectively censors the electronics from counting signal photons. This correction factor increases the utility of photon counting by extending the regime in which photon counting has a better SNR than analog integration, and largely obviates the need for analog integration even for higher count rates where there is still distinct temporal resolution of the pulses.
While the above method is advantageous, it depends on a variety of factors, such as repetition rate of the laser, pixel dwell time, fluorescent lifetime of the dye, pulse-pair resolution, and taking measurements of the detection of no-photon and single-photon counts. Kim et al. [81] present a simple rule of thumb for switching between photon counting and analog integration, provided that the arrival time of photons is not required. Photon counting provides an SNR that is a factor of 3 to 5 times better than analog integration when the photon count is of the order of tens or hundreds for a 100-μs pixel dwell time. Once the photon count approaches thousands, the SNR for both methods is comparable.
9. Image Rendering
In this section we begin by discussing some issues and considerations when processing and presenting images acquired by the MPLSM system. This section is not an exhaustive treatment of image preparation, but instead is meant to provide an overview of common techniques encountered in MPLSM data processing. Other documents on image rendering can be found in [354–356].
9.1. Noise Reduction
Perhaps the most important step for image rendering is to optimize the SNR. An improved SNR can be achieved before data processing by using strategies such as pulse shaping and photon counting, as discussed in detail in Sections 4 and 8. However, some samples simply exhibit low contrast intensities despite our best efforts to maximize excitation and collection efficiencies. In particular, signals such as THG from biological tissues can be notoriously difficult to capture, as a large SNR ratio requires a high average power at the specimen. In such cases, there are several strategies for reducing the noise in the data set to expose the underlying structure of the specimen.
One of the most intuitive methods for enhancing SNR is to simply acquire multiple images of the same FOV. By collecting numerous frames of low SNR data, the stochastic (i.e., random) processes inherent in contrast measurement averages out to small values, while the low-intensity signal remains relatively constant and spatially consistent. This can drastically boost the SNR, and in some cases can bring out morphology that was not visible in a single frame. An example of this is shown in Fig. 58 for trimodal imaging (TPEF, SHG, and THG), where we compare the image from a single frame of data against the average of 25 frames. While the underlying biological structure is clearly visible in the averaged data set, the obvious issue that arises for this to work is the need for fixed specimens. This makes frame averaging ineffective for dynamic specimens.
Figure 58.
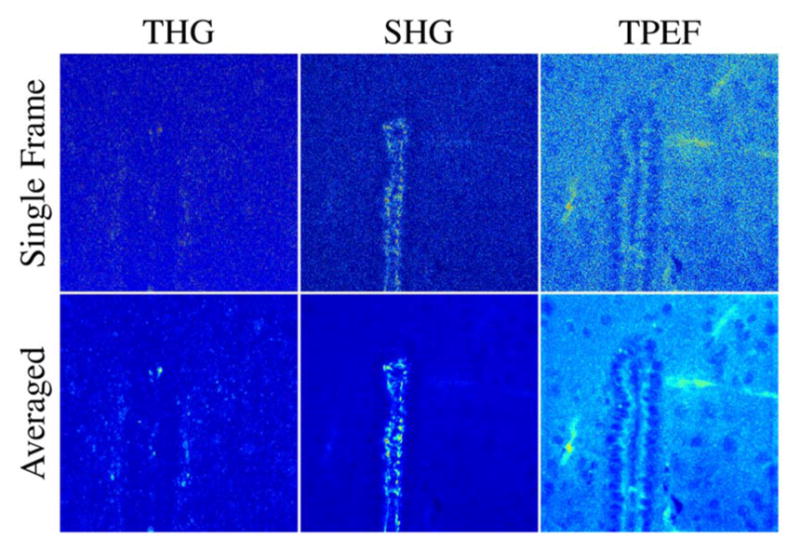
Frame averaging increases SNR in static specimens. THG, SHG, and TPEF images collected near the third ventricle of murine cortical tissue. The upper row of images show single frames captured with a 3-μs pixel dwell time. The images in the bottom row were formed by averaging 25 frames, resulting in significant SNR improvement. Each image above is 660 × 660 pixels, corresponding to a FOV of 165 μm × 165 μm.
So how does one improve the SNR in dynamic specimens when only a single frame of data is available?
One method for reducing noise in dynamic specimens is singular-value decomposition (SVD). While the mathematical details of SVD for a series of images acquired from a dynamic specimen is outside the scope of this manuscript, an excellent tutorial on SVD is given by Kleinfeld and Mitra [357]. Here, we simply present SVD on a single image to motivate the utility of this technique.
SVD can enhance image quality by retaining only the most significant modes of the intensity matrix that composes the image. An input matrix X (the image) is decomposed into a product of matrices defined by
| (37) |
where U is an m × m matrix, S is an m × n matrix, and V is an n × n matrix, and the symbol * indicates the conjugate transpose of the matrix. S is a diagonal matrix containing the singular values of X , while U and V are the left-singular and right-singular vectors, respectively.
The advantage of decomposing X , the image, into this form is that the singular-value matrix, S, contains along its diagonal the weight of each singular vector in the image. We can think of the original image as a summation of the individual modes defined by the product of the left-singular and right-singular vectors. The value of S that corresponds to the matrix formed by the outer product of the singular vectors carries the weight of each mode. What we are doing here is decomposing a single image into a summation of images whose weights are defined by the diagonal values of S. The modes with the largest weights are significant to the rendering of X , while the modes with smaller value modes correspond to noise. With an SVD of a given image, one can then omit from the reconstruction modes with weights below a certain threshold in order to reduce noise in the final image.
An example of SVD noise reduction is shown in Fig. 59, where we have retained only the most significant modes of the image. The fast fluctuations in the original image, which result from the higher order modes, are removed without sacrificing the spatial resolution of the image.
Figure 59.
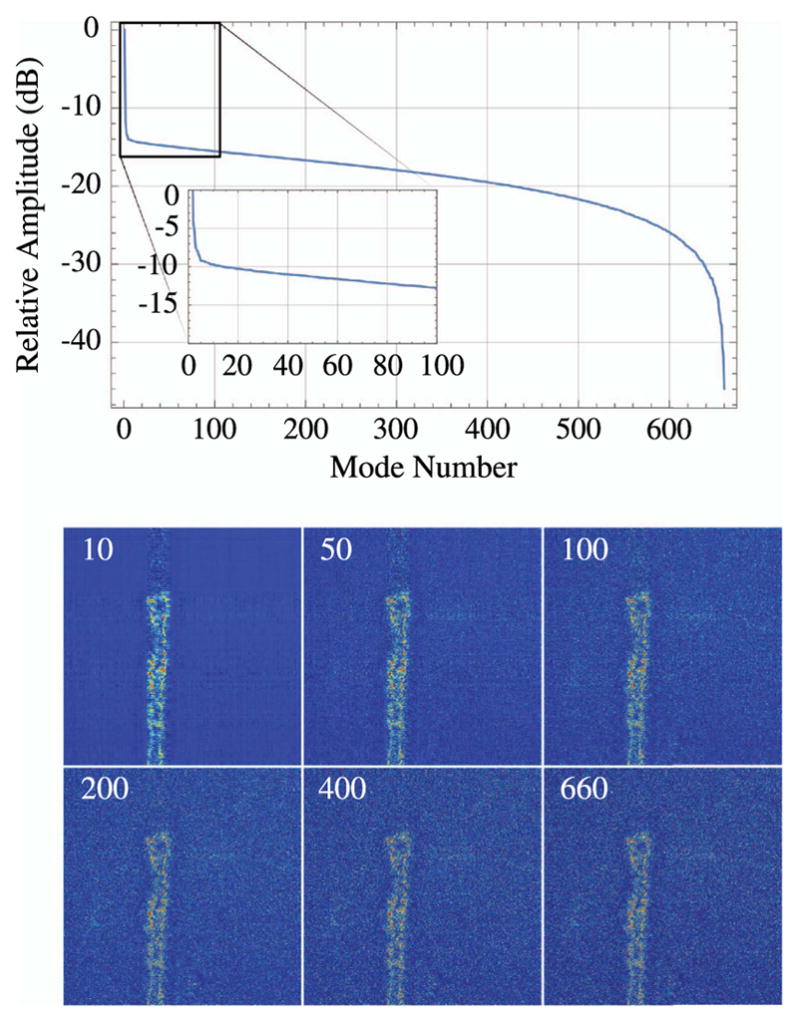
Noise reduction by singular value decomposition. The uppermost plot displays the normalized amplitude of the SVD modes for a single frame of the SHG image shown in Fig. 58 The inset is a zoom in of the first 100-mode amplitudes. All other images are reconstructions with the number of retained modes indicated by the number in the upper left corner. Note that, for the final image with 660 modes, equivalent to the number of pixels per side, the reconstructed image is identical to that of the measured image.
A more sophisticated approach to this problem is to utilize Slepian analysis to form averages. Though we do not show an example of that processing here, an excellent tutorial on that and other noise reduction techniques, including SVD, can be found in the literature [357–360].
9.2. Spectral Unmixing of Multiple Channels
Multiphoton microscopes are often multimodal, generating and collecting image contrast by several mechanisms simultaneously. In some cases, this is as simple as collecting harmonic generation as well as a single fluorescence channel. Often, multiple fluorescent labels are used to investigate varied cell populations simultaneously. In other cases, only a single contrast mechanism is desired, but other endogenous contrast mechanisms generate image contrast, as well. Whatever the reason, one frequently encounters the case in multiphoton imaging where data that should belong to a detection channel bleeds through to another channel. This is often the result of the long tail on fluorescence emission spectra, and can cause erroneous image representation. In other cases, such as imaging Brainbow tissues, spectral crosstalk is desired, and calibration is critical for a correct mapping of fluorophore expression [361]. Fortunately, spectral unmixing can be relatively straightforward to apply with simple mathematical analysis. There are many sophisticated tools for spectral unmixing, which include the use of optimization algorithms; however, we focus on a simple mathematical approach to spectral unmixing that is adequate for many applications. A more exhaustive introduction and dissertation on spectral unmixing may be found in [362–366].
Let us assume a multimodal imaging system configured to collect fluorescence from three channels, which we will label as (R, G, B) for red, green, and blue. Let us further assume that there is crosstalk between the channels, and that we know enough about the fluorophores and collection optics to determine the weights of each fluorophore in each channel, (i.e., the percentage of the total signal in each channel that is due to each contrast mechanism). We can then represent the collected images as a linear combination of the true response of each fluorophore with appropriate weighting. Writing these linear combinations in matrix form, we arrive at the following expression for our imaging system:
| (38) |
where (Rm, Gm, Bm) are the images measured in each channel, (R, G, B) are the unmixed fluorophore intensities, and wA,B is the weight of signal A in channel B. From Eq. (38), it is clear that an ideal imaging system with no spectral mixing has an identity matrix for the weights.
When there is crosstalk, the off-axis elements of the weighting matrix are nonzero, and the problem of spectral unmixing amounts to solving Eq. (38) for (R, G, B). This clearly requires knowledge of the weighting factors for each channel. In practice, it is good to directly measure the spectral throughput of each detector channel with a well-calibrated spectrometer. However, in principle, it is possible to determine the weighting factors in Eq. (38) to a reasonable degree without laboratory measurements.
For both fluorophores and optical filters, it is possible to obtain data from the manufacturer that allow for the relative amounts of signal in each channel to be calculated. Putting these measurements together, one can calculate the spectrum from each contrast mechanism that is incident on each detector. The weighting coefficients are calculated by integrating the spectra for each channel.
Let us examine a simple theoretical example of linear spectral unmixing. Consider an imaging system in which two fluorophores, YFP and TagRFP, are to be imaged simultaneously in two different detection channels. To isolate the signal from each fluorophore, bandpass filters are placed before each detector to reject unwanted fluorescence. For the YFP channel, we have selected a filter with a central wavelength of 531-nm and a 22-nm bandwidth, while for the TagRFP channel we have selected a filter centered at 593 nm with a 40-nm bandwidth (see Fig. 60).
Figure 60.
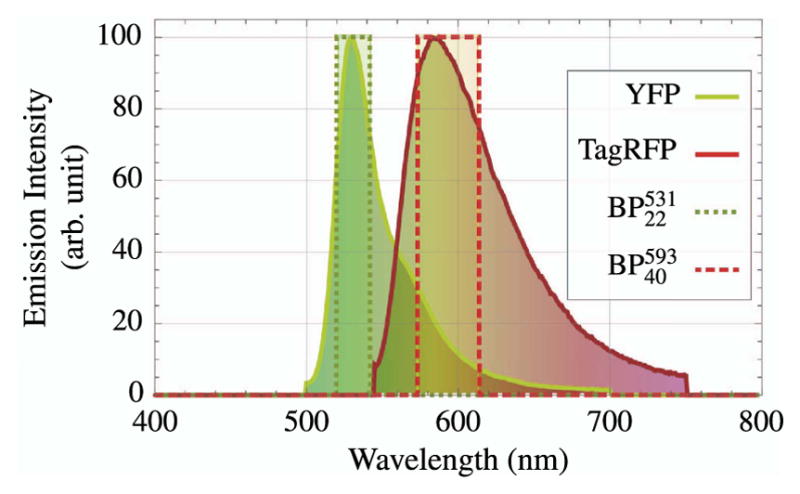
Emission spectra of YFP and TagRFP with two bandpass filters (BP). The bandpass filters are labeled .
First, we determine if there is any crosstalk between the two channels. This can be done by careful measurements of the spectral content that passes each detection channel, along with measurements of the fluorophore spectra. However, a simpler method that is typically sufficient is to utilize an online tool, such as the Fluorescence SpectraViewer [367] (LifeTechnologies, Grand Island, New York, USA), which will compute the percentage of total emission that enters each detector. These percentages then represent the weights of each fluorophore in each channel, wA,B. Using this online tool, we find that there is no light from the TagRFP fluorophore entering the YFP channel, and that the TagRFP channel will be contaminated by a portion of the YFP fluorescence. This allows for the linear unmixing equation to be written as
| (39) |
By solving this equation, we find that the unmixed TagRFP image is
| (40) |
Equation (40) demonstrates that the unmixed TagRFP image is the measured image in the TagRFP channel, minus a weighted version of the image measured in the YFP channel. To correct our data, we simply need to manipulate the TagRFP image to remove the crosstalk. This process becomes progressively more complex with additional fluorophores.
9.3. Field-of-View Efficiency Correction
Another issue that arises when processing images for presentation is the variation in efficiency across the image. This efficiency can arise from excitation characteristics, as seen previously in Section 4, or from the collection optics. Whether the efficiency is due to the excitation or collection, it is useful, and in some cases critical, to compensate the falloff of efficiency numerically in postprocessing. Much like spectral unmixing, a simple set of images representing the collection efficiency can be used to correct multiple data sets, assuming consistent operation of the microscope. In practice, it is a good idea to measure the FOV efficiency prior to each imaging session, as variations in pulse duration, laser power, and alignment all affect the efficiency of collection.
The goal is to collect an image for a homogeneous specimen (e.g., a bath or cell of fluorescent dye works well) to obtain a mapping of the relative collection efficiency across the FOV. This mapping is then used to numerically account for the inhomogeneous collection efficiency, resulting in more uniform data sets.
This procedure is particularly useful for mosaic imaging, in which multiple images of a specimen are collected by scanning an FOV for varied positions of the specimen. By stitching these images together, one can obtain an image with an FOV larger than that of the microscope [361].
An example of image correction in mosaic imaging is shown in Fig. 61.
Figure 61.
FOV efficiency correction in mosaic imaging of fixed murine cortical tissue labeled with YFP. The upper panel shows images that have not been corrected for the nonuniform FOV efficiency, which is evident in the repetitive pattern seen in each panel, despite the changing morphology. The lower image shows the image corrected for FOV efficiency. The FOV efficiency map was computed by taking the median value of each pixel from the set of mosaic panels.
One issue with this procedure is that, by correcting for areas of low response, the noise is multiplied along with the signal. Thus it is good practice to apply some of the noise reduction techniques discussed above prior to normalizing the FOV response.
10. Step-by-Step Microscope Construction
This section provides a step-by-step guide to constructing a MPLSM platform.
10.1. Microscope Construction
Creating a functional, flexible, multiphoton microscope does not have to be a costly or time-consuming endeavor. In this section, a step-by-step photo guide, along with a complete parts list for a home-built multiphoton microscope, is presented. This system has the advantage in that the user can modify the system accordingly to meet experimental expectations; the experiment does not have to be modified to meet microscope limitations. This simple system can be readily constructed in an afternoon. The majority of parts were purchased from Thorlabs (Thorlabs Inc., Newton, New Jersey, USA) however, many of these parts are interchangeable with analogous parts from other vendors.
The system is constructed horizontally, on a 36″ × 12″ breadboard. Start by arranging four -3″-high pedestals (1/4-20), as shown in Fig. 62. Use the holes on the breadboard as a grid to determine the relative placement of all parts. The pedestals are anchored in place using set screws.
Figure 62.
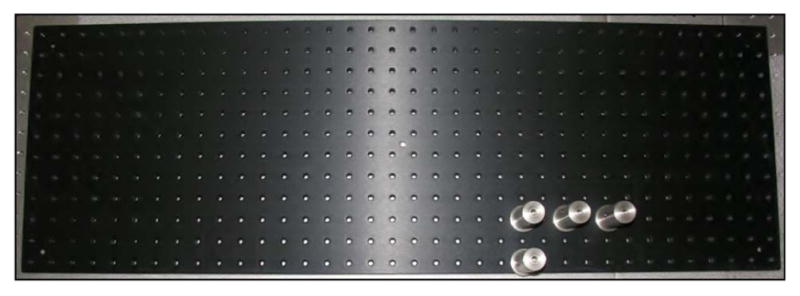
Step 1. Using the 36″ × 12″ breadboard, lay out four 3″ pedestals.
These pedestals support an angle bracket (AP90RL; see Fig. 63). The angle bracket will ultimately be used to connect to a scanning stage that holds the specimen to be imaged.
Figure 63.
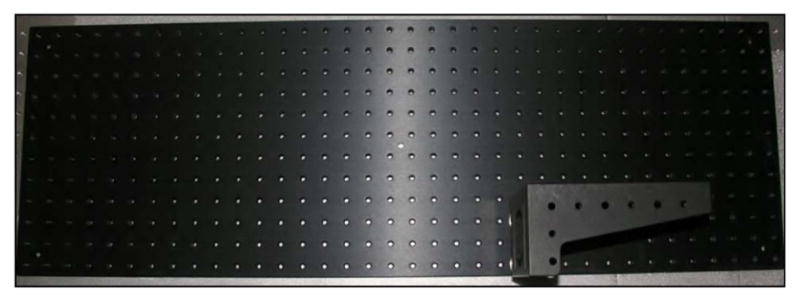
Step 2. Add the large angle bracket.
Next add two high 1″ (8–32) pedestals (see Fig. 64). These will be used to support the caged optical system, which will couple light back from the objective, off of a suitably reflective dichroic, to a detector, or this pathway can be used to deliver light, from a fiber lamp (e.g., to illuminate the specimen).
Figure 64.
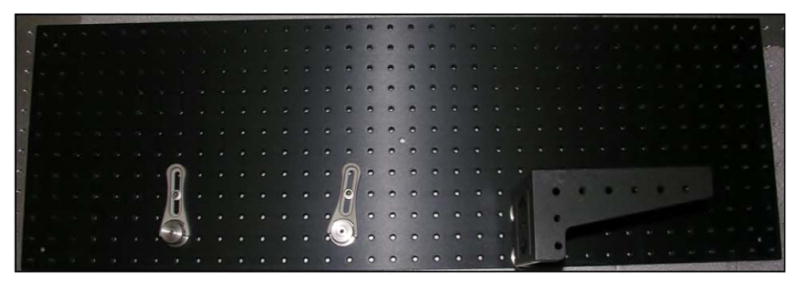
Step 3. 1″-high 8–32 pedestals and clamps are added.
Using four 12″ rods (ER12), three 30-mm cage connector plates (CP08), and one right-angle kinematic mirror mount (KCB1), construct and mount the caged system shown in Fig 65.
Figure 65.
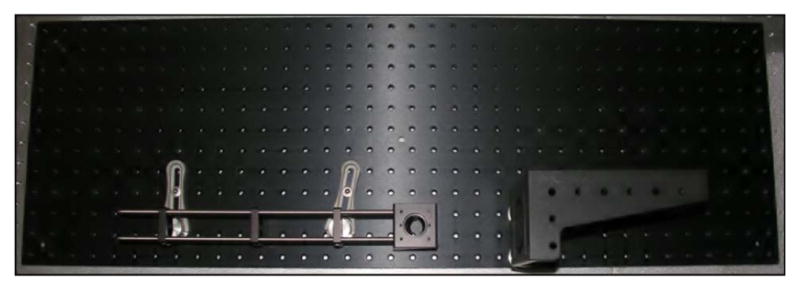
Step 4. First caged system added to pedestal assembly.
Next position a combination of four 1″ (8–32) pedestals stacked on four 3″ (8–32) pedestals and clamps, as shown in Fig. 66.
Figure 66.
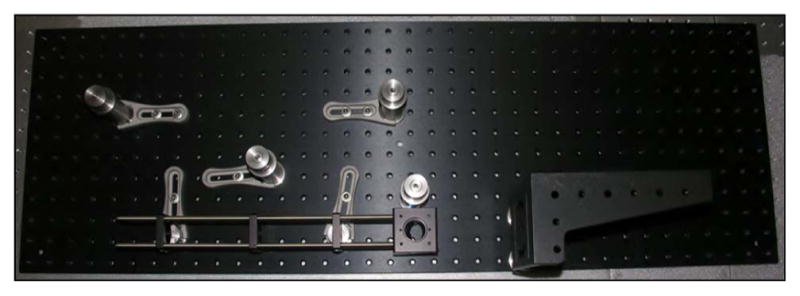
Step 5. Four pedestals with clamps added to host the next level of caged optics.
Complete the layout by adding four 1.5″ (8–32) high pedestals to the edge of the breadboard (see Fig. 67). These pedestals will support the caged optics that will route in the excitation beam.
Figure 67.
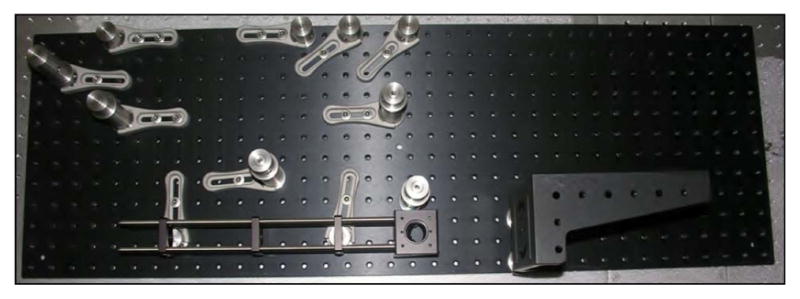
Step 6. Four 1.5″-high pedestals added along the edge of breadboard and secured by clamps.
Next, use a combination of four 12″ rods and four 4″ rods with four ERSCA connectors to create and mount the caged arm assembly shown in Fig. 68.
Figure 68.
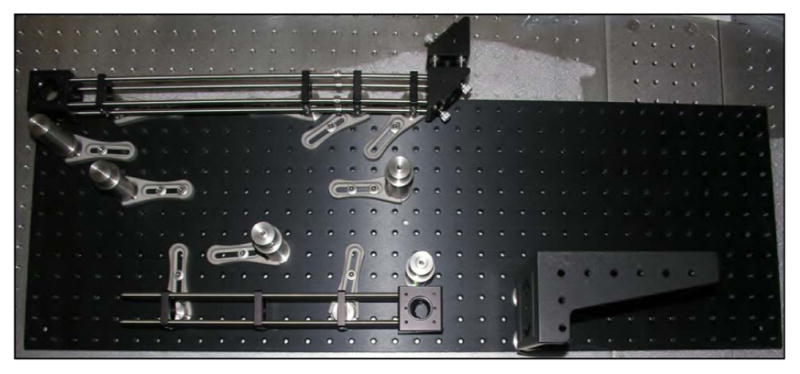
Step 7. Caged assembly for excitation beam. Uses four 30-mm cage connector plates (CP08), four 12″ rods, four 4″ rods (joined by four ERSCA connectors), and three right-angle kinematic mirror mounts (KCB1). The two end kinematic mirror mounts are joined using four ERSCA connectors and four 0.5″ rods.
Extend the caged system to the 4″-high pedestal system. The scan mirror system will ultimately be placed at the output of the completed arm. Mount another right-angle kinematic mirror using four 2″ rods and one 30 mm cage plate (CP08) in a single assembly, which is placed atop the pedestal adjacent to the caged assembly, as shown in Fig. 69.
Figure 69.
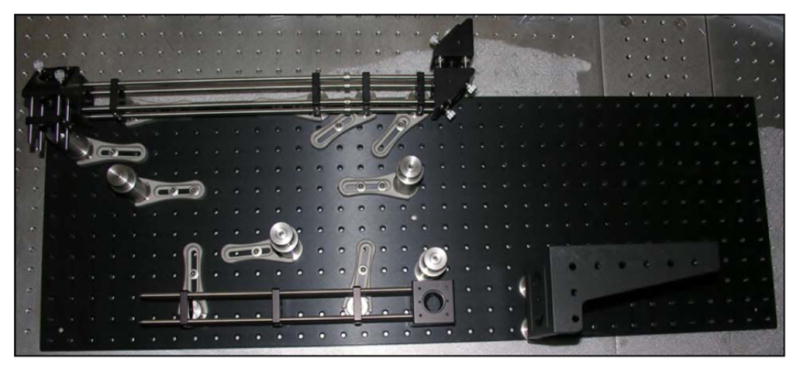
Step 8. Third caged optical system added and secured to pedestal (upper left in image). Caged kinematic mirror mount, four 2″ rods, and one 30-mm cage plate (CP08).
Next, a caged assembly through the middle of the breadboard is added. Start with a caged right-angle mirror mount and couple this to the 30-mm kinematic mirror mount (DFM-PO1) through four 1″ rods and four ERCSA connectors. A 30-mm cage plate (CP08) is slipped between the right-angle mirror mount and the kinematic mirror mount. The kinematic mirror mount is then coupled to the 30-mm dichroic mount (CM1-DCH) through four more 1″ rods and four more ERCSA connectors. Add four 3″ rods with a 30-mm caged plate (CP08) after the dichroic. The caged plates are used to anchor to pedestals. Another 1″ pedestal plus a 3″ pedestal must be added to mount the second 30-mm cage plate. Only the clamp for the newly added pedestal is visible in Fig. 70. Finally, a 60-mm cage plate (LCP01) is secured to the pedestal that is above the dichroic assembly.
Figure 70.
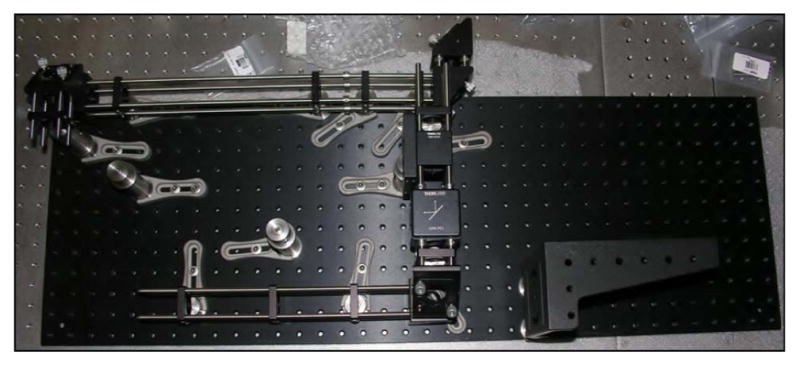
Step 9. The center caged assembly is constructed. The dichroic mount and kinematic mirror assembly are visible in the center of the photograph.
Mount the second 60-mm cage plate (LCP01) as shown in Fig. 71, and tie these two large plates with four 18″ rods (see Fig. 71).
Figure 71.
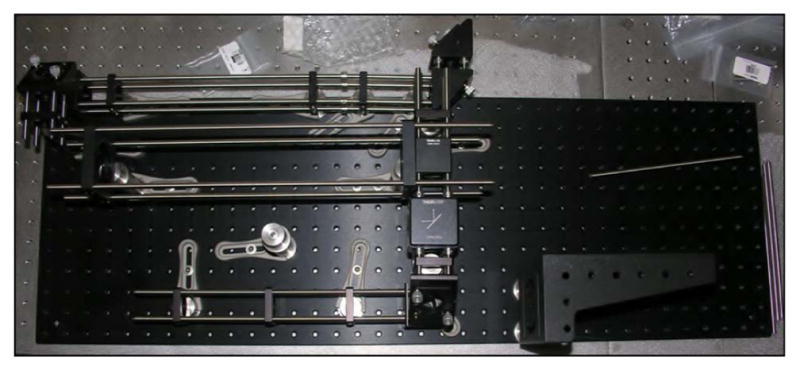
Step 10. The second 60-mm cage plate (LCP01) is mounted, and the two 60-mm cage plates are secured through four 18″ rods.
Next extend a cage assembly from the 30-mm kinematic mirror mount (DFM-PO1) using one 30-mm cage plate (CP08) and four 8″ rods (see Fig. 72).
Figure 72.
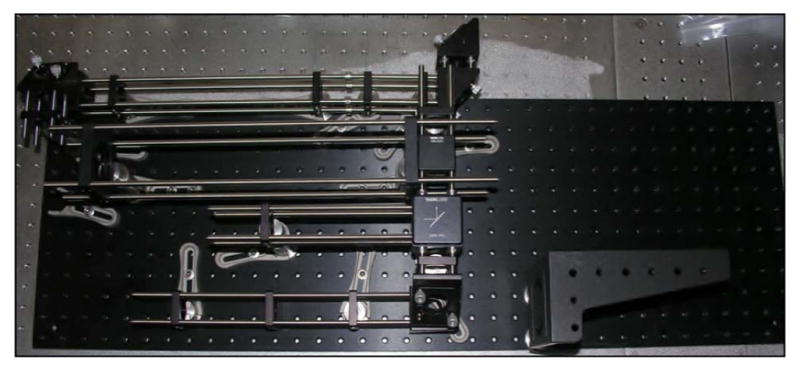
Step 11. The caged assembly is added to the kinematic mirror mount and secured to the remaining free pedestal. Note that a pedestal clamp has been added at top left next to the 60-mm cage plate. This is used to hold the scan mirrors, which are held by a 4″ pedestal.
At the bottom of the breadboard add the two angle brackets (VB01; see Fig. 73). These will help secure the microscope in its upright position.
Figure 73.
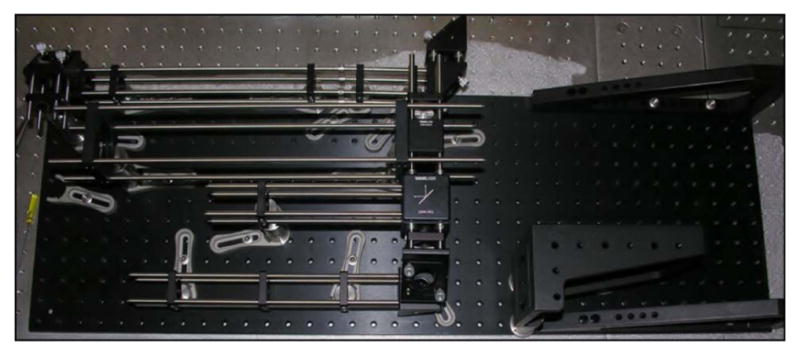
Step 12.
In the next step, we have added a specimen scanning stage (Applied Scientific Instrumentation (ASI), Eugene, Oregon, USA) secured with another right-angle bracket (see Fig. 74). In general, we buy these scanning stages from eBay for a fraction of the original cost. Modify or design a specimen stage as appropriate for your application.
Figure 74.
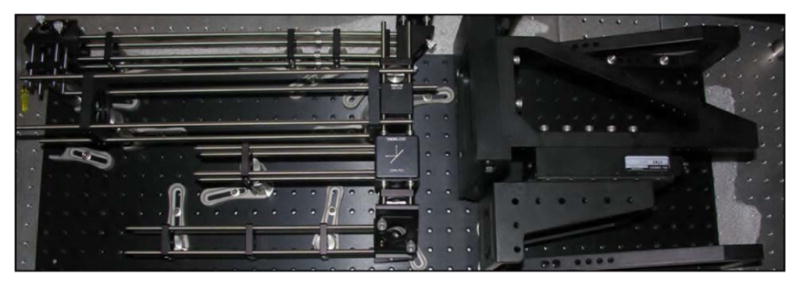
Step 13. Addition of a specimen scanning stage.
Next, build two separate angular bracket structures, as shown in the Fig. 75. Each one uses an angle bracket (VB01), two 3″ pedestals (RS3P) and four 9″ rails (XE25L09).
Figure 75.
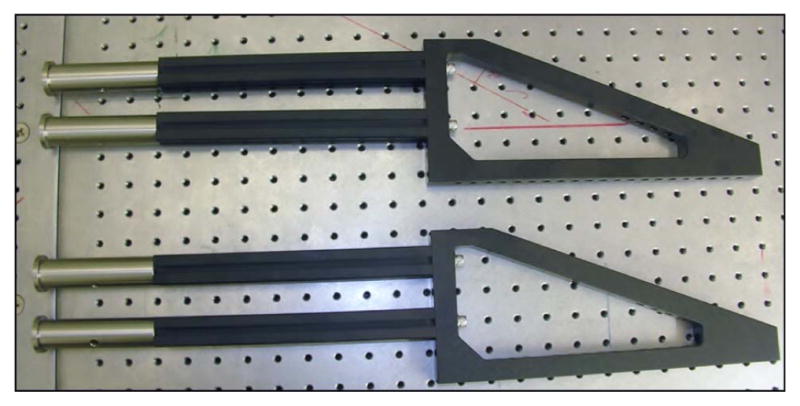
Step 14. These are the back bracket assemblies.
Push the system upright and add the brackets created in step 14 (see Fig. 76) to the back of the assembly.
Figure 76.
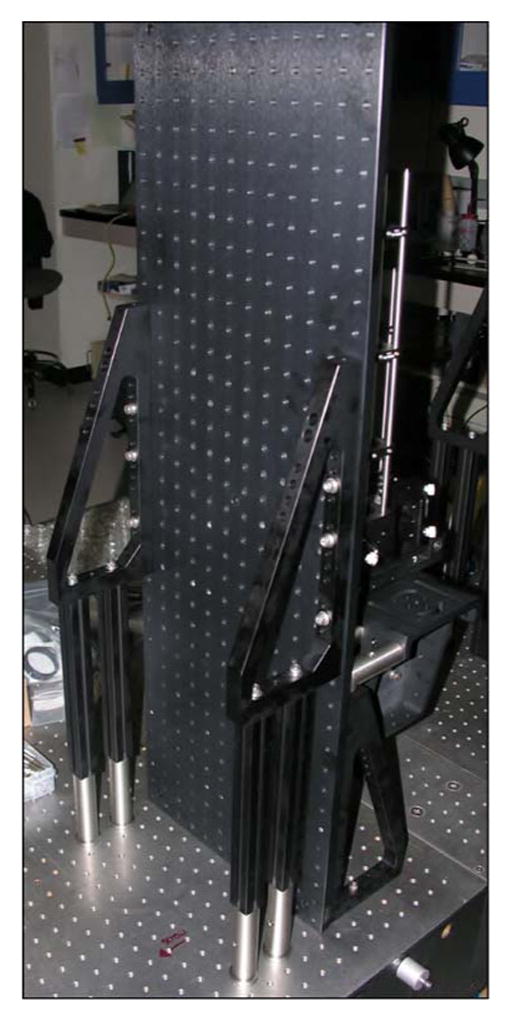
Step 15.
Mechanically the system is complete. Figure 77 shows the microscope erected upright.
Figure 77.
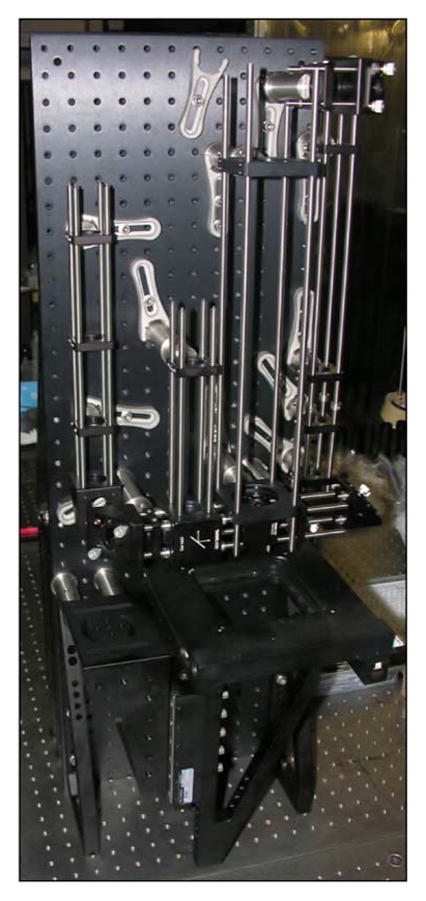
Step 16. Completed mechanical assembly.
The scan lenses (LSM05-BB) are attached to the 60-mm cage plates and the scan mirrors are mounted in the final step (see Fig. 78).
Figure 78.
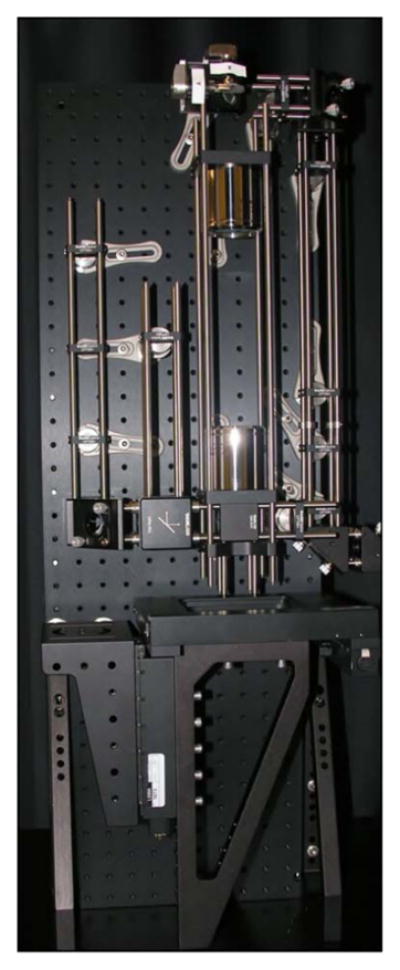
Step 17. Scan optics and scan mirrors added.
The final parts list (see Table 9) includes the components necessary to create a complete enclosure, as well as beam tubes for making the system light tight (see Fig. 79). The smaller breadboard (MB1218) is mounted on the top of the enclosure to hold the scan-mirror electronics (partially visible in Figs. 79 and 80). There are additional parts in the final list that we have found useful in general for creating external guides for the excitation beam and/or additional light baffles. Both data collection and scan-mirror control were handled with a PCI data acquisition card (NI PCI-6115, National Instruments Corporation, Austin, Texas, USA) in conjunction with a modified version of MPScope [368–370]. The NI PCI-6115 has two 12-bit analog outputs capable of controlling the analog mirror drivers (673 Servo Driver; Cambridge Technology, Inc., Bedford, Massachusetts). We have used both the 6210H and 6215H scan-mirrors with mirrors designed for a 6-mm entrance and exit aperture. When selecting scan mirrors and galvos it is important to consider many parameters, such as geometry, maximum laser power, coating, weight and moment of inertia, speed, resolution and stability over time, and temperature.
Table 9.
Microscope Parts List
| Part | Quantity | Vendor | Part No. |
|---|---|---|---|
| 12″ × 18″ breadboard | 1 | Thorlabs | MB1218 |
| 36″ × 12″ breadboard | 1 | Thorlabs | MB1236 |
| angle bracket | 5 | Thorlabs | VB01 |
| Caged kinematic mirror mount | 8 | Thorlabs | KCB1 |
| 0.5″ , 8–32 pedestal | 5 | Thorlabs | RS05P8E |
| 1″ , 8–32 pedestal | 7 | Thorlabs | RS1P8E |
| 1.5″ , 8–32 pedestal | 11 | Thorlabs | RS15P8E |
| 2″ , 8–32 pedestal | 6 | Thorlabs | RS2P8E |
| 3″ , 8–32 pedestal | 6 | Thorlabs | RS3P8E |
| 3″ , 1/4–20 pedestal | 4 | Thorlabs | RS3P |
| 4″ , 1/4–20 pedestal | 4 | Thorlabs | RS4P |
| Pedestal clamps | 16 | Thorlabs | CF175 |
| 30-mm cage plates | 16 | Thorlabs | CP08 |
| 60-mm cage plates | 2 | Thorlabs | LCP01 |
| 30-mm dichroic mounts | 3 | Thorlabs | CM1-DCH |
| 30-mm kinematic mirror | 1 | Thorlabs | DFM-P01 |
| Cage cube connector plates | 2 | Thorlabs | CM1-CC |
| 0.5″ lens tubes | 16 | Thorlabs | SM1L05 |
| 1″ lens tubes | 12 | Thorlabs | SM1L10 |
| 3″ lens tubes | 10 | Thorlabs | SM1L30 |
| ERSCA connectors | 16 | Thorlabs | ERSCA |
| 0.25″ rods | 8 | Thorlabs | ER025 |
| 0.5″ rods | 8 | Thorlabs | ER05 |
| 1″ rods | 16 | Thorlabs | ER1 |
| 2″ rods | 8 | Thorlabs | ER2 |
| 3″ rods | 4 | Thorlabs | ER3 |
| 4″ rods | 4 | Thorlabs | ER4 |
| 6″ rods | 4 | Thorlabs | ER6 |
| 8″ rods | 4 | Thorlabs | ER8 |
| 10″ rods | 4 | Thorlabs | ER10 |
| 12″ rods | 8 | Thorlabs | ER12 |
| 18″ rods | 12 | Thorlabs | ER18 |
| sm1 to RMS adapters | 5 | Thorlabs | RMSA3 |
| sm2 to sm1 adapters | 1 | Thorlabs | SM1A2 |
| 9″ rails | 6 | Thorlabs | XE25L09 |
| 12″ rails | 2 | Thorlabs | XE25L12 |
| 15″ rails | 6 | Thorlabs | XE25L15 |
| 18″ rails | 4 | Thorlabs | XE25L18 |
| 36″ rails | 6 | Thorlabs | XE25L36 |
| Rail cubes | 16 | Thorlabs | RM1G |
| Rail clamps | 12 | Thorlabs | XE25CL2 |
| Rail hinges | 5 | Thorlabs | XE25H |
| LSM05-BB | 2 | Thorlabs | LSM05-BB |
| Polarizing beam splitter, PBS103 | 1 | Thorlabs | PBS103 |
| Large angle bracket | 1 | Thorlabs | AP90RL |
| XY, Z Stage | 1 | ASI | MS-2000 |
| PMTs | Varies | Hamamatsu | H7422P-40 |
| DAQ card | 1 | National Instruments | NI PCI-6115 |
| Scan-mirror galvos | 2 | Cambridge Technology | 6210H/6215H |
| Mirror driver | 1 | Cambridge Technology | 673 Servo Driver |
Figure 79.
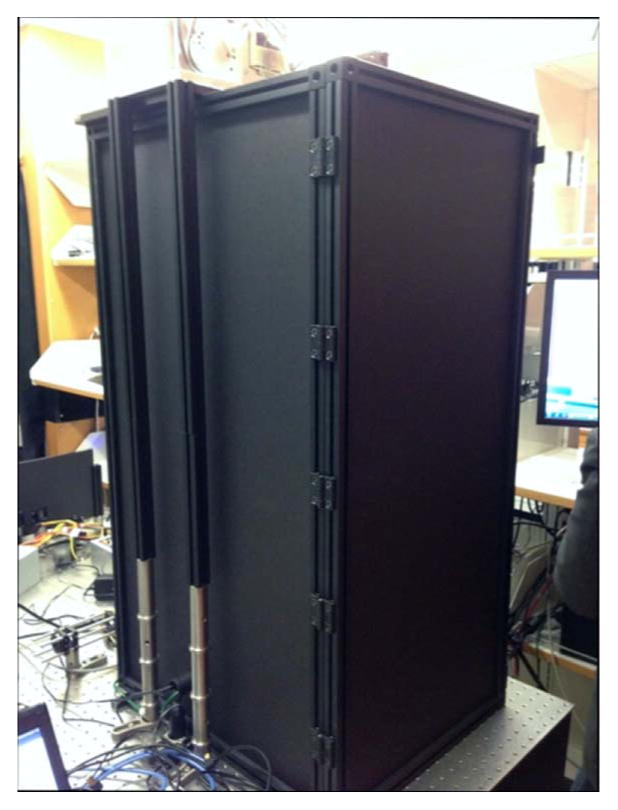
Microscope fully enclosed. The 12″ × 18″ breadboard (MB1218) is mounted on top of the enclosure to support the scan mirror electronics. The supports visible on the side have been added to secure this breadboard.
Figure 80.
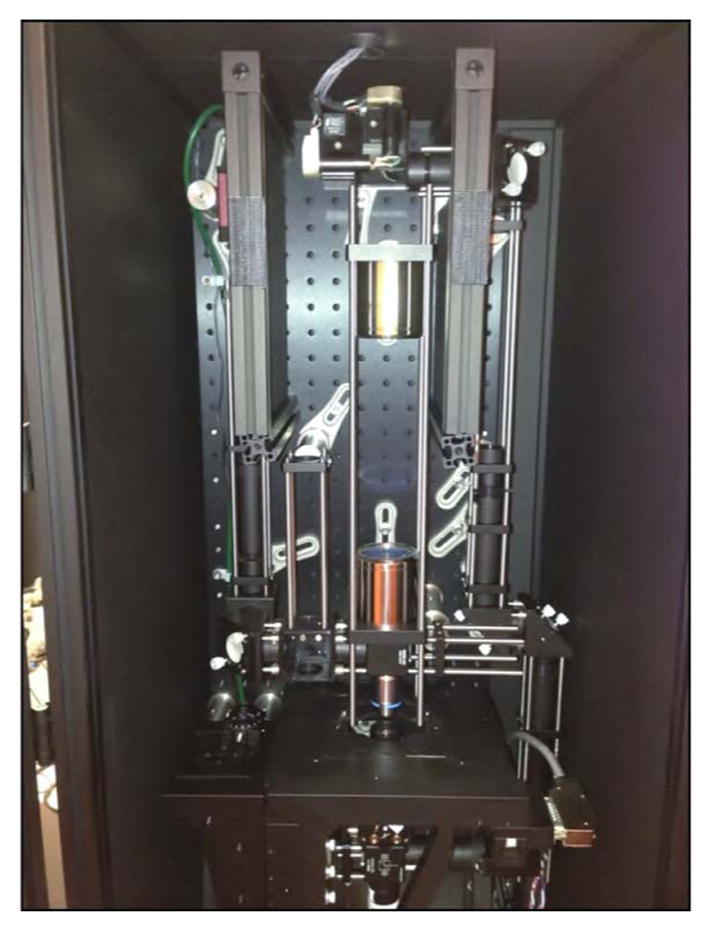
Inside view of the enclosure with a fully functional microscope. PMTs (beneath the stage) and a white-light camera (red module in upper left of image) have been installed. The beam tubes and additional baffles are visible.
11. Discussion
We have provided an example for the development and construction of highly efficient nonimaging collection optic (COHNA) and a home-built wide-FOV MPLSM. The two latter developments provide an increased means for efficient mosaic imaging. Both COHNA and the custom MPLSM provide a greater FOV, while COHNA also allows for an improved SNR. In addition, with each section, a review of relevant texts, articles, handbooks, etc., is also provided.
While this is not the first demonstration of a home-built MPLSM [1,18,52,150,262,287,371], this is, to the best of our knowledge, the first guide that addresses the breadth of aspects discussed in this paper at this depth. Most important, besides providing a guide to the construction of the microscope, this paper presents many nuanced aspects of the design process for MPLSM that are important for consideration.
12. Conclusion
We have presented a comprehensive guide for the construction of a home-built MPLSM. Not only does building your own microscope provide increased flexibility for customization and adaptability, but it also provides a solid understanding of the principles behind MPM. We have discussed the construction of the MPLSM including: Section 2, a brief history of microscopy that led to MPM; Section 3, selection of an ultrashort laser pulse source; Section 4, the effects and how to measure temporal dispersion; Section 5, design of the scan system and image relay system; Section 6, the characteristics of and how to select an objective lens; Section 7, the collection of excited light; Section 8, photon counting detection; Section 9, image rendering; and Section 10, step-by-step microscope production.
Our hope is that this guide will allow for a reduced cost of entry into the field of MPM and allow for the acquisition of MPLSM systems in laboratory environments where it was not present before. In addition to the topics covered in this paper, there are other topics of merit with regards to MPM. Adaptive optics allow for shaping of the beam both spatially and temporally. Spatial beam shaping can compensate for aberrations of the wavefront [372–378], while temporal pulse shaping [205–207,218,231,233,379] can allow for pulse shapes that more effectively interact with fluorophores. Besides MPM, there is also differential multiphoton microscopy, in which multiple beamlets may be used in the simultaneous acquisition of images at different lateral positions, depths, polarizations, etc. [82,262,278,287].
Regardless, the microscope presented here provides a valuable and robust platform for MPLSM.
Acknowledgments
This work was funded by the National Institute of Biomedical Imaging and Bioengineering under the Bioengineering Research Partnership EB003832. We acknowledge Yves Bellouard for supplying the specimens in Figs. 53–56, help in identifying the features with these specimens, and the annotation of Fig. 56. Jeffrey Field and Randy Bartels thank Stu Tobert for the generous donation of the murine tissue samples in Figs. 21, 58, and 59. The authors thank the reviewers for their time, helpful suggestions, and recommendations.
Biographies

Michael D. Young received the B.Sc. degree in Engineering Physics and the Ph.D. degree in Applied Physics from the Colorado School of Mines, Golden. His interests interests include, mulitfocal multiphoton microscopy, geometric and computer-aided optical design, single-element detection with laser microscopy, and physics pedagogy.

Jeffrey J. Field received both the B.Sc. and M.Sc. degrees in Engineering Physics and the Ph.D. degree in Applied Physics from the Colorado School of Mines, Golden. Dr. Field is a member of The Optical Society (OSA) and SPIE.

Kraig E. Sheetz received the B.Sc. degree in Geophysics and his Commission in the United States Army from Millersville University, Millersville, in 1990. He received the M.Sc. degree in Geophysics from New Mexico Tech, Socorro, in 1992 and the M.Sc. degree in Physics from the Naval Postgraduate School, Monterey, California, in 2000. He received the Ph.D. degree in Applied Physics from the Colorado School of Mines, Golden, in 2009. His Ph.D. dissertation research was on the development of femtosecond-laser-based nonlinear microscopy systems. He is an active duty Army Officer who has been an Academy Professor at the United States Military Academy at West Point since 2009 when he stood up and directed the Research Program and directed the Core Physics Program within the Department of Physics and Nuclear Engineering. Currently, Colonel Sheetz is serving as West Point’s Vice Dean for Resources.

Randy A. Bartels received his Ph.D. from the University of Michigan, Ann Arbor, in 2002. His Ph.D. work was conducted at JILA, Boulder, Colorado. Randy joined Colorado State University, Fort Collins, in 2003. He is a member of The Optical Society (OSA), the American Physical Society, and IEEE.

Jeff Squier received his B.Sc. degree in Engineering Physics and his M.Sc. degree in Applied Physics both from the Colorado School of Mines, Golden. He received his Ph.D. in Optics from the Institute of Optics, University of Rochester, Rochester, New York. He is presently a Professor of Physics at the Colorado School of Mines, Golden. He has authored or coauthored more than 190 papers and holds multiple patents. Dr. Squier is a member and Fellow of The Optical Society (OSA).
Footnotes
OCIS codes: (030.5260) Photon counting; (080.3620) Lens system design; (180.4315) Nonlinear microscopy; (180.5810) Scanning microscopy; (320.5520) Pulse compression; (320.7090) Ultrafast lasers
References
- 1.Mayer A, Thomas HP, Vogel H, Steitz TA, Engelman DM, Mckay DB, Steitz A, Wyman J, Changeux JP, Hardt TA, Mangel WF, Livingston C, Melhado LL, Peltz SW, Schoenbom BP, Zaccai G, Sutherland C, Desmond J, Takacs Z, Sutherland JC, Keck PC, Griffin KP, Takacs PZ, Toledo D, Denk W, Strickler J, Webb WW. Two-photon laser scanning fluorescence microscopy. Science. 1990;248:73–76. doi: 10.1126/science.2321027. [DOI] [PubMed] [Google Scholar]
- 2.So P, Kim H, Kochevar I. Two-photon deep tissue ex vivo imaging of mouse dermal and subcutaneous structures. Opt Express. 1998;3:339–350. doi: 10.1364/oe.3.000339. [DOI] [PubMed] [Google Scholar]
- 3.Buehler C, Kim KH, Dong C, Masters B, So P. Innovations in two-photon deep tissue microscopy. IEEE Eng Med Biol Mag. 1999;18(5):23–30. doi: 10.1109/51.790988. [DOI] [PubMed] [Google Scholar]
- 4.Yelin D, Silberberg Y. Laser scanning third-harmonic-generation microscopy in biology. Opt Express. 1999;5:169–175. doi: 10.1364/oe.5.000169. [DOI] [PubMed] [Google Scholar]
- 5.Beaurepaire E, Oheim M, Mertz J. Ultra-deep two-photon fluorescence excitation in turbid media. Opt Commun. 2001;188:25–29. [Google Scholar]
- 6.Helmchen F, Denk W. Deep tissue two-photon microscopy. Nat Methods. 2005;2:932–940. doi: 10.1038/nmeth818. [DOI] [PubMed] [Google Scholar]
- 7.Ntziachristos V. Going deeper than microscopy: the optical imaging frontier in biology. Nat Methods. 2010;7:603–614. doi: 10.1038/nmeth.1483. [DOI] [PubMed] [Google Scholar]
- 8.Kobat D, Horton NG, Xu C. In vivo two-photon microscopy to 1.6-mm depth in mouse cortex. J Biomed Opt. 2011;16:106014. doi: 10.1117/1.3646209. [DOI] [PubMed] [Google Scholar]
- 9.Truong TV, Supatto W, Koos DS, Choi JM, Fraser SE. Deep and fast live imaging with two-photon scanned light-sheet microscopy. Nat Methods. 2011;8:757–760. doi: 10.1038/nmeth.1652. [DOI] [PubMed] [Google Scholar]
- 10.Crosignani V, Dvornikov AS, Gratton E. Enhancement of imaging depth in turbid media using a wide area detector. J Biophotonics. 2011;4:592–599. doi: 10.1002/jbio.201100001. [DOI] [PMC free article] [PubMed] [Google Scholar]
- 11.Brakenhoff GJ, Squier J, Norris T, Bliton AC, Wade MH, Athey B. Real-time two-photon confocal microscopy using a femtosecond, amplified Ti:sapphire system. J Microsc. 1996;181:253–259. doi: 10.1046/j.1365-2818.1996.97379.x. [DOI] [PubMed] [Google Scholar]
- 12.Kim KH, Buehler C, So PTC. High-speed, two-photon scanning microscope. Appl Opt. 1999;38:6004–6009. doi: 10.1364/ao.38.006004. [DOI] [PubMed] [Google Scholar]
- 13.Zoumi A, Yeh A, Tromberg BJ. Imaging cells and extracellular matrix in vivo by using second-harmonic generation and two-photon excited fluorescence. Proc Natl Acad Sci USA. 2002;99:11014–11019. doi: 10.1073/pnas.172368799. [DOI] [PMC free article] [PubMed] [Google Scholar]
- 14.Zipfel WR, Williams RM, Christie R, Nikitin AY, Hyman BT, Webb WW. Live tissue intrinsic emission microscopy using multiphoton-excited native fluorescence and second harmonic generation. Proc Natl Acad Sci USA. 2003;100:7075–7080. doi: 10.1073/pnas.0832308100. [DOI] [PMC free article] [PubMed] [Google Scholar]
- 15.Campagnola P, Dong C-Y. Second harmonic generation microscopy: principles and applications to disease diagnosis. Laser Photon Rev. 2011;5:13–26. [Google Scholar]
- 16.Campagnola P. Second harmonic generation imaging microscopy: applications to diseases diagnostics. Anal Chem. 2011;83:3224–3231. doi: 10.1021/ac1032325. [DOI] [PMC free article] [PubMed] [Google Scholar]
- 17.Pavone FS, Campagnola PJ, editors. Second Harmonic Generation Imaging. 1. CRC Press; 2013. Series in Cellular and Clinical Imaging. [Google Scholar]
- 18.Barad Y, Eisenberg H, Horowitz M, Silberberg Y. Nonlinear scanning laser microscopy by third harmonic generation. Appl Phys Lett. 1997;70:922–924. [Google Scholar]
- 19.Oron D, Tal E, Silberberg Y. Depth-resolved multiphoton polarization microscopy by third-harmonic generation. Opt Lett. 2003;28:2315–2317. doi: 10.1364/ol.28.002315. [DOI] [PubMed] [Google Scholar]
- 20.Oron D, Yelin D, Tal E, Raz S, Fachima R, Silberberg Y. Depth-resolved structural imaging by third-harmonic generation microscopy. J Struct Biol. 2004;147:3–11. doi: 10.1016/S1047-8477(03)00125-4. [DOI] [PubMed] [Google Scholar]
- 21.Sun C-K. Second harmonic generation microscopy versus third harmonic generation microscopy in biological tissues. In: Török P, Kao F-J, editors. Optical Imaging and Microscopy: Techniques and Advanced Systems. 2. Chap. 11. Springer; 2007. pp. 291–304. [Google Scholar]
- 22.Raghunathan V, Han Y, Korth O, Ge N-H, Potma EO. Rapid vibrational imaging with sum frequency generation microscopy. Opt Lett. 2011;36:3891–3893. doi: 10.1364/OL.36.003891. [DOI] [PMC free article] [PubMed] [Google Scholar]
- 23.Segawa H, Okuno M, Kano H, Leproux P, Couderc V, Hamaguchi H-O. Label-free tetra-modal molecular imaging of living cells with CARS, SHG, THG and TSFG (coherent anti-Stokes Raman scattering, second harmonic generation, third harmonic generation and third-order sum frequency generation) Opt Express. 2012;20:9551–9557. doi: 10.1364/OE.20.009551. [DOI] [PubMed] [Google Scholar]
- 24.Fu D, Lu F, Zhang X, Freudiger C, Pernik DR, Holtom G, Xie XS. Quantitative chemical imaging with multiplex stimulated Raman scattering microscopy. J Am Chem Soc. 2012;134:3623–3626. doi: 10.1021/ja210081h. [DOI] [PMC free article] [PubMed] [Google Scholar]
- 25.Zumbusch A, Holtom G, Xie X. Three-dimensional vibrational imaging by coherent anti-Stokes Raman scattering. Phys Rev Lett. 1999;82:4142–4145. [Google Scholar]
- 26.Labarthet FL, Shen YR. Nonlinear optical microscopy. In: Török P, Kao F-J, editors. Optical Imaging and Microscopy: Techniques and Advanced Systems. 2. Chap. 9. Springer; 2007. pp. 237–268. [Google Scholar]
- 27.Yue S, Slipchenko MN, Cheng J-X. Multimodal nonlinear optical microscopy. Laser Photon Rev. 2011;5:496–512. doi: 10.1002/lpor.201000027. [DOI] [PMC free article] [PubMed] [Google Scholar]
- 28.Min W, Freudiger CW, Lu S, Xie XS. Coherent nonlinear optical imaging: beyond fluorescence microscopy. Annu Rev Phys Chem. 2011;62:507–530. doi: 10.1146/annurev.physchem.012809.103512. [DOI] [PMC free article] [PubMed] [Google Scholar]
- 29.Tong L, Cheng JX. Label-free imaging through nonlinear optical signals. Mater Today. 2011;14:264–273. [Google Scholar]
- 30.Masters BR, So PT, Gratton E. Multiphoton excitation fluorescence microscopy and spectroscopy of in vivo human skin. Biophys J. 1997;72:2405–2412. doi: 10.1016/S0006-3495(97)78886-6. [DOI] [PMC free article] [PubMed] [Google Scholar]
- 31.Bewersdorf J, Pick R, Hell SW. Multifocal multiphoton microscopy. Opt Lett. 1998;23:655–657. doi: 10.1364/ol.23.000655. [DOI] [PubMed] [Google Scholar]
- 32.Mainen ZF, Maletic-Savatic M, Shi SH, Hayashi Y, Malinow R, Svoboda K. Two-photon imaging in living brain slices. Methods. 1999;18:231–239. doi: 10.1006/meth.1999.0776. [DOI] [PubMed] [Google Scholar]
- 33.So PTC, Dong CY, Masters BR, Berland KM. Two-photon excitation fluorescence microscopy. Annu Rev Biomed Eng. 2000;2:399–429. doi: 10.1146/annurev.bioeng.2.1.399. [DOI] [PubMed] [Google Scholar]
- 34.Konig K. Multiphoton microscopy in life sciences. J Microsc. 2000;200:83–104. doi: 10.1046/j.1365-2818.2000.00738.x. [DOI] [PubMed] [Google Scholar]
- 35.Williams RM, Zipfel WR, Webb WW. Multiphoton microscopy in biological research. Curr Opin Chem Biol. 2001;5:603–608. doi: 10.1016/s1367-5931(00)00241-6. [DOI] [PubMed] [Google Scholar]
- 36.Helmchen F, Denk W. New developments in multiphoton microscopy. Curr Opin Neurobiol. 2002;12:593–601. doi: 10.1016/s0959-4388(02)00362-8. [DOI] [PubMed] [Google Scholar]
- 37.Zipfel WR, Williams RM, Webb WW. Nonlinear magic: multi-photon microscopy in the biosciences. Nat Biotechnol. 2003;21:1369–1377. doi: 10.1038/nbt899. [DOI] [PubMed] [Google Scholar]
- 38.Dunn KW, Young PA. Principles of multiphoton microscopy. Nephron Exp Nephrol. 2006;103:e33–e40. doi: 10.1159/000090614. [DOI] [PubMed] [Google Scholar]
- 39.Iyer V, Hoogland TM, Saggau P. Fast functional imaging of single neurons using random-access multiphoton (RAMP) microscopy. J Neurophysiol. 2006;95:535–545. doi: 10.1152/jn.00865.2005. [DOI] [PubMed] [Google Scholar]
- 40.Masters BR. Confocal Microscopy and Multiphoton Excitation Microscopy: The Genesis of Live Cell Imaging. SPIE; 2006. [Google Scholar]
- 41.Deniset-Besseau A, Lévêque-Fort S, Fontaine-Aupart MP, Roger G, Georges P. Three-dimensional time-resolved fluorescence imaging by multifocal multiphoton microscopy for a photosensitizer study in living cells. Appl Opt. 2007;46:8045–8051. doi: 10.1364/ao.46.008045. [DOI] [PubMed] [Google Scholar]
- 42.Göbel W, Kampa BM, Helmchen F. Imaging cellular network dynamics in three dimensions using fast 3D laser scanning. Nat Methods. 2007;4:73–79. doi: 10.1038/nmeth989. [DOI] [PubMed] [Google Scholar]
- 43.Gabel C. Femtosecond lasers in biology: nanoscale surgery with ultrafast optics. Contemp Phys. 2008;49:391–411. [Google Scholar]
- 44.Masters BR, So P, editors. Handbook of Biomedical Nonlinear Optical Microscopy. Oxford University; 2008. [Google Scholar]
- 45.Duemani Reddy G, Kelleher K, Fink R, Saggau P. Three-dimensional random access multiphoton microscopy for functional imaging of neuronal activity. Nat Neurosci. 2008;11:713–720. doi: 10.1038/nn.2116. [DOI] [PMC free article] [PubMed] [Google Scholar]
- 46.Otsu Y, Bormuth V, Wong J, Mathieu B, Dugué GP, Feltz A, Dieudonné S. Optical monitoring of neuronal activity at high frame rate with a digital random-access multiphoton (RAMP) microscope. J Neurosci Methods. 2008;173:259–270. doi: 10.1016/j.jneumeth.2008.06.015. [DOI] [PubMed] [Google Scholar]
- 47.Carriles RR, Schafer DN, Sheetz KE, Field JJ, Cisek R, Barzda V, Sylvester AW, Squier JA. Invited Review Article: Imaging techniques for harmonic and multiphoton absorption fluorescence microscopy. Rev Sci Instrum. 2009;80:081101. doi: 10.1063/1.3184828. [DOI] [PMC free article] [PubMed] [Google Scholar]
- 48.Fujimoto JG, Farkas D. Biomedical Optical Imaging. Oxford University; 2009. [Google Scholar]
- 49.Fritzky L, Lagunoff D. Advanced methods in fluorescence microscopy. J Eur Soc Anal Cellular Path. 2013;36:5–17. doi: 10.3233/ACP-120071. [DOI] [PMC free article] [PubMed] [Google Scholar]
- 50.Rehman S, Sheppard CJR. Multiphoton imaging. In: Liang R, editor. Biomedical Optical Imaging Technologies: Design and Applications. Chap. 7. Springer; 2013. pp. 233–254. [Google Scholar]
- 51.Rosenegger DG, Tran CHT, LeDue J, Zhou N, Gordon GR. A high performance, cost-effective, open-source microscope for scanning two-photon microscopy that is modular and readily adaptable. PLoS ONE. 2014;9:e110475. doi: 10.1371/journal.pone.0110475. [DOI] [PMC free article] [PubMed] [Google Scholar]
- 52.Parker I. Microscopy construction: build your own video-rate 2-photon microscope. http://parkerlab.bio.uci.edu/microscopy_construction/build_your_own_twophoton_microscope.htm, retrieved June 16, 2014.
- 53.Callamaras N, Parker I. Construction of a confocal microscope for real-time x–y and x–z imaging. Cell Calcium. 1999;26:271–279. doi: 10.1054/ceca.1999.0085. [DOI] [PubMed] [Google Scholar]
- 54.Nguyen QT, Callamaras N, Hsieh C, Parker I. Construction of a two-photon microscope for video-rate Ca2+ imaging. Cell Calcium. 2001;30:383–393. doi: 10.1054/ceca.2001.0246. [DOI] [PubMed] [Google Scholar]
- 55.Sanderson MJ, Parker I. Video-rate confocal microscopy. Methods Enzymol. 2003;360:447–481. doi: 10.1016/s0076-6879(03)60123-0. [DOI] [PubMed] [Google Scholar]
- 56.Nikolenko V, Yuste R. How to build a two-photon microscope with a confocal scan head. Cold Spring Harb Protoc. 2013;2013:588–592. doi: 10.1101/pdb.ip075135. [DOI] [PubMed] [Google Scholar]
- 57.Zemax. ZEMAX-EE. https://www.zemax.com/support/downloads/legacy-version-downloads, retrieved September 3, 2014.
- 58.Optica Software. Optica Software: optical system design software. http://www.opticasoftware.com/, retrieved January 16, 2015.
- 59.Synopsys Optical Solutions. Code V. http://optics.synopsys.com/codev/, retrieved January 16, 2015.
- 60.Photon Engineering. FRED Software. http://photonengr.com/software/, retrieved January 16, 2015.
- 61.Optenso. OpTaliX: Optical engineering software for optical design, thin-films, illumination. http://www.optenso.com/index.html, retrieved January 16, 2015.
- 62.OPTIS. OptisWorks. http://www.optis-world.com/products/software/OptisWorks.html, retrieved January 16, 2015.
- 63.lambda Research Corporation. OSLO—TracePro. http://www.lambdares.com/oslo, retrieved January 16, 2015.
- 64.Light Trans GmbH/LightTrans VirtualLab UG. LightTrans—Optical Engineering, Optics Software VirtualLab, Diffractive Optical Elements (DOE) Fabrication: VirtualLab Overview. http://www.lighttrans.com/687.html, retrieved January 16, 2015.
- 65.Singer C. Section of the history of medicine: notes on the early history of microscopy. Proc R Soc Medicine. 1914;7:247–279. doi: 10.1177/003591571400701617. [DOI] [PMC free article] [PubMed] [Google Scholar]
- 66.Meyer-Arendt JR. Optical instrumentation for the biologist: microscopy. Appl Opt. 1965;4:1–9. [Google Scholar]
- 67.Masters BR. History of the optical microscope in cell biology and medicine. eLS. doi: 10.1002/9780470015902.a0003082. [DOI] [Google Scholar]
- 68.Iizuka K. Engineering Optics. 3. Springer; 2008. [Google Scholar]
- 69.Masters BR. The development of fluorescence microscopy. eLS. doi: 10.1002/9780470015902.a0022093. [DOI] [Google Scholar]
- 70.Tkaczyk TS. Field Guide to Microscopy. SPIE; 2010. [Google Scholar]
- 71.Seward GH. Optical Design of Microscopes. SPIE; 2010. [Google Scholar]
- 72.Mertz J. Introduction to Optical Microscopy. Roberts; 2010. [Google Scholar]
- 73.Murphy DB, Davidson MW. Fundamentals of Light Microscopy and Electronic Imaging. 2. Wiley; 2012. [Google Scholar]
- 74.Boyd R. Nonlinear Optics. 3. Academic; 2008. [Google Scholar]
- 75.Denk W, Svoboda K. Photon upmanship: why multiphoton imaging is more than a gimmick. Neuron. 1997;18:351–357. doi: 10.1016/s0896-6273(00)81237-4. [DOI] [PubMed] [Google Scholar]
- 76.So P. Prospects of nonlinear microscopy in the next decade: an overview. Opt Express. 1998;3:312–314. doi: 10.1364/oe.3.000312. [DOI] [PubMed] [Google Scholar]
- 77.Benham GS, Schwartz S. Multiphoton microscopy in the biomedical sciences II. Proc SPIE. 2002;4620:36–47. [Google Scholar]
- 78.Müller M, Squier JA. Nonlinear microscopy with ultrashort pulse lasers. In: Fermann ME, Galvanauskas A, Sucha G, editors. Ultrafast Lasers: Technology and Applications. Chap. 14. Marcel Dekker; 2003. pp. 661–697. [Google Scholar]
- 79.Cheng P-C, Sun CK. Nonlinear (harmonic generation) optical microscopy. In: Pawley JB, editor. Handbook of Biological Confocal Microscopy. 3. Chap. 40. Springer; 2006. pp. 703–721. [Google Scholar]
- 80.Müller M, Brakenhoff GJ. Parametric nonlinear optical techniques in microscopy. In: Török P, Kao F-J, editors. Optical Imaging and Microscopy: Techniques and Advanced Systems. 2. Chap. 10. Springer; 2007. pp. 269–290. [Google Scholar]
- 81.Kim KH, Bahlmann K, Ragan T, Kim D, So PTC. High-speed imaging using multiphoton excitation microscopy. In: Masters BR, So PTC, editors. Handbook of Biomedical Nonlinear Optical Microscopy. Chap. 18 Oxford University; 2008. [Google Scholar]
- 82.Hoover EE, Squier JA. Advances in multiphoton microscopy technology. Nat Photonics. 2013;7:93–101. doi: 10.1038/nphoton.2012.361. [DOI] [PMC free article] [PubMed] [Google Scholar]
- 83.Powers PE. Field Guide to Nonlinear Optics. SPIE; 2013. [Google Scholar]
- 84.Backus S, Durfee CG, Murnane MM, Kapteyn HC. High power ultrafast lasers. Rev Sci Instrum. 1998;69:1207–1223. [Google Scholar]
- 85.Keller U. Recent developments in compact ultrafast lasers. Nature. 2003;424:831–838. doi: 10.1038/nature01938. [DOI] [PubMed] [Google Scholar]
- 86.Paschotta R, Keller U. Ultrafast solid-state lasers. In: Fermann ME, Galvanauskas A, Sucha G, editors. Ultrafast Lasers: Technology and Applications. Chap. 1. Marcel Dekker; 2003. pp. 1–60. [Google Scholar]
- 87.Paschotta R. Field Guide to Laser Pulse Generation. SPIE; 2008. [Google Scholar]
- 88.Sheetz KE, Squier J. Ultrafast optics: Imaging and manipulating biological systems. J Appl Phys. 2009;105:051101. [Google Scholar]
- 89.Weiner A. Ultrafast Optics. Wiley; 2011. [Google Scholar]
- 90.Hoover EE, Chandler EV, Field JJ, Vitek DN, Young MD, Squier JA. Utilising ultrafast lasers for multiphoton biomedical imaging. In: Thomson R, Leburn C, Reid D, editors. Ultrafast Nonlinear Optics. Chap. 11. Springer; 2013. pp. 251–286. [Google Scholar]
- 91.Thomson R. Ultrafast Nonlinear Optics. Springer; 2013. [Google Scholar]
- 92.Wade NJ. A Natural History of Vision. MIT; 1999. [Google Scholar]
- 93.Darrigol O. A History of Optics: From Greek Antiquity to the Nineteenth Century. Oxford University; 2012. [Google Scholar]
- 94.Kingslake R. Optical System Design. Academic; 1983. [Google Scholar]
- 95.Johnson RB. Optical Elements. In: Bass M, Van Stryland EW, Williams DR, Wolfe WL, editors. Handbook of Optics, Vol. 2: Devices, Measurements, and Properties. 2. Chap. 1 McGraw-Hill; 1994. [Google Scholar]
- 96.Mach E. The Principles of Physical Optics: An Historical and Philosophical Treatment. Dover; 1926. [Google Scholar]
- 97.Strong J. Concepts of Classical Optics. Dover; 2004. [Google Scholar]
- 98.Ghatak A. Optics. McGraw-Hill; 2010. [Google Scholar]
- 99.Richards B, Wolf E. Electromagnetic diffraction in optical systems. II. Structure of the image field in an aplanatic system. Proc R Soc A. 1959;253:358–379. [Google Scholar]
- 100.Stamnes JJ. Waves in Focal Regions. CRC Press; 1986. [Google Scholar]
- 101.Visser TD, Wiersma SH. Diffraction of converging electromagnetic waves. J Opt Soc Am A. 1992;9:2034–2047. [Google Scholar]
- 102.Inoue S, Oldenbourg R. Microscopes. In: Bass M, Van Stryland EW, Williams DR, Wolfe WL, editors. Handbook of Optics, Vol. 2: Devices, Measurements, and Properties. 2. Chap. 17 McGraw-Hill; 1994. [Google Scholar]
- 103.Visser TD, Wiersma SH. Electromagnetic description of image formation in confocal fluorescence microscopy. J Opt Soc Am A. 1994;11:599–608. [Google Scholar]
- 104.Török P, Varga P, Laczik Z, Booker GR. Electromagnetic diffraction of light focused through a planar interface between materials of mismatched refractive indices: an integral representation. J Opt Soc Am A. 1995;12:325–332. [Google Scholar]
- 105.Born M, Wolf E, Bhatia AB, Clemmow PC, Gabor D, Stokes AR, Taylor AM, Wayman PA, Wilcock WL. Principles of Optics: Electromagnetic Theory of Propagation, Interference and Diffraction of Light. 7. Cambridge University; 1999. [Google Scholar]
- 106.Sumaya-Martinez J, Mata-Mendez O, Chavez-Rivas F. Rigorous theory of the diffraction of Gaussian beams by finite gratings: TE polarization. J Opt Soc Am A. 2003;20:827–835. doi: 10.1364/josaa.20.000827. [DOI] [PubMed] [Google Scholar]
- 107.Masters BR. Ernst Abbe and the foundation of scientific microscopes. Opt Photon News. 2007;18(2):18–23. [Google Scholar]
- 108.Lipson A, Lipson SG, Lipson H. Optical Physics. 4. Cambridge University; 2011. [Google Scholar]
- 109.Smith DG. Field Guide to Physical Optics. SPIE; 2013. [Google Scholar]
- 110.Klein MV, Furtak TE. Optics. 2. Wiley; 1986. [Google Scholar]
- 111.Voie AH, Burns DH, Spelman FA. Orthogonal-plane fluorescence optical sectioning: Three-dimensional imaging of macroscopic biological specimens. J Microsc. 1993;170:229–236. doi: 10.1111/j.1365-2818.1993.tb03346.x. [DOI] [PubMed] [Google Scholar]
- 112.Huisken J, Swoger J, Del Bene F, Wittbrodt J, Stelzer EHK. Optical sectioning deep inside live embryos by selective plane illumination microscopy. Science. 2004;305:1007–1009. doi: 10.1126/science.1100035. [DOI] [PubMed] [Google Scholar]
- 113.Verveer PJ, Swoger J, Pampaloni F, Greger K, Marcello M, Stelzer EHK. High-resolution three-dimensional imaging of large specimens with light sheet-based microscopy. Nat Methods. 2007;4:311–313. doi: 10.1038/nmeth1017. [DOI] [PubMed] [Google Scholar]
- 114.Reynaud EG, Krzic U, Greger K, Stelzer EHK. Light sheet-based fluorescence microscopy: more dimensions, more photons, and less photodamage. HFSP J. 2008;2:266–275. doi: 10.2976/1.2974980. [DOI] [PMC free article] [PubMed] [Google Scholar]
- 115.Wilt BA, Burns LD, Wei Ho ET, Ghosh KK, Mukamel EA, Schnitzer MJ. Advances in light microscopy for neuroscience. Annu Rev Neurosci. 2009;32:435–506. doi: 10.1146/annurev.neuro.051508.135540. [DOI] [PMC free article] [PubMed] [Google Scholar]
- 116.Weber M, Mickoleit M, Huisken J. Light sheet microscopy. Methods Cell Biol. 2014;123:193–215. doi: 10.1016/B978-0-12-420138-5.00011-2. [DOI] [PubMed] [Google Scholar]
- 117.Rino J, Braga J, Henriques R, Carmo-Fonseca M. Frontiers in fluorescence microscopy. Int J Dev Biol. 2009;53:1569–1579. doi: 10.1387/ijdb.072351jr. [DOI] [PubMed] [Google Scholar]
- 118.Ghiran IC. Introduction to fluorescence microscopy. Methods Mol Biol. 2011;689:93–136. doi: 10.1007/978-1-60761-950-5_7. [DOI] [PubMed] [Google Scholar]
- 119.Kubitscheck U. Fluorescence Microscopy: From Principles to Biological Applications. Wiley; 2013. [Google Scholar]
- 120.Wolf DE. Fundamentals of fluorescence and fluorescence microscopy. Methods Cell Biol. 2013;114:69–97. doi: 10.1016/B978-0-12-407761-4.00004-X. [DOI] [PubMed] [Google Scholar]
- 121.Mondal PP, Diaspro A. Fundamentals of Fluorescence Microscopy. Springer; 2014. [Google Scholar]
- 122.König K. Cell damage during multi-photon microscopy. In: Pawley JB, editor. Handbook of Biological Confocal Microscopy. Chap. 38. Springer; 2006. pp. 680–689. [Google Scholar]
- 123.Tsien RY, Ernst L, Waggoner A. Fluorophores for confocal microscopy: photophysics and photochemistry. In: Pawley JB, editor. Handbook of Biological Confocal Microscopy. Chap. 16. Springer; 2006. pp. 338–352. [Google Scholar]
- 124.Oheim M, Beaurepaire E, Chaigneau E, Mertz J, Charpak S. Two-photon microscopy in brain tissue: parameters influencing the imaging depth. J Neurosci Methods. 2001;111:29–37. doi: 10.1016/s0165-0270(01)00438-1. [DOI] [PubMed] [Google Scholar]
- 125.Beaurepaire E, Mertz J. Epifluorescence collection in two-photon microscopy. Appl Opt. 2002;41:5376–5382. doi: 10.1364/ao.41.005376. [DOI] [PubMed] [Google Scholar]
- 126.Denk W, Piston DW, Webb WW. Multi-photon molecular excitation in laser-scanning microscopy. In: Pawley JB, editor. Handbook of Biological Confocal Microscopy. 3. Chap. 28. Springer; 2006. pp. 535–549. [Google Scholar]
- 127.Leray A, Odin C, Huguet E, Amblard F, Grand YL. Spatially distributed two-photon excitation fluorescence in scattering media: experiments and time-resolved Monte Carlo simulations. Opt Commun. 2007;272:269–278. [Google Scholar]
- 128.Le Grand Y, Leray A, Guilbert T, Odin C. Non-descanned versus descanned epifluorescence collection in two-photon microscopy: experiments and Monte Carlo simulations. Opt Commun. 2008;281:5480–5486. [Google Scholar]
- 129.Leray A, Odin C, Legrand Y. Out-of-focus fluorescence collection in two-photon microscopy of scattering media. Opt Commun. 2008;281:6139–6144. [Google Scholar]
- 130.Sevrain D, Dubreuil M, Leray A, Odin C, Le Grand Y. Measuring the scattering coefficient of turbid media from two-photon microscopy. Opt Express. 2013;21:25221–25235. doi: 10.1364/OE.21.025221. [DOI] [PubMed] [Google Scholar]
- 131.Szmacinski H, Gryczynski I, Lakowicz JR. Spatially localized ballistic two-photon excitation in scattering media. Biospectroscopy. 1998;4:303–310. doi: 10.1002/(SICI)1520-6343(1998)4:5%3C303::AID-BSPY2%3E3.0.CO;2-X. [DOI] [PubMed] [Google Scholar]
- 132.Ying J, Liu F, Alfano RR. Spatial distribution of two-photon-excited fluorescence in scattering media. Appl Opt. 1999;38:224–229. doi: 10.1364/ao.38.000224. [DOI] [PubMed] [Google Scholar]
- 133.Weiner AM. Ultrafast optics: focusing through scattering media. Nat Photonics. 2011;5:332–334. [Google Scholar]
- 134.Wilson T. Confocal microscopy. In: Wilson T, editor. Confocal Microscopy. Chap. 1. Academic; 1990. pp. 1–64. [Google Scholar]
- 135.Müller M. Introduction to Confocal Fluorescence Microscopy. 2. SPIE; 2005. [Google Scholar]
- 136.Pawley J. Fundamental limits in confocal microscopy. In: Pawley JB, editor. Handbook of Biological Confocal Microscopy. 3. Chap. 2. Springer; 2006. pp. 20–42. [Google Scholar]
- 137.Sheppard CJR, Rehman S. Confocal microscopy. In: Rongguang L, editor. Biomedical Optical Imaging Technologies: Design and Applications. Chap. 6. Springer; 2013. pp. 213–231. [Google Scholar]
- 138.Buist AH, Müller M, Squier JA, Brakenhoff GJ. Real time two-photon absorption microscopy using multi point excitation. J Microsc. 1998;192:217–226. [Google Scholar]
- 139.Egner A, Hell SW. Time multiplexing and parallelization in multifocal multiphoton microscopy. J Opt Soc Am A. 2000;17:1192–1201. doi: 10.1364/josaa.17.001192. [DOI] [PubMed] [Google Scholar]
- 140.Fittinghoff DN, Squier JA. Time-decorrelated multifocal array for multiphoton microscopy and micromachining. Opt Lett. 2000;25:1213–1215. doi: 10.1364/ol.25.001213. [DOI] [PubMed] [Google Scholar]
- 141.Andresen V, Egner A, Hell SW. Time-multiplexed multifocal multiphoton microscope. Opt Lett. 2001;26:75–77. doi: 10.1364/ol.26.000075. [DOI] [PubMed] [Google Scholar]
- 142.Gauderon R, Lukins PB, Sheppard CJ. Effect of a confocal pinhole in two-photon microscopy. Microsc Res Tech. 1999;47:210–214. doi: 10.1002/(SICI)1097-0029(19991101)47:3<210::AID-JEMT7>3.0.CO;2-H. [DOI] [PubMed] [Google Scholar]
- 143.Gauderon R, Sheppard CJ. Effect of a finite-size pinhole on noise performance in single-, two-, and three-photon confocal fluorescence microscopy. Appl Opt. 1999;38:3562–3565. doi: 10.1364/ao.38.003562. [DOI] [PubMed] [Google Scholar]
- 144.Egner A, Andresen V, Hell SW. Comparison of the axial resolution of practical Nipkow-disk confocal fluorescence microscopy with that of multifocal multiphoton microscopy: theory and experiment. J Microsc. 2002;206:24–32. doi: 10.1046/j.1365-2818.2002.01001.x. [DOI] [PubMed] [Google Scholar]
- 145.Menzel R. Photonics: Linear and Nonlinear Interactions of Laser Light and Matter. 2. Springer; 2007. [Google Scholar]
- 146.Göppert-Mayer M. Über Elementarakte mit zwei Quantensprüngen. Ann Phys. 1931;401:273–294. [Google Scholar]
- 147.Masters BR. English translations of and translator’s notes on Maria Göppert-Mayer’s theory of two-quantum processes. In: Masters BR, So PTC, editors. Handbook of Biomedical Nonlinear Optical Microscopy. Chap. 4. Oxford Universityk; 2008. pp. 42–84. [Google Scholar]
- 148.Piston DW, Fellers TJ, Davidson MW. Nikon MicroscopyU—Fluorescence Microscopy—Multiphoton Excitation. http://www.microscopyu.com/articles/fluorescence/multiphoton/multiphotonintro.html, retrieved September 8, 2014.
- 149.Squier J, Müller M. High resolution nonlinear microscopy: a review of sources and methods for achieving optimal imaging. Rev Sci Instrum. 2001;72:2855–2867. [Google Scholar]
- 150.Denk W, Delaney KR, Gelperin A, Kleinfeld D, Strowbridge BW, Tank DW, Yuste R. Anatomical and functional imaging of neurons using 2-photon laser scanning microscopy. J Neurosci Methods. 1994;54:151–162. doi: 10.1016/0165-0270(94)90189-9. [DOI] [PubMed] [Google Scholar]
- 151.Wang C, Qiao L, He F, Cheng Y, Xu Z. Extension of imaging depth in two-photon fluorescence microscopy using a long-wavelength high-pulse-energy femtosecond laser source. J Microsc. 2011;243:179–183. doi: 10.1111/j.1365-2818.2011.03492.x. [DOI] [PubMed] [Google Scholar]
- 152.Spence DE, Kean P, Sibbett W. 60-fsec pulse generation from a self-mode-locked Ti:sapphire laser. Opt Lett. 1991;16:42–44. doi: 10.1364/ol.16.000042. [DOI] [PubMed] [Google Scholar]
- 153.Haus H. Mode-locking of lasers. Sel Top Quantum Electron. 2000;6:1173–1185. [Google Scholar]
- 154.Rulliere C, editor. Femtosecond Laser Pulses. Springer; 2005. [Google Scholar]
- 155.Koechner W. Solid-State Laser Engineering. 6. Springer; 2006. [Google Scholar]
- 156.Eichhorn M. Laser Physics. Springer; 2013. [Google Scholar]
- 157.Wall KF, Sanchez A. Titanium sapphire lasers. Lincoln Lab J. 1990;3:447–462. [Google Scholar]
- 158.Girkin J. Laser sources for nonlinear microscopy. In: Masters BR, So PTC, editors. Handbook of Biomedical Nonlinear Optical Microscopy. Chap. 8. Oxford University; 2008. pp. 191–216. [Google Scholar]
- 159.Brown CTA, Cataluna MA, Lagatsky AA, Rafailov EU, Agate MB, Leburn CG, Sibbett W. Compact laser-diode-based femto-second sources. New J Phys. 2004;6:175. [Google Scholar]
- 160.Diels J-C, Rudolph W, Liao PF, Kelly P. Ultrashort Laser Pulse Phenomena. 2. Academic; 2006. [Google Scholar]
- 161.Xu C, Wise FW. Recent advances in fiber lasers for nonlinear microscopy. Nat Photonics. 2013;7:875–882. doi: 10.1038/nphoton.2013.284. [DOI] [PMC free article] [PubMed] [Google Scholar]
- 162.Potma EO, Jones DJ, Cheng J-X, Xie XS, Ye J. High-sensitivity coherent anti-Stokes Raman scattering microscopy with two tightly synchronized picosecond lasers. Opt Lett. 2002;27:1168–1170. doi: 10.1364/ol.27.001168. [DOI] [PubMed] [Google Scholar]
- 163.Müller M, Zumbusch A. Coherent anti-Stokes Raman scattering microscopy. Chem Phys Chem. 2007;8:2156–2170. doi: 10.1002/cphc.200700202. [DOI] [PubMed] [Google Scholar]
- 164.Cheng J-X, Xie XS, editors. Coherent Raman Scattering Microscopy. 1. CRC Press; 2012. Series in Cellular and Clinical Imaging. [Google Scholar]
- 165.Brenier A. A new evaluation of Yb3+-doped crystals for laser applications. J Lumin. 2001;92:199–204. [Google Scholar]
- 166.Tang L, Lin Z, Zhang L, Wang G. Phase diagram, growth and spectral characteristic of Yb:KY(WO) crystal. J Cryst Growth. 2005;282:376–382. [Google Scholar]
- 167.Senthilkumaran A, Moorthybabu S, Ganesamoorthy S, Bhaumik I, Karnal A. Crystal growth and characterization of KY(WO4)2 and KGd (WO4)2 for laser applications. J Cryst Growth. 2006;292:368–372. [Google Scholar]
- 168.Liu J, Petrov V, Mateos X, Zhang H, Wang J. Efficient high-power laser operation of Yb:KLu(WO4)2 crystals cut along the principal optical axes. Opt Lett. 2007;32:2016–2018. doi: 10.1364/ol.32.002016. [DOI] [PubMed] [Google Scholar]
- 169.Durfee CG, Storz T, Garlick J, Hill S, Squier JA, Kirchner M, Taft G, Shea K, Kapteyn H, Murnane M, Backus S. Direct diode-pumped Kerr-lens mode-locked Ti:sapphire laser. Opt Express. 2012;20:13677–13683. doi: 10.1364/OE.20.013677. [DOI] [PMC free article] [PubMed] [Google Scholar]
- 170.Young MD, Backus S, Durfee C, Squier J. Multiphoton imaging with a direct-diode pumped femtosecond Ti:sapphire laser. J Microsc. 2013;249:83–86. doi: 10.1111/j.1365-2818.2012.03688.x. [DOI] [PMC free article] [PubMed] [Google Scholar]
- 171.Biswal S, O’Connor SP, Bowman SR. Nonradiative losses in Yb: KGd(WO4)2 and Yb:Y3Al5O12. Appl Phys Lett. 2006;89:91911. [Google Scholar]
- 172.Pollnau M, Romanyuk Y, Gardillou F, Borca C. Double tungstate lasers: from bulk toward on-chip integrated waveguide devices. Sel Top Quantum Electron. 2007;13:661–671. [Google Scholar]
- 173.Brunner F, Spühler GJ, der Au JA, Krainer L, Morier-Genoud F, Paschotta R, Lichtenstein N, Weiss S, Harder C, Lagatsky AA, Abdolvand A, Kuleshov NV, Keller U. Diode-pumped femtosecond Yb:KGd(WO4)2 laser with 1.1-W average power. Opt Lett. 2000;25:1119–1121. doi: 10.1364/ol.25.001119. [DOI] [PubMed] [Google Scholar]
- 174.Paunescu G, Hein J, Sauerbrey R. 100-fs diode-pumped Yb:KGW mode-locked laser. Appl Phys B. 2004;79:555–558. [Google Scholar]
- 175.Hoos F, Meyrath TP, Li S, Braun B, Giessen H. Femtosecond 5-W Yb:KGW slab laser oscillator pumped by a single broad-area diode and its application as supercontinuum source. Appl Phys B. 2009;96:5–10. [Google Scholar]
- 176.Pekarek S, Fiebig C, Stumpf MC, Oehler AEH, Paschke K, Erbert G, Südmeyer T, Keller U. Diode-pumped gigahertz femtosecond Yb:KGW laser with a peak power of 3.9 kW. Opt Express. 2010;18:16320–16326. doi: 10.1364/OE.18.016320. [DOI] [PubMed] [Google Scholar]
- 177.Li J, Liang X, He J, Lin H. Stable, efficient diode-pumped femtosecond Yb:KGW laser through optimization of energy density on SESAM. Chin Opt Lett. 2011;9:71405–71407. [Google Scholar]
- 178.Chen H-W, Chang G, Xu S, Yang Z, Kartner FX. 3 GHz, fundamentally mode-locked, femtosecond Yb-fiber laser. Opt Lett. 2012;37:3522–3524. doi: 10.1364/OL.37.003522. [DOI] [PubMed] [Google Scholar]
- 179.Sheetz KE, Hoover EE, Carriles R, Kleinfeld D, Squier JA. Advancing multifocal nonlinear microscopy: development and applica tion of a novel multibeam Yb:KGd(WO4)2 oscillator. Opt Express. 2008;16:17574–17584. doi: 10.1364/oe.16.017574. [DOI] [PubMed] [Google Scholar]
- 180.Sandkuijl D, Cisek R, Major A, Barzda V. Differential microscopy for fluorescence-detected nonlinear absorption linear anisotropy based on a staggered two-beam femtosecond Yb:KGW oscillator. Biomed Opt Express. 2010;1:895–901. doi: 10.1364/BOE.1.000895. [DOI] [PMC free article] [PubMed] [Google Scholar]
- 181.Xi P. Biomedical Optics. Optical Society of American; 2008. Advantages found for 10 fs pulses in multiphoton microscopy. paper BMD51. [Google Scholar]
- 182.Rehbinder J, Brückner L, Wipfler A, Buckup T, Motzkus M. Multimodal nonlinear optical microscopy with shaped 10 fs pulses. Opt Express. 2014;22:28790–28797. doi: 10.1364/OE.22.028790. [DOI] [PubMed] [Google Scholar]
- 183.Krueger A, Philippe F. Ytterbium tungstate revolutionizes the field of high-power ultrafast lasers. Photonics Spectra. 2004;38(3):46–47. [Google Scholar]
- 184.Major A, Cisek R, Barzda V. Femtosecond Yb: KGd (WO4)2 laser oscillator pumped by a high power fiber-coupled diode laser module. Opt Express. 2006;14:12163–12168. doi: 10.1364/oe.14.012163. [DOI] [PubMed] [Google Scholar]
- 185.Liebel M, Schnedermann C, Kukura P. Sub-10-fs pulses tunable from 480 to 980 nm from a NOPA pumped by an Yb:KGW source. Opt Lett. 2014;39:4112–4115. doi: 10.1364/OL.39.004112. [DOI] [PubMed] [Google Scholar]
- 186.Krauth J, Steinmann A, Hegenbarth R, Conforti M, Giessen H. Broadly tunable femtosecond near- and mid-IR source by direct pumping of an OPA with a 41.7 MHz Yb:KGW oscillator. Opt Express. 2013;21:11516–356. doi: 10.1364/OE.21.011516. [DOI] [PubMed] [Google Scholar]
- 187.Metzger B, Steinmann A, Hoos F, Pricking S, Giessen H. Compact laser source for high-power white-light and widely tunable sub 65 fs laser pulses. Opt Lett. 2010;35:3961–3963. doi: 10.1364/OL.35.003961. [DOI] [PubMed] [Google Scholar]
- 188.Legros P, Choquet D, Gueguen S, Mottay E, Deguil N. Simultaneous excitation of multiple fluororophores with a compact femto-second laser. Proc SPIE. 2006;6089:60890U. [Google Scholar]
- 189.Deguil N, Mottay E, Salin F, Legros P, Choquet D. Novel diode-pumped infrared tunable laser system for multi-photon microscopy. Microsc Res Tech. 2004;63:23–26. doi: 10.1002/jemt.10419. [DOI] [PubMed] [Google Scholar]
- 190.Steinle T, Kumar V, Steinmann A, Marangoni M, Cerullo G, Giessen H. Highly compact, low-noise all-solid state laser system for stimulated Raman scattering microscopy. OSA Proceedings on Advanced Solid-State Lasers. 2014;40:6–7. doi: 10.1364/OL.40.000593. [DOI] [PubMed] [Google Scholar]
- 191.Fermann M, Galvanauskas A, Sucha G, Harter D. Fiber-lasers for ultrafast optics. Appl Phys B. 1997;65:259–275. [Google Scholar]
- 192.Fermann ME, Sucha G, Galvanauskas A, Hofer M, Harter D. Fiber lasers in ultrafast optics. Proc SPIE. 1999;3616:14–24. [Google Scholar]
- 193.Renk KF. Basics of Laser Physics. Springer; 2012. [Google Scholar]
- 194.Freudiger CW, Yang W, Holtom GR, Peyghambarian N, Xie XS, Kieu KQ. Stimulated Raman scattering microscopy with a robust fibre laser source. Nat Photonics. 2014;8:153–159. doi: 10.1038/nphoton.2013.360. [DOI] [PMC free article] [PubMed] [Google Scholar]
- 195.Wise FW. Femtosecond fiber lasers based on dissipative processes for nonlinear microscopy. IEEE J Sel Top Quantum Electron. 2012;18:1412–1421. doi: 10.1109/JSTQE.2011.2179919. [DOI] [PMC free article] [PubMed] [Google Scholar]
- 196.Fan T, Byer R. Modeling and CW operation of a quasi-three-level 946 nm Nd:YAG laser. Quantum Electron. 1987;QE-23:605–612. [Google Scholar]
- 197.Risk W. Modeling of longitudinally pumped solid-state lasers exhibiting reabsorption losses. J Opt Soc Am B. 1988;5:1412–1423. [Google Scholar]
- 198.Taira T, Tulloch W, Byer R. Modeling of quasi-three-level lasers and operation of cw Yb: YAG lasers. Appl Opt. 1997;36:1867–1874. doi: 10.1364/ao.36.001867. [DOI] [PubMed] [Google Scholar]
- 199.Demange MA. Mineralogy for Petrologists: Optics, Chemistry and Occurrences of Rock-Forming Minerals. CRC Press; 2012. [Google Scholar]
- 200.Hellström J, Bjurshagen S. Experimental investigation of the athe-rmal orientation in Yb: KGW. Conference Report of Advanced Solid-State Photonics; 2006. paper WB5. [Google Scholar]
- 201.Krausz F, Fermann M, Brabec T, Curley P, Ober MH. Femto-second solid-state lasers. Quantum Electron. 1992;28:2097–2122. [Google Scholar]
- 202.Paschotta R, Keller U. Passive mode locking with slow saturable absorbers. Appl Phys B. 2001;73:653–662. [Google Scholar]
- 203.Hönninger C, Paschotta R, Morier-Genoud F. Q-switching stability limits of continuous-wave passive mode locking. J Opt Soc Am B. 1999;16:46–56. [Google Scholar]
- 204.Hirliman C. Pulsed optics. In: Rulliére C, editor. Femtosecond Laser Pulses: Principles and Experiments. Chap. 2. Springer; 1998. pp. 25–52. [Google Scholar]
- 205.Weiner A. Femtosecond optical pulse shaping and processing. Prog Quantum Electron. 1995;19:161–237. [Google Scholar]
- 206.Weiner AM, Kan’an AM. Femtosecond pulse shaping for synthesis, processing, and time-to-space conversion of ultrafast optical waveforms. IEEE J Sel Top Quantum Electron. 1998;4:317–331. [Google Scholar]
- 207.Weiner AM. Femtosecond pulse shaping using spatial light modulators. Rev Sci Instrum. 2000;71:1929–1960. [Google Scholar]
- 208.Walmsley I, Waxer L, Dorrer C. The role of dispersion in ultrafast optics. Rev Sci Instrum. 2001;72:1–29. [Google Scholar]
- 209.Dantus M, Pestov D, Andegeko Y. Nonlinear optical imaging with sub-10 fs pulses. In: Yakovlev VV, editor. Biochemical Applications of Nonlinear Optical Spectroscopy. Chap. 8 CRC Press; 2009. [Google Scholar]
- 210.Wollenhaupt M, Assion A, Baumert T. Short and ultrashort laser pulses. In: Träger F, editor. Springer Handbook of Lasers and Optics. 2. Chap. 12. Springer; 2012. pp. 1047–1094. [Google Scholar]
- 211.Guild JB, Xu C, Webb WW. Measurement of group delay dispersion of high numerical aperture objective lenses using two-photon excited fluorescence. Appl Opt. 1997;36:397–401. doi: 10.1364/ao.36.000397. [DOI] [PubMed] [Google Scholar]
- 212.Wang W, Liu Y, Xi P, Ren Q. Origin and effect of high-order dispersion in ultrashort pulse multiphoton microscopy in the 10 fs regime. Appl Opt. 2010;49:6703–6709. doi: 10.1364/AO.49.006703. [DOI] [PubMed] [Google Scholar]
- 213.Martinez OE, Gordon JP, Fork RL. Negative group-velocity dispersion using refraction. J Opt Soc Am A. 1984;1:1003–1006. [Google Scholar]
- 214.Fork RL, Martinez OE, Gordon JP. Negative dispersion using pairs of prisms. Opt Lett. 1984;9:150–152. doi: 10.1364/ol.9.000150. [DOI] [PubMed] [Google Scholar]
- 215.Müller M, Squier J, Wolleschensky R, Simon U, Brakenhoff GJ. Dispersion pre-compensation of 15 femtosecond optical pulses for high-numerical-aperture objectives. J Microsc. 1998;191:141–150. doi: 10.1046/j.1365-2818.1998.00357.x. [DOI] [PubMed] [Google Scholar]
- 216.Akturk S, Gu X, Kimmel M, Trebino R. Extremely simple single-prism ultrashort- pulse compressor. Opt Express. 2006;14:10101–10108. doi: 10.1364/oe.14.010101. [DOI] [PubMed] [Google Scholar]
- 217.Kane S, Squier J. Grating compensation of third-order material dispersion in the normal dispersion regime: Sub-100-fs chirped-pulse amplification using a fiber stretcher and grating-pair compressor. IEEE J Quantum Electron. 1995;31:2052–2057. [Google Scholar]
- 218.Field JJ, Durfee CG, Squier JA, Kane S. Quartic-phase-limited grism-based ultrashort pulse shaper. Opt Lett. 2007;32:3101–3103. doi: 10.1364/ol.32.003101. [DOI] [PubMed] [Google Scholar]
- 219.Agostinelli J, Harvey G, Stone T, Gabel C. Optical pulse shaping with a grating pair. Appl Opt. 1979;18:2500–2504. doi: 10.1364/AO.18.002500. [DOI] [PubMed] [Google Scholar]
- 220.Tai K, Tomita A. 1100 × optical fiber pulse compression using grating pair and soliton effect at 1.319 μm. Appl Phys Lett. 1986;48:1033–1035. [Google Scholar]
- 221.Simon JM, Ledesma SA, Iemmi CC, Martinez OE. General compressor for ultrashort pulses with nonlinear chirp. Opt Lett. 1991;16:1704–1706. doi: 10.1364/ol.16.001704. [DOI] [PubMed] [Google Scholar]
- 222.Kafka JD, Baer T. Prism-pair dispersive delay lines in optical pulse compression. Opt Lett. 1987;12:401–403. doi: 10.1364/ol.12.000401. [DOI] [PubMed] [Google Scholar]
- 223.Soeller C, Cannell MB. Construction of a two-photon microscope and optimisation of illumination pulse duration. Pfluegers Arch. 1996;432:555–561. doi: 10.1007/s004240050169. [DOI] [PubMed] [Google Scholar]
- 224.Xi P, Andegeko Y, Pestov D, Lovozoy VV, Dantus M. Two-photon imaging using adaptive phase compensated ultrashort laser pulses. J Biomed Opt. 2009;14:014002. doi: 10.1117/1.3059629. [DOI] [PubMed] [Google Scholar]
- 225.Tempea GF, Považay B, Assion A, Isemann A, Pervak W, Kempe M, Stingl A, Drexler W. Biomedical Optics. Optical Society of America; 2006. All-chirped-mirror pulse compressor for nonlinear microscopy. paper WF2. [Google Scholar]
- 226.Giguère M, Schmidt BE, Shiner AD, Houle M-A, Bandulet HC, Tempea G, Villeneuve DM, Kieffer J-C, Légaré F. Pulse compression of submillijoule few-optical-cycle infrared laser pulses using chirped mirrors. Opt Lett. 2009;34:1894–1896. doi: 10.1364/ol.34.001894. [DOI] [PubMed] [Google Scholar]
- 227.Rivera CA, Bradforth SE, Tempea G. Gires-Tournois interferometer type negative dispersion mirrors for deep ultraviolet pulse compression. Opt Express. 2010;18:18615–18624. doi: 10.1364/OE.18.018615. [DOI] [PubMed] [Google Scholar]
- 228.Baumert T, Brixner T, Seyfried V, Strehle M, Gerber G. Femtosecond pulse shaping by an evolutionary algorithm with feedback. Appl Phys B. 1997;65:779–782. [Google Scholar]
- 229.Salin F. How to manipulate and change the characteristics of laser pulses. In: Rullière C, editor. Femtosecond Laser Pulses: Principles and Experiments. Chap. 6. Springer; 1998. pp. 159–176. [Google Scholar]
- 230.Bardeen CJ, Yakovlev VV, Squier JA, Wilson KR, Carpenter SD, Weber PM. Effect of pulse shape on the efficiency of multiphoton processes: implications for biological microscopy. J Biomed Opt. 1999;4:362–367. doi: 10.1117/1.429937. [DOI] [PubMed] [Google Scholar]
- 231.Oishi Y, Suda A, Kannari F, Midorikawa K. Intense femtosecond pulse shaping using a fused-silica spatial light modulator. Opt Commun. 2007;270:305–309. [Google Scholar]
- 232.Field JJ, Carriles R, Sheetz KE, Chandler EV, Hoover EE, Tillo SE, Hughes TE, Sylvester AW, Kleinfeld D, Squier JA. Optimizing the fluorescent yield in two-photon laser scanning microscopy with dispersion compensation. Opt Express. 2010;18:13661–13672. doi: 10.1364/OE.18.013661. [DOI] [PMC free article] [PubMed] [Google Scholar]
- 233.Weiner AM. Ultrafast optical pulse shaping: A tutorial review. Opt Commun. 2011;284:3669–3692. [Google Scholar]
- 234.Katz O, Bromberg Y, Small E, Silberberg Y. Focusing and compression of ultrashort pulses through scattering media. Nat Photonics. 2011;5:372–377. [Google Scholar]
- 235.Kane DJ, Trebino R. Characterization of arbitrary femtosecond pulses using frequency-resolved optical gating. IEEE J Quantum Electron. 1993;29:571–579. [Google Scholar]
- 236.Fittinghoff DN, Millard AC, Squier JA, Michiel M. Frequency-resolved optical gating measurement of ultrashort pulses passing through a high numerical aperture objective. IEEE J Quantum Electron. 1999;35:479–486. [Google Scholar]
- 237.O’Shea D, Kimmel M, O’Shea P, Trebino R. Ultrashort-laser-pulse measurement using swept beams. Opt Lett. 2001;26:1442–1444. doi: 10.1364/ol.26.001442. [DOI] [PubMed] [Google Scholar]
- 238.Trebino R. Frequency-Resolved Optical Gating: The Measurement of Ultrashort Laser Pulses. Springer; 2002. [Google Scholar]
- 239.Chang Z. Fundamentals of Attosecond Optics. CRC Press; 2011. [Google Scholar]
- 240.Kowalevicz A. Ultrashort pulse generation and measurement. In: Prasankumar RP, Taylor JA, editors. Optical Techniques for Solid-State Materials Characterization. Chap. 7 CRC Press; 2011. [Google Scholar]
- 241.Ratner J, Steinmeyer G, Wong TC, Bartels R, Trebino R. Coherent artifact in modern pulse measurements. Opt Lett. 2012;37:2874–2876. doi: 10.1364/OL.37.002874. [DOI] [PubMed] [Google Scholar]
- 242.Iaconis C, Walmsley I. Spectral phase interferometry for direct electric-field reconstruction of ultrashort optical pulses. Opt Lett. 1998;23:792–794. doi: 10.1364/ol.23.000792. [DOI] [PubMed] [Google Scholar]
- 243.Iaconis C, Walmsley I. Self-referencing spectral interferometry for measuring ultrashort optical pulses. IEEE J Quantum Electron. 1999;35:501–509. [Google Scholar]
- 244.Gallmann L, Sutter DH, Matuschek N, Steinmeyer G, Keller U, Iaconis C, Walmsley IA. Characterization of sub-6-fs optical pulses with spectral phase interferometry for direct electric-field reconstruction. Opt Lett. 1999;24:1314–1316. doi: 10.1364/ol.24.001314. [DOI] [PubMed] [Google Scholar]
- 245.Dela Cruz JM, Lozovoy VV, Dantus M. Coherent control improves biomedical imaging with ultrashort shaped pulses. J Photochem Photobiol A. 2006;180:307–313. [Google Scholar]
- 246.Lozovoy VV, Pastirk I, Dantus M. Multiphoton intrapulse interference. IV. Ultrashort laser pulse spectral phase characterization and compensation. Opt Lett. 2004;29:775–777. doi: 10.1364/ol.29.000775. [DOI] [PubMed] [Google Scholar]
- 247.Pastirk I, Resan B, Fry A, MacKay J, Dantus M. No loss spectral phase correction and arbitrary phase shaping of regeneratively amplified femtosecond pulses using MIIPS. Opt Express. 2006;14:9537–9543. doi: 10.1364/oe.14.009537. [DOI] [PubMed] [Google Scholar]
- 248.Xu B, Gunn JM, Cruz JMD, Lozovoy VV, Dantus M. Quantitative investigation of the multiphoton intrapulse interference phase scan method for simultaneous phase measurement and compensation of femtosecond laser pulses. J Opt Soc Am B. 2006;23:750–759. [Google Scholar]
- 249.Coello Y, Lozovoy VV, Gunaratne TC, Xu B, Borukhovich I, Tseng C-h, Weinacht T, Dantus M. Interference without an interferometer: a different approach to measuring, compressing, and shaping ultra-short laser pulses. J Opt Soc Am B. 2008;25:A140–A150. [Google Scholar]
- 250.Xi P, Andegeko Y, Weisel LR, Lozovoy VV, Dantus M. Greater signal, increased depth, and less photobleaching in two-photon microscopy with 10 fs pulses. Opt Commun. 2008;281:1841–1849. [Google Scholar]
- 251.Müller M, Squier J, Brakenhoff GJ. Measurement of femtosecond pulses in the focal point of a high-numerical-aperture lens by two-photon absorption. Opt Lett. 1995;20:1038–1040. doi: 10.1364/ol.20.001038. [DOI] [PubMed] [Google Scholar]
- 252.Millard AC, Fittinghoff DN, Squier JA, Müller M, Gaeta AL. Using GaAsP photodiodes to characterize ultrashort pulses under high numerical aperture focusing in microscopy. J Microsc. 1999;193:179–181. [Google Scholar]
- 253.Sarger L, Oberlé J. How to measure the characteristics of laser pulses. In: Rullière C, editor. Femtosecond Laser Pulses: Principles and Experiments. Chap. 7. Springer; 1998. pp. 177–201. [Google Scholar]
- 254.Heintzmann R. Practical guide to optical alignment. In: Kubitscheck U, editor. Fluorescence Microscopy: From Principles to Biological Applications. Wiley-Blackwell; 2013. pp. 393–401. Appendix A. [Google Scholar]
- 255.Straub M, Hell SW. Fluorescence lifetime three-dimensional microscopy with picosecond precision using a multifocal multiphoton microscope. Appl Phys Lett. 1998;73:1769–1771. [Google Scholar]
- 256.Fittinghoff DN, Wiseman P, Squier J. Widefield multiphoton and temporally decorrelated multifocal multiphoton microscopy. Opt Express. 2000;7:273–279. doi: 10.1364/oe.7.000273. [DOI] [PubMed] [Google Scholar]
- 257.Hell SW, Andresen V. Space-multiplexed multifocal nonlinear microscopy. J Microsc. 2001;202:457–463. doi: 10.1046/j.1365-2818.2001.00918.x. [DOI] [PubMed] [Google Scholar]
- 258.Sacconi L, Froner E, Antolini R, Taghizadeh MR, Choudhury A, Pavone FS. Multiphoton multifocal microscopy exploiting a diffractive optical element. Opt Lett. 2003;28:1918–1920. doi: 10.1364/ol.28.001918. [DOI] [PubMed] [Google Scholar]
- 259.Fricke M, Nielsen T. Two-dimensional imaging without scanning by multifocal multiphoton microscopy. Appl Opt. 2005;44:2984–2988. doi: 10.1364/ao.44.002984. [DOI] [PubMed] [Google Scholar]
- 260.Bahlmann K, So PT, Kirber M, Reich R, Kosicki B, McGonagle W, Bellve K. Multifocal multiphoton microscopy (MMM) at a frame rate beyond 600 Hz. Opt Express. 2007;15:10991–10998. doi: 10.1364/oe.15.010991. [DOI] [PubMed] [Google Scholar]
- 261.Kim KH, Buehler C, Bahlmann K, Ragan T, Lee W-CA, Nedivi E, Heffer EL, Fantini S, So PTC. Multifocal multiphoton microscopy based on multianode photomultiplier tubes. Opt Express. 2007;15:11658–11678. doi: 10.1364/oe.15.011658. [DOI] [PMC free article] [PubMed] [Google Scholar]
- 262.Carriles R, Sheetz KE, Hoover EE, Squier JA, Barzda V. Simultaneous multifocal, multiphoton, photon counting microscopy. Opt Express. 2008;16:10364–10371. doi: 10.1364/oe.16.010364. [DOI] [PubMed] [Google Scholar]
- 263.Chandler EV, Hoover EE, Field JJ, Sheetz KE, Amir W, Carriles R, Ding S-y, Squier JA. High-resolution mosaic imaging with multifocal, multiphoton photon-counting microscopy. Appl Opt. 2009;48:2067–2077. doi: 10.1364/ao.48.002067. [DOI] [PubMed] [Google Scholar]
- 264.Saggau P, Bullen A, Patel SS. Acousto-optic random-access laser scanning microscopy: fundamentals and applications to optical recording of neuronal activity. Cell Mol Biol. 1998;44:827–846. [PubMed] [Google Scholar]
- 265.Sinclair G, Leach J, Jordan P, Gibson G, Yao E, Laczik ZJ, Padgett MJ, Courtial J. Interactive application in holographic optical tweezers of a multi-plane Gerchberg-Saxton algorithm for three-dimensional light shaping. Opt Express. 2004;12:1665–1670. doi: 10.1364/opex.12.001665. [DOI] [PubMed] [Google Scholar]
- 266.Botcherby EJ, Juskaitis R, Booth MJ, Wilson T. Aberration-free optical refocusing in high numerical aperture microscopy. Opt Lett. 2007;32:2007–2009. doi: 10.1364/ol.32.002007. [DOI] [PubMed] [Google Scholar]
- 267.Botcherby E, Juškaitis R, Booth M, Wilson T. An optical technique for remote focusing in microscopy. Opt Commun. 2008;281:880–887. [Google Scholar]
- 268.Nikolenko V, Watson BO, Araya R, Woodruff A, Peterka DS, Yuste R. SLM microscopy: scanless two-photon imaging and photostimu-lation with spatial light modulators. Front Neural Circ. 2008;2 doi: 10.3389/neuro.04.005.2008. [DOI] [PMC free article] [PubMed] [Google Scholar]
- 269.Botcherby EJ, Booth MJ, Jukaitis R, Wilson T. Real-time slit scanning microscopy in the meridional plane. Opt Lett. 2009;34:1504–1506. doi: 10.1364/ol.34.001504. [DOI] [PubMed] [Google Scholar]
- 270.Botcherby E, Smith C, Booth M, Juskaitis R, Wilson T. Arbitrary-scan imaging for two-photon microscopy. Proc SPIE. 2010;7569:756917. [Google Scholar]
- 271.Anselmi F, Ventalon C, Begue A, Ogden D, Emiliani V. Three-dimensional imaging and photostimulation by remote-focusing and holographic light patterning. Proc Natl Acad Sci USA. 2011;108:19504–19509. doi: 10.1073/pnas.1109111108. [DOI] [PMC free article] [PubMed] [Google Scholar]
- 272.Indebetouw G, El Maghnouji A, Foster R. Scanning holographic microscopy with transverse resolution exceeding the Rayleigh limit and extended depth of focus. J Opt Soc Am A. 2005;22:892–898. doi: 10.1364/josaa.22.000892. [DOI] [PMC free article] [PubMed] [Google Scholar]
- 273.Qi Y, Lei M, Yang Y, Yao B, Dan D, Yu X, Yan S, Ye T. Remote-focusing microscopy with long working distance objective lenses. Appl Opt. 2014;53:3473–3478. doi: 10.1364/AO.53.003473. [DOI] [PubMed] [Google Scholar]
- 274.Salomé R, Kremer Y, Dieudonné S, Léger J-F, Krichevsky O, Wyart C, Chatenay D, Bourdieu L. Ultrafast random-access scanning in two-photon microscopy using acousto-optic deflectors. J Neurosci Methods. 2006;154:161–174. doi: 10.1016/j.jneumeth.2005.12.010. [DOI] [PubMed] [Google Scholar]
- 275.Lv X, Zhan C, Zeng S, Chen WR, Luo Q. Construction of multiphoton laser scanning microscope based on dual-axis acousto-optic deflector. Rev Sci Instrum. 2006;77:046101. [Google Scholar]
- 276.Lechleiter JD, Lin D-T, Sieneart I. Multi-photon laser scanning microscopy using an acoustic optical deflector. Biophys J. 2002;83:2292–2299. doi: 10.1016/S0006-3495(02)73989-1. [DOI] [PMC free article] [PubMed] [Google Scholar]
- 277.Fan GY, Fujisaki H, Miyawaki A, Tsay RK, Tsien RY, Ellisman MH. Video-rate scanning two-photon excitation fluorescence microscopy and ratio imaging with cameleons. Biophys J. 1999;76:2412–2420. doi: 10.1016/S0006-3495(99)77396-0. [DOI] [PMC free article] [PubMed] [Google Scholar]
- 278.Field JJ, Sheetz KE, Chandler EV, Hoover EE, Young MD, Ding S-y, Sylvester AW, Kleinfeld D, Squier JA. Differential multi-photon laser scanning microscopy. IEEE J Sel Top Quantum Electron. 2012;18:14–28. doi: 10.1109/JSTQE.2010.2077622. [DOI] [PMC free article] [PubMed] [Google Scholar]
- 279.Miyajima H, Asaoka N, Isokawa T, Ogata M, Aoki Y, Imai M, Fujimori O, Katashiro M, Matsumoto K. A MEMS electromagnetic optical scanner for a commercial confocal laser scanning microscope. J Microelectromech Syst. 2003;12:243–251. [Google Scholar]
- 280.Piyawattanametha W, Barretto RPJ, Ko TH, Flusberg BA, Cocker ED, Ra H, Lee D, Solgaard O, Schnitzer MJ. Fast-scanning two-photon fluorescence imaging based on a microelectromechanical systems two-dimensional scanning mirror. Opt Lett. 2006;31:2018–2020. doi: 10.1364/ol.31.002018. [DOI] [PMC free article] [PubMed] [Google Scholar]
- 281.Piyawattanametha W, Cocker ED, Burns LD, Barretto RP, Jung JC, Ra H, Solgaard O, Schnitzer MJ. In vivo brain imaging using a portable 29 g two-photon microscope based on a microelectromechanical systems scanning mirror. Opt Lett. 2009;34:2309–2311. doi: 10.1364/ol.34.002309. [DOI] [PMC free article] [PubMed] [Google Scholar]
- 282.Corle TR, Kino GS. Confocal Scanning Optical Microscopy and Related Imaging Systems. Academic; 1996. [Google Scholar]
- 283.Stelzer EHK. The intermediate optical system of laser-scanning confocal microscopes. In: Pawley JB, editor. Handbook of Biological Confocal Microscopy. 3. Chap. 9. Springer; 2006. pp. 207–220. [Google Scholar]
- 284.Sagan SF. Optical systems for laser scanners. In: Marshall GF, Stutz GE, editors. Handbook of Optical and Laser Scanning. Chap. 2. CRC Press; 2011. pp. 70–132. [Google Scholar]
- 285.Velzel C. A Course in Lens Design. Springer; 2014. [Google Scholar]
- 286.Field JJ. PhD dissertation. Colorado School of Mines; 2010. Differential multiphoton microscopy. [Google Scholar]
- 287.Amir W, Carriles R, Hoover EE, Planchon TA, Durfee CG, Squier JA. Simultaneous imaging of multiple focal planes using a two-photon scanning microscope. Opt Lett. 2007;32:1731–1733. doi: 10.1364/ol.32.001731. [DOI] [PubMed] [Google Scholar]
- 288.Zemax. OpticStudio. https://www.zemax.com, retrieved September 3, 2014.
- 289.Negrean A, Mansvelder HD. Optimal lens design and use in laser-scanning microscopy. Biomed Opt Express. 2014;5:1588–1609. doi: 10.1364/BOE.5.001588. [DOI] [PMC free article] [PubMed] [Google Scholar]
- 290.Davidson MW. Microscope objective specifications. http://www.microscopyu.com/articles/optics/objectivespecs.html, retrieved June 12, 2014.
- 291.Michalet X, Weiss S. Using photon statistics to boost microscopy resolution. Proc Natl Acad Sci USA. 2006;103:4797–4798. doi: 10.1073/pnas.0600808103. [DOI] [PMC free article] [PubMed] [Google Scholar]
- 292.Dertinger T, Colyer R, Iyer G, Weiss S, Enderlein J. Fast, background-free, 3D super-resolution optical fluctuation imaging (SOFI) Proc Natl Acad Sci USA. 2009;106:22287–22292. doi: 10.1073/pnas.0907866106. [DOI] [PMC free article] [PubMed] [Google Scholar]
- 293.Dertinger T, Colyer R, Vogel R, Heilemann M, Sauer M, Enderlein J, Weiss S. Superresolution optical fluctuation imaging (SOFI) In: Zahavy E, Ordentlich A, Yitzhaki S, Shafferman A, editors. Nano-Biotechnology for Biomedical and Diagnostic Research. Chap. 2. Springer; 2011. pp. 17–21. [Google Scholar]
- 294.Bobroff N. Position measurement with a resolution and noise-limited instrument. Rev Sci Instrum. 1986;57:1152–1157. [Google Scholar]
- 295.Betzig E. Proposed method for molecular optical imaging. Opt Lett. 1995;20:237–239. doi: 10.1364/ol.20.000237. [DOI] [PubMed] [Google Scholar]
- 296.Ram S, Ward ES, Ober RJ. Beyond Rayleigh’s criterion: a resolution measure with application to single-molecule microscopy. Proc Natl Acad Sci USA. 2006;103:4457–4462. doi: 10.1073/pnas.0508047103. [DOI] [PMC free article] [PubMed] [Google Scholar]
- 297.Rust MJ, Bates M, Zhuang X. Sub-diffraction-limit imaging by stochastic optical reconstruction microscopy (STORM) Nat Methods. 2006;3:793–796. doi: 10.1038/nmeth929. [DOI] [PMC free article] [PubMed] [Google Scholar]
- 298.Hillenbrand M, Hoffmann A, Kelly DP, Sinzinger S. Fast non-paraxial scalar focal field calculations. J Opt Soc Am A. 2014;31:1206–1214. doi: 10.1364/JOSAA.31.001206. [DOI] [PubMed] [Google Scholar]
- 299.Stamnes JJ. Focusing of two-dimensional waves. J Opt Soc Am. 1981;71:15–31. [Google Scholar]
- 300.Stamnes JJ, Eide HA. Exact and approximate solutions for focusing of two-dimensional waves. I. Theory. J Opt Soc Am A. 1998;15:1285–1291. [Google Scholar]
- 301.Kirchhoff G. Zur Theorie der Lichtstrahlen. Ann Phys. 1883;254:663–695. [Google Scholar]
- 302.Debye P. Das Verhalten von Lichtwellen in der Nähe eines Brennpunktes oder einer Brennlinie. Ann Phys. 1909;335:755–776. [Google Scholar]
- 303.Eide HA, Stamnes JJ. Exact and approximate solutions for focusing of two-dimensional waves. II. Numerical comparisons among exact, Debye, and Kirchhoff theories. J Opt Soc Am A. 1998;15:1292–1307. [Google Scholar]
- 304.Eide HA, Stamnes JJ. Exact and approximate solutions for focusing of two-dimensional waves. III. Numerical comparisons between exact and Rayleigh–Sommerfeld theories. J Opt Soc Am A. 1998;15:1308–1319. [Google Scholar]
- 305.Mata-Mendez O, Avendaño J, Chavez-Rivas F. Rigorous theory of the diffraction of Gaussian beams by finite gratings: TM polarization. J Opt Soc Am A. 2006;23:1889–1896. doi: 10.1364/josaa.23.001889. [DOI] [PubMed] [Google Scholar]
- 306.Török P, Kao F-J, editors. Optical Imaging and Microscopy. Springer; 2007. [Google Scholar]
- 307.Wu Q, Feke GD, Grober RD, Ghislain LP. Realization of numerical aperture 2.0 using a gallium phosphide solid immersion lens. Appl Phys Lett. 1999;75:4064–4068. [Google Scholar]
- 308.Zinter JP, Levene MJ. Maximizing fluorescence collection efficiency in multiphoton microscopy. Opt Express. 2011;19:15348–15362. doi: 10.1364/OE.19.015348. [DOI] [PMC free article] [PubMed] [Google Scholar]
- 309.Benham GS. Practical aspects of objective lens selection for confocal and multiphoton digital imaging techniques. In: Matsumoto B, editor. Methods in Cell Biology. Vol. 70. Elsevier; 2002. pp. 245–299. Chap. 6. [DOI] [PubMed] [Google Scholar]
- 310.Juškaitis R. Characterizing high numerical aperture microscope objective lenses. In: Török P, Kao F-J, editors. Optical Imaging and Microscopy: Techniques and Advanced Systems. 2. Chap. 2. Springer; 2007. pp. 21–44. [Google Scholar]
- 311.Dong C-Y, Yu B, Kaplan PD, So PTC. Performances of high numerical aperture water and oil immersion objective in deep-tissue, multi-photon microscopic imaging of excised human skin. Microsc Res Tech. 2004;63:81–86. doi: 10.1002/jemt.10431. [DOI] [PubMed] [Google Scholar]
- 312.Field JJ, Sheetz KE, Chandler EV, Hoover EE, Young MD, Ding S-y, Sylvester AW, Kleinfeld D, Squier JA. Differential multi-photon laser scanning microscopy. IEEE J Sel Top Quantum Electron. 2012;18:14–28. doi: 10.1109/JSTQE.2010.2077622. [DOI] [PMC free article] [PubMed] [Google Scholar]
- 313.Dunn AK, Wallace VP, Coleno M, Berns MW, Tromberg BJ. Influence of optical properties on two-photon fluorescence imaging in turbid samples. Appl Opt. 2000;39:1194–1201. doi: 10.1364/ao.39.001194. [DOI] [PubMed] [Google Scholar]
- 314.Ducros M, van’t Hoff M, Evrard A, Seebacher C, Schmidt EM, Charpak S, Oheim M. Efficient large core fiber-based detection for multi-channel two-photon fluorescence microscopy and spectral unmixing. J Neurosci Methods. 2011;198:172–180. doi: 10.1016/j.jneumeth.2011.03.015. [DOI] [PubMed] [Google Scholar]
- 315.Combs CA, Smirnov AV, Riley JD, Gandjbakhche AH, Knutson JR, Balaban RS. Optimization of multiphoton excitation microscopy by total emission detection using a parabolic light reflector. J Microsc. 2007;228:330–337. doi: 10.1111/j.1365-2818.2007.01851.x. [DOI] [PubMed] [Google Scholar]
- 316.Combs CA, Smirnov A, Chess D, McGavern DB, Schroeder JL, Riley J, Kang SS, Lugar-Hammer M, Gandjbakhche A, Knutson JR, Balaban RS. Optimizing multiphoton fluorescence microscopy light collection from living tissue by noncontact total emission detection (epiTED) J Microsc. 2011;241:153–161. doi: 10.1111/j.1365-2818.2010.03411.x. [DOI] [PMC free article] [PubMed] [Google Scholar]
- 317.McMullen JD, Kwan AC, Williams RM, Zipfel WR. Enhancing collection efficiency in large field of view multiphoton microscopy. J Microsc. 2011;241:119–124. doi: 10.1111/j.1365-2818.2010.03419.x. [DOI] [PubMed] [Google Scholar]
- 318.Combs CA, Smirnov A, Glancy B, Karamzadeh NS, Gandjbakhche AH, Redford G, Kilborn K, Knutson JR, Balaban RS. Compact non-contact total emission detection for in vivo multiphoton excitation microscopy. J Microsc. 2014;253:83–92. doi: 10.1111/jmi.12099. [DOI] [PMC free article] [PubMed] [Google Scholar]
- 319.Tsai PS, Kleinfeld D. In vivo two-photon laser scanning microscopy with concurrent plasma-mediated ablation principles and hardware realization. In: Frostig RD, editor. In Vivo Optical Imaging of Brain Function. 2. Chap. 3. CRC Press; 2009. [PubMed] [Google Scholar]
- 320.Pupeza I. Power Scaling of Enhancement Cavities for Nonlinear Optics. Springer; 2012. [Google Scholar]
- 321.Geary J. Introduction to Lens Design: With Practical ZEMAX Examples. Willmann-Bell; 2002. [Google Scholar]
- 322.Greivenkamp JE. Field Guide to Geometrical Optics. SPIE; 2004. [Google Scholar]
- 323.Laikin M. Lens Design. 4. CRC Press; 2007. [Google Scholar]
- 324.Winston R. Light collection within the framework of geometrical optics. J Opt Soc Am. 1970;60:245–247. [Google Scholar]
- 325.Welford W, Windston R. High Collection Nonimaging Optics. Academic; 1989. [Google Scholar]
- 326.Zalewski EF. Radiometry and photometry. In: Bass M, Van Stryland EW, Williams DR, Wolfe WL, editors. Handbook of Optics, Vol. 2: Devices, Measurements, and Properties. 2. Chap. 24 McGraw-Hill; 1994. [Google Scholar]
- 327.Winston R, Minano J, Benitez P. Nonimaging Optics. Elsevier; 2005. [Google Scholar]
- 328.Chaves J. Introduction to Nonimaging Optics. CRC Press; 2008. [Google Scholar]
- 329.Jones RE., Jr Collection properties of generalized light concentrators. J Opt Soc Am. 1977;67:1594–1598. [Google Scholar]
- 330.Welford WT, Winston R. Two-dimensional nonimaging concentrators with refracting optics. J Opt Soc Am. 1979;69:917–919. [Google Scholar]
- 331.Miñano JC. Two-dimensional nonimaging concentrators with inhomogeneous media: a new look. J Opt Soc Am A. 1985;2:1826–1831. [Google Scholar]
- 332.Benítez P, Miñano JC. Ultrahigh-numerical-aperture imaging concentrator. J Opt Soc Am A. 1997;14:1988–1997. [Google Scholar]
- 333.Miñano JC, Benítez P, García F, Grabovickic D, Santamaría A, Pérez D. International Optical Design, OSA Technical Digest (CD) Optical Society of America; 2006. Geodesic lens: review and new designs for illumination engineering. paper TuD4. [Google Scholar]
- 334.Martin LC. Technical Optics Volume II. 2. Pitman; 1961. [Google Scholar]
- 335.Bellouard Y, Hongler M-O. Femtosecond-laser generation of self-organized bubble patterns in fused silica. Opt Express. 2011;19:6807–6821. doi: 10.1364/OE.19.006807. [DOI] [PubMed] [Google Scholar]
- 336.Art J. Photon detectors for confocal microscopy. In: Pawley JB, editor. Handbook of Biological Confocal Microscopy. 3. Chap. 12. Springer; 2006. pp. 251–264. [Google Scholar]
- 337.Yazdanfar S, So PTC. Signal detection and processing in nonlinear optical microscopes. In: Masters BR, So PTC, editors. Handbook of Biomedical Nonlinear Optical Microscopy. Chap. 12. Oxford University; 2008. pp. 283–310. [Google Scholar]
- 338.Savage N. Single-photon counting. Nat Photonics. 2009;3:738–739. [Google Scholar]
- 339.Liang R. Multimodal biomedical imaging systems. In: Liang R, editor. Biomedical Optical Imaging Technologies: Design and Applications. Chap. 9. Springer; 2013. pp. 297–350. [Google Scholar]
- 340.Zworykin V, Morton G, Malter L. The secondary emission multiplier-a new electronic device. Proc IRE. 1936;24:351–375. [Google Scholar]
- 341.Shockley W, Pierce J. A theory of noise for electron multipliers. Proc IRE. 1938;26:321–332. [Google Scholar]
- 342.Driscoll JD, Shih AY, Iyengar S, Field JJ, White GA, Squier JA, Cauwenberghs G, Kleinfeld D. Photon counting, censor corrections, and lifetime imaging for improved detection in two-photon microscopy. J Neurophysiol. 2011;105:3106–3113. doi: 10.1152/jn.00649.2010. [DOI] [PMC free article] [PubMed] [Google Scholar]
- 343.Hamamatsu Photonics K.K./Editorial Committee. Photomultiplier Tubes Basics and Applications. 3. Hamamatsu Photonics K.K./Electron Tube Division; 2007. [Google Scholar]
- 344.Wier WG, Balke CW, Michael JA, Mauban JR. A custom confocal and two-photon digital laser scanning microscope. Am J Physiol Heart Circ Physiol. 2000;278:H2150–H2156. doi: 10.1152/ajpheart.2000.278.6.H2150. [DOI] [PubMed] [Google Scholar]
- 345.Buehler C, Kim KH, Greuter U, Schlumpf N, So PTC. Single-photon counting multicolor multiphoton fluorescence microscope. J Fluoresc. 2005;15:41–51. doi: 10.1007/s10895-005-0212-z. [DOI] [PubMed] [Google Scholar]
- 346.Becker W, Stiel H, Klose E. Flexible instrument for time-correlated single-photon counting. Rev Sci Instrum. 1991;62:2991–2996. [Google Scholar]
- 347.Becker W, Hickl H, Zander C, Drexhage KH, Sauer M, Siebert S, Wolfrum J. Time-resolved detection and identification of single analyte molecules in microcapillaries by time-correlated single-photon counting (TCSPC) Rev Sci Instrum. 1999;70:1835–1841. [Google Scholar]
- 348.Becker W, Bergmann A, Hink MA, König K, Benndorf K, Biskup C. Fluorescence lifetime imaging by time-correlated single-photon counting. Microsc Res Tech. 2004;63:58–66. doi: 10.1002/jemt.10421. [DOI] [PubMed] [Google Scholar]
- 349.Becker W, Bergmann A, Biscotti GL, Rueck A. Advanced time-correlated single photon counting techniques for spectroscopy and imaging in biomedical systems. Proc SPIE. 2004;6047:604714. [Google Scholar]
- 350.Becker W, Bergmann A, Biscotti G, Koenig K, Riemann I, Kelbauskas L, Biskup C. High-speed FLIM data acquisition by time-correlated single-photon counting. Proc SPIE. 2004;5323:27–35. [Google Scholar]
- 351.Becker WB. Advanced Time-Correlated Single Photon Counting Techniques. 1. Springer; 2005. [Google Scholar]
- 352.Becker W, Bergmann A, Haustein E, Petrasek Z, Schwille P, Biskup C, Kelbauskas L, Benndorf K, Klöcker N, Anhut T, Riemann I, König K. Fluorescence lifetime images and correlation spectra obtained by multidimensional time-correlated single photon counting. Microsc Res Tech. 2006;69:186–195. doi: 10.1002/jemt.20251. [DOI] [PubMed] [Google Scholar]
- 353.Felekyan S, Kühnemuth R, Kudryavtsev V, Sandhagen C, Becker W, Seidel CAM. Full correlation from picoseconds to seconds by time-resolved and time-correlated single photon detection. Rev Sci Instrum. 2005;76:083104. [Google Scholar]
- 354.Margadant F. Display and presentation software. In: Pawley JB, editor. Handbook of Biological Confocal Microscopy. 3. Chap. 47. Springer; 2006. pp. 829–845. [Google Scholar]
- 355.White NS. Visualization systems for multi-dimensional microscopy images. In: Pawley JB, editor. Handbook of Biological Confocal Microscopy. 3. Chap. 14. Springer; 2006. pp. 280–315. [Google Scholar]
- 356.Cox G. Mass storage, display and hard copy. In: Pawley JB, editor. Handbook of Biological Confocal Microscopy. 3. Chap. 32. Springer; 2006. pp. 580–594. [Google Scholar]
- 357.Kleinfeld D, Mitra PP. Spectral methods for functional brain imaging. Cold Spring Harb Protoc. 2014;2014:248–262. doi: 10.1101/pdb.top081075. [DOI] [PubMed] [Google Scholar]
- 358.Mitra PP, Pesaran B. Analysis of dynamic brain imaging data. Biophys J. 1999;76:691–708. doi: 10.1016/S0006-3495(99)77236-X. [DOI] [PMC free article] [PubMed] [Google Scholar]
- 359.Mitra PP, Pesaran B, Kleinfeld D. Analysis of dynamic optical imaging data. In: Yuste R, Konnerth A, Lanni F, editors. Imaging Neurons: A Laboratory Manual. Chap. 9. Cold Spring Harbor Laboratory; 1999. pp. 9.1–9.9. [Google Scholar]
- 360.Mitra PP, Bokil H. Observed Brain Dynamics. Oxford University; 2007. [Google Scholar]
- 361.Mahou P, Zimmerley M, Loulier K, Matho KS, Labroille G, Morin X, Supatto W, Livet J, Débarre D, Beaurepaire E. Multicolor two-photon tissue imaging by wavelength mixing. Nat Methods. 2012;9:815–818. doi: 10.1038/nmeth.2098. [DOI] [PubMed] [Google Scholar]
- 362.Dickinson ME, Bearman G, Tille S, Lansford R, Fraser SE. Multi-spectral imaging and linear unmixing add a whole new dimension to laser scanning fluorescence microscopy. Biotechniques. 2001;31:1272, 1274–1276, 1278. doi: 10.2144/01316bt01. [DOI] [PubMed] [Google Scholar]
- 363.Zimmermann T, Rietdorf J, Pepperkok R. Spectral imaging and its applications in live cell microscopy. FEBS Lett. 2003;546:87–92. doi: 10.1016/s0014-5793(03)00521-0. [DOI] [PubMed] [Google Scholar]
- 364.Zimmerman T. Spectral imaging and linear unmixing in light microscopy. In: Rietdorf J, editor. Microscopy Techniques. Springer; 2005. pp. 245–265. [DOI] [PubMed] [Google Scholar]
- 365.Brenner MH, Cai D, Swanson JA, Ogilvie JP. Two-photon imaging of multiple fluorescent proteins by phase-shaping and linear unmixing with a single broadband laser. Opt Express. 2013;21:17256–17264. doi: 10.1364/OE.21.017256. [DOI] [PMC free article] [PubMed] [Google Scholar]
- 366.Zimmermann T, Marrison J, Hogg K, O’Toole P. Clearing up the signal: spectral imaging and linear unmixing in fluorescence microscopy. Methods Mol Bio. 2014;1075:129–148. doi: 10.1007/978-1-60761-847-8_5. [DOI] [PubMed] [Google Scholar]
- 367.Life Technologies. Fluorescence SpectraViewer. http://www.lifetechnologies.com/us/en/home/life-science/cell-analysis/labeling-chemistry/fluorescence-spectraviewer.html, retrieved September 3, 2014.
- 368.Nguyen QT, Tsai PS, Kleinfeld D. MPScope: A versatile software suite for multiphoton microscopy. J Neurosci Methods. 2006;156:351–359. doi: 10.1016/j.jneumeth.2006.03.001. [DOI] [PubMed] [Google Scholar]
- 369.Nguyen Q-T, Driscoll J, Dolnick EM, Kleinfeld D. MPScope 2.0: a computer system for two-photon laser scanning microscopy with concurrent plasma-mediated ablation and electrophysiology. In: Frostig RD, editor. In Vivo Optical Imaging of Brain Function. 2. Chap. 4. CRC Press; 2009. [PubMed] [Google Scholar]
- 370.Kleinfeld D. David Kleinfeld Laboratory at UC San Diego. https://physics.ucsd.edu/neurophysics/software.php, retrieved February 17, 2015.
- 371.Botcherby E, Juškaitis R, Wilson T. Scanning two photon fluorescence microscopy with extended depth of field. Opt Commun. 2006;268:253–260. [Google Scholar]
- 372.Albert O, Sherman L, Mourou G, Norris TB, Vdovin G. Smart microscope: an adaptive optics learning system for aberration correction in multiphoton confocal microscopy. Opt Lett. 2000;25:52–54. doi: 10.1364/ol.25.000052. [DOI] [PubMed] [Google Scholar]
- 373.Neil MAA, Juskaitis R, Booth MJ, Wilson T, Tanaka T, Kawata S. Adaptive aberration correction in a two-photon microscope. J Microsc. 2000;200:105–108. doi: 10.1046/j.1365-2818.2000.00770.x. [DOI] [PubMed] [Google Scholar]
- 374.Sherman L, Ye JY, Albert O, Norris TB. Adaptive correction of depth-induced aberrations in multiphoton scanning microscopy using a deformable mirror. J Microsc. 2002;206:65–71. doi: 10.1046/j.1365-2818.2002.01004.x. [DOI] [PubMed] [Google Scholar]
- 375.Marsh P, Burns D, Girkin J. Practical implementation of adaptive optics in multiphoton microscopy. Opt Express. 2003;11:1123–1130. doi: 10.1364/oe.11.001123. [DOI] [PubMed] [Google Scholar]
- 376.Wright AJ, Burns D, Patterson BA, Poland SP, Valentine GJ, Girkin JM. Exploration of the optimisation algorithms used in the implementation of adaptive optics in confocal and multiphoton microscopy. Microsc Res Tech. 2005;67:36–44. doi: 10.1002/jemt.20178. [DOI] [PubMed] [Google Scholar]
- 377.Booth MJ. Adaptive optics in microscopy. Phil Trans R Soc A. 2007;365:2829–2843. doi: 10.1098/rsta.2007.0013. [DOI] [PubMed] [Google Scholar]
- 378.Débarre D, Botcherby EJ, Watanabe T, Srinivas S, Booth MJ, Wilson T. Image-based adaptive optics for two-photon microscopy. Opt Lett. 2009;34:2495–2497. doi: 10.1364/ol.34.002495. [DOI] [PMC free article] [PubMed] [Google Scholar]
- 379.Field JJ, Planchon TA, Amir W, Durfee CG, Squier JA. Characterization of a high efficiency, ultrashort pulse shaper incorporating a reflective 4096-element spatial light modulator. Opt Commun. 2007;278:368–376. doi: 10.1016/j.optcom.2007.06.034. [DOI] [PMC free article] [PubMed] [Google Scholar]


