

In this study, Dayton et al. generated mice lacking PKM2, an isoform of pyruvate kinase, and found that, over time, the mice develop a metabolic syndrome that leads to spontaneous hepatocellular carcinomas (HCCs). These results provide new insights into the role of PKM2 in the regulation of systemic metabolic homeostasis and inflammation.
Keywords: HCC, PKM2, metabolism
Abstract
Alternative splicing of the Pkm gene product generates the PKM1 and PKM2 isoforms of pyruvate kinase (PK), and PKM2 expression is closely linked to embryogenesis, tissue regeneration, and cancer. To interrogate the functional requirement for PKM2 during development and tissue homeostasis, we generated germline PKM2-null mice (Pkm2−/−). Unexpectedly, despite being the primary isoform expressed in most wild-type adult tissues, we found that Pkm2−/− mice are viable and fertile. Thus, PKM2 is not required for embryonic or postnatal development. Loss of PKM2 leads to compensatory expression of PKM1 in the tissues that normally express PKM2. Strikingly, PKM2 loss leads to spontaneous development of hepatocellular carcinoma (HCC) with high penetrance that is accompanied by progressive changes in systemic metabolism characterized by altered systemic glucose homeostasis, inflammation, and hepatic steatosis. Therefore, in addition to its role in cancer metabolism, PKM2 plays a role in controlling systemic metabolic homeostasis and inflammation, thereby preventing HCC by a non-cell-autonomous mechanism.
Changes in metabolism accompany uncontrolled proliferation associated with tumor growth and progression (Hanahan and Weinberg 2011). Cancer cells rewire metabolism to meet the anabolic requirements of cell proliferation (Cairns et al. 2011). One of the main metabolic aberrations associated with cancer is a fundamental change in glucose metabolism. In particular, isoform selection of the glycolytic enzyme pyruvate kinase (PK) impacts the fate of glucose in cells and has been implicated in the metabolic phenotype of cancer cells. Two separate genes encode PK enzymes in mammals, and each gene gives rise to two isoforms (Takenaka et al. 1996). The Pklr gene encodes PKL, which is expressed mainly in hepatocytes and some cell types in the kidney, intestine, and pancreas, and PKR, which is expressed in erythrocytes. The Pkm gene encodes PKM1 and PKM2 through mutually exclusive alternative splicing of exons 9 and 10 of this gene (Noguchi et al. 1987).
While PKM1 is often referred to as the adult-specific isoform, PKM2 has been shown to be expressed during embryogenesis, tissue regeneration, and tumor development (Mazurek 2011). However, the expression pattern of the two different PKM isoforms across adult tissues and cell types is incomplete. While some reports suggest that PKM2 expression is unique to cancer cells and other proliferating cell types (Lu 2012; Yang et al. 2012c; Wong et al. 2014), many other studies contradict this generalization and report PKM2 expression in select normal tissues (Clower et al. 2010; David et al. 2010; Mazurek 2011). Perhaps as a consequence of the uncertainty surrounding its expression in adult cell types and the lack of a definitive characterization in major adult tissues, relatively few studies have focused on the role of PKM2 in normal proliferating cells (e.g., embryo and intestine) or in the normal quiescent tissues that express PKM2.
Although PKM1 and PKM2 differ by only a single exon, their enzymatic activity is regulated very differently. Whereas PKM1 is a constitutively active enzyme, PKM2 enzymatic activity is regulated by a variety of allosteric effectors and post-translational modifications (Christofk et al. 2008b; Lv et al. 2011; Mazurek 2011; Chaneton et al. 2012). Due to its near universal expression in cancer, PKM2 has been extensively studied in this context. In particular, the different consequences of PKM1 expression versus PKM2 expression suggest that the ability to regulate PK enzymatic activity makes PKM2 more permissive of the metabolic state required of proliferation. Replacement of PKM2 with PKM1 in cultured cells influences how glucose is metabolized, limiting flux through anabolic pathways and thereby preventing xenograft tumor formation (Christofk et al. 2008a; Lunt et al. 2015). Increased PK activity through small molecule activation of PKM2 also impairs tumor growth in mice (Anastasiou et al. 2012). Furthermore, potential nonglycolytic functions of PKM2 have been proposed (Luo et al. 2011; Yang et al. 2011, 2012a,b,c; Gao et al. 2012; Lu 2012; Keller et al. 2014) but are controversial (Hosios et al. 2015). Despite numerous studies of PKM2 in cultured tumor cells, whether PKM2 is required for cell proliferation in vivo remains a topic of debate. This question is relevant to the potential of PKM2 as a therapeutic target for cancer and other human diseases.
In this study, we provide conclusive evidence that PKM2 expression is widespread in both mouse and human adult tissues, with distinct and cell type-specific expression patterns of PKM isoforms that suggest nonredundant functional requirements in different cell types. Nonetheless, complete loss of PKM2 using a genetically engineered mouse model is compatible with normal development. In-depth analysis of aging PKM2-null (Pkm2−/−) animals revealed an unexpected role for PKM2 in controlling systemic glucose homeostasis. Moreover, Pkm2−/− mice develop late-onset spontaneous hepatocellular carcinomas (HCCs) with high frequency, recapitulating the correlation between metabolic disease and HCCs observed in humans. Further molecular analysis revealed some of the gene expression and metabolite changes that precede liver tumorigenesis, establishing aging Pkm2−/− mice as a model for how progressive systemic metabolic aberrations and hepatocyte non-cell-autonomous changes can lead to the development of HCCs.
Results
Germline loss of PKM2 leads to PKM1 expression and is compatible with normal mouse development
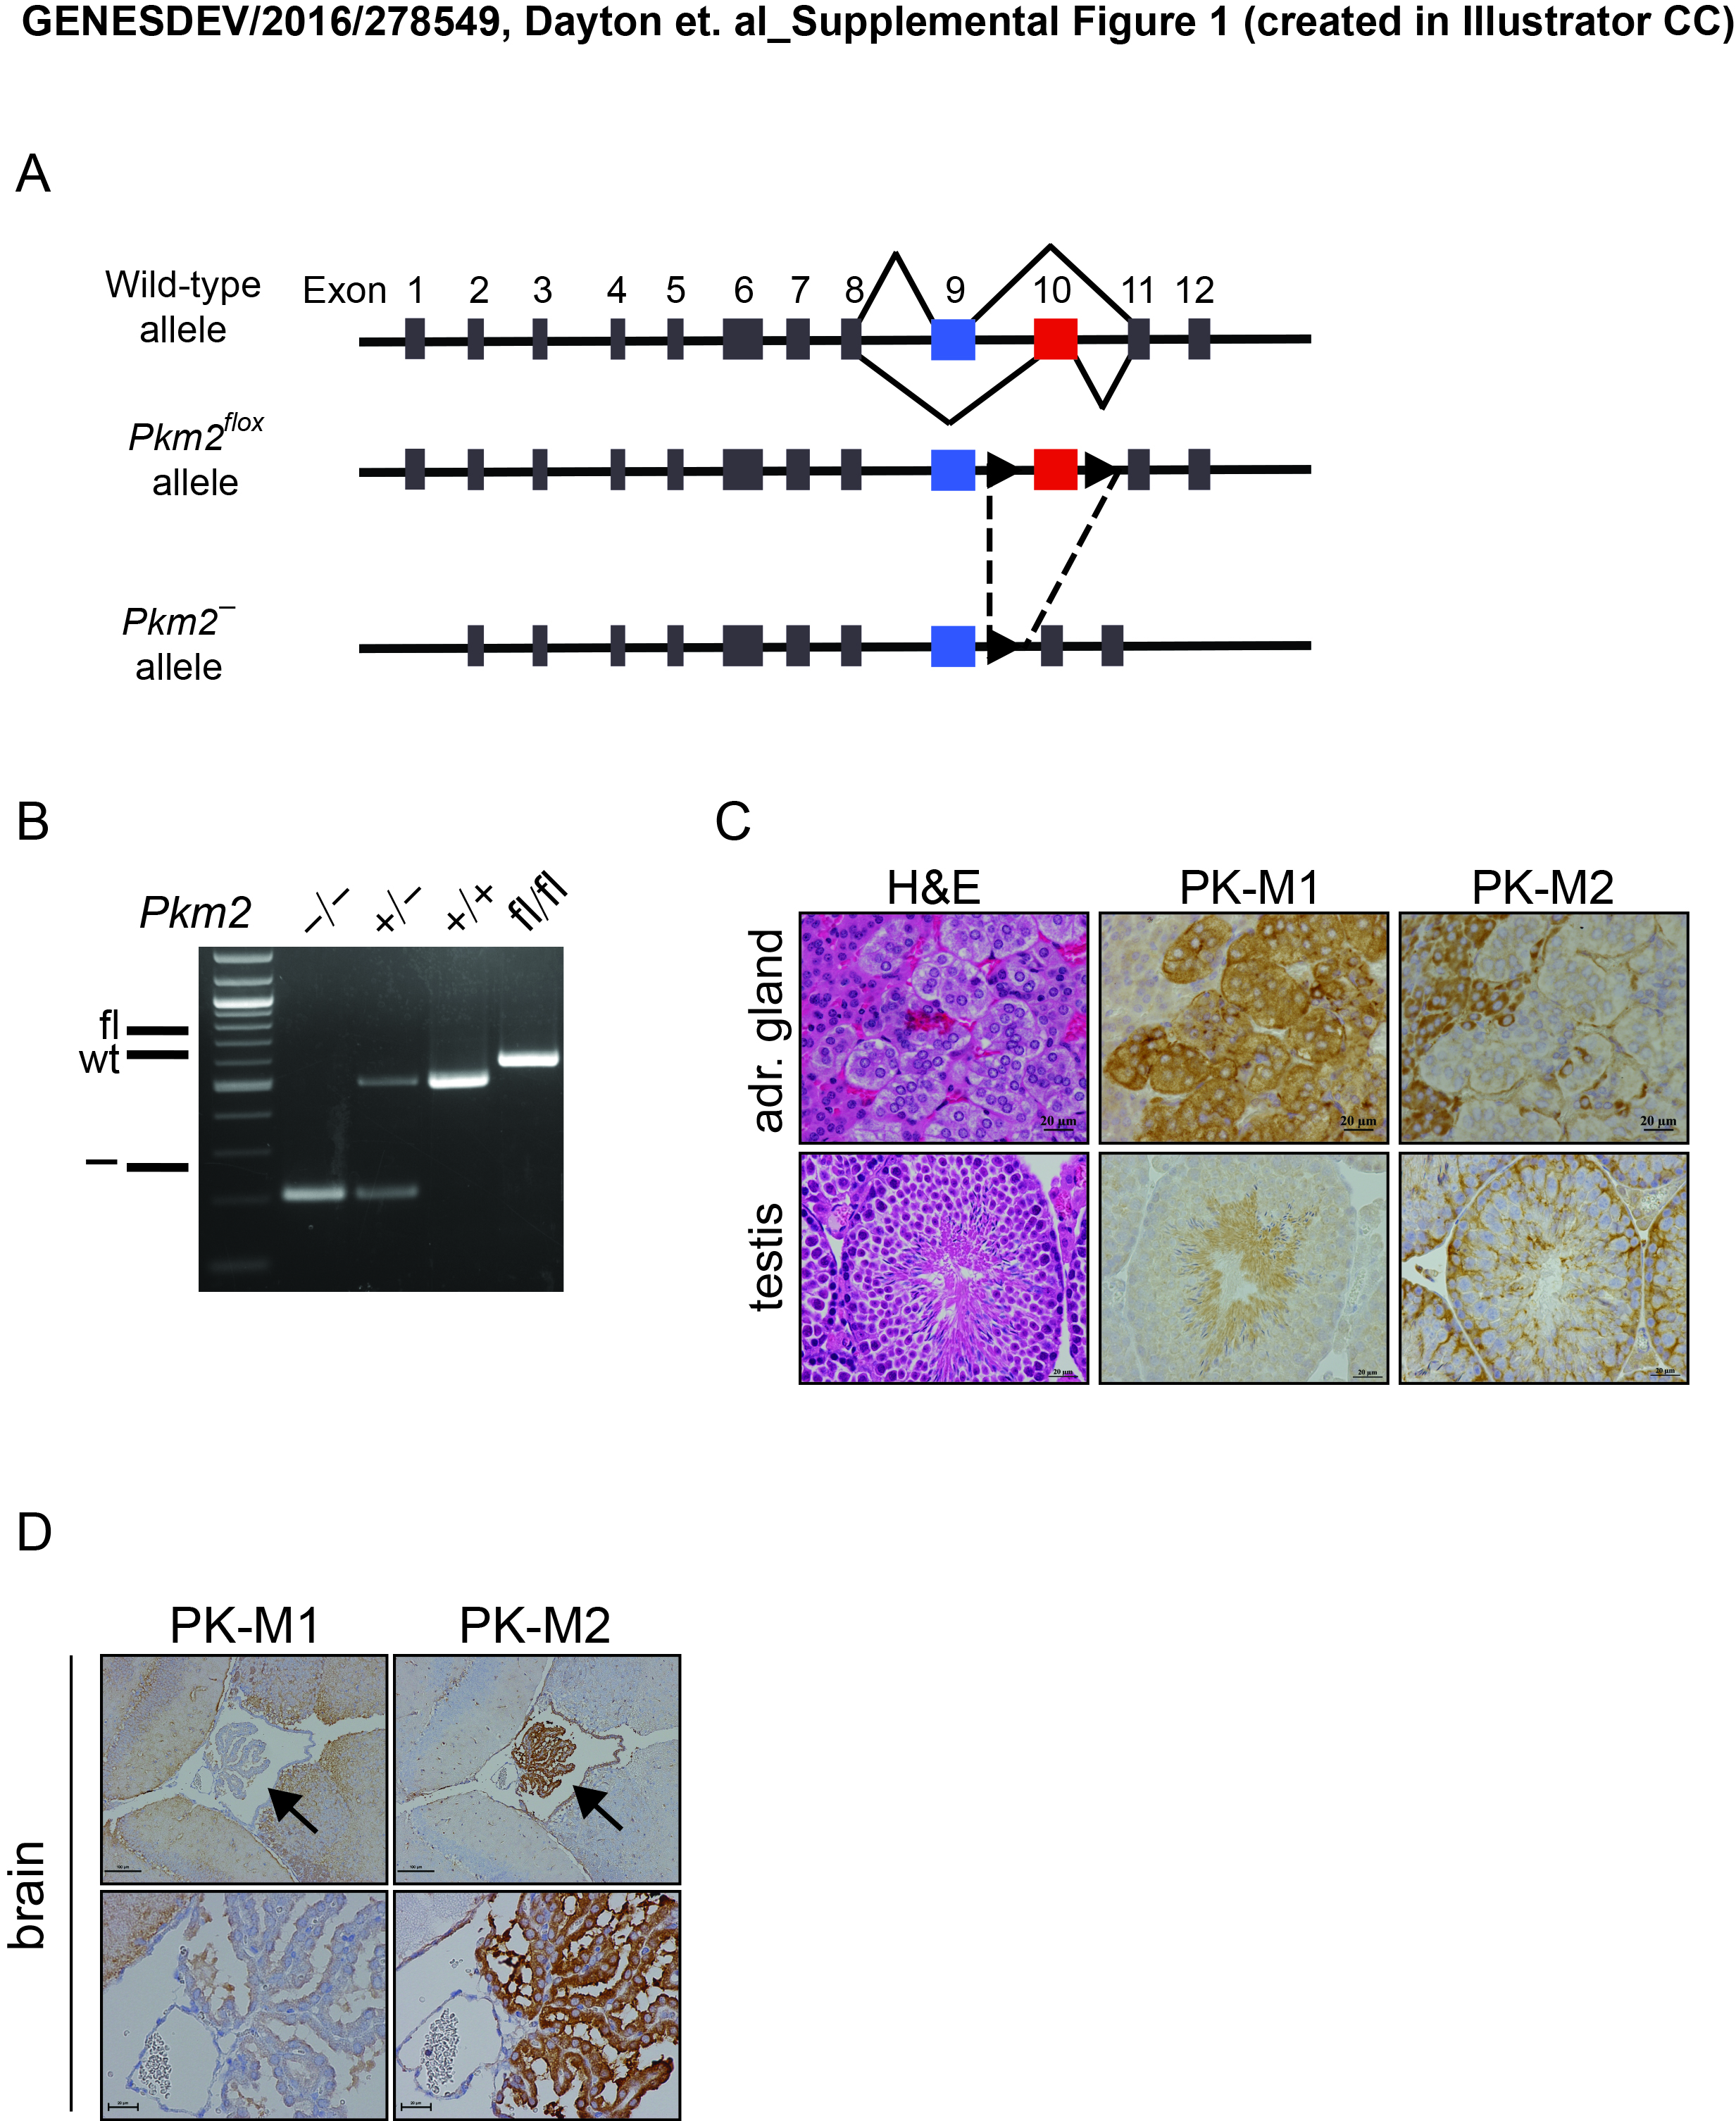
To investigate the role of PKM2 in adult mice, we crossed mice with a Pkm2 conditional allele (Israelsen et al. 2013) to mice carrying a Cre transgene under the EIIA promoter (Lakso et al. 1996) in order to generate mice heterozygous for a germline loss-of-function Pkm2 (Pkm2−) allele (Supplemental Fig. S1A). Importantly, this Pkm2− allele does not prevent expression of PKM1 (Israelsen et al. 2013). Pkm2 heterozygotes (Pkm2+/−) were intercrossed to generate homozygous (Pkm2−/−) mice (Supplemental Fig. S1B). Despite the fact that PKM2 is the primary isoform expressed in the embryo (Mazurek 2011), we found that Pkm2−/− mice were viable, grossly normal, and born at the expected 1:2:1 Mendelian ratio (Table 1).
Table 1.
Litters from Pkm2+/− crosses show Mendelian ratios

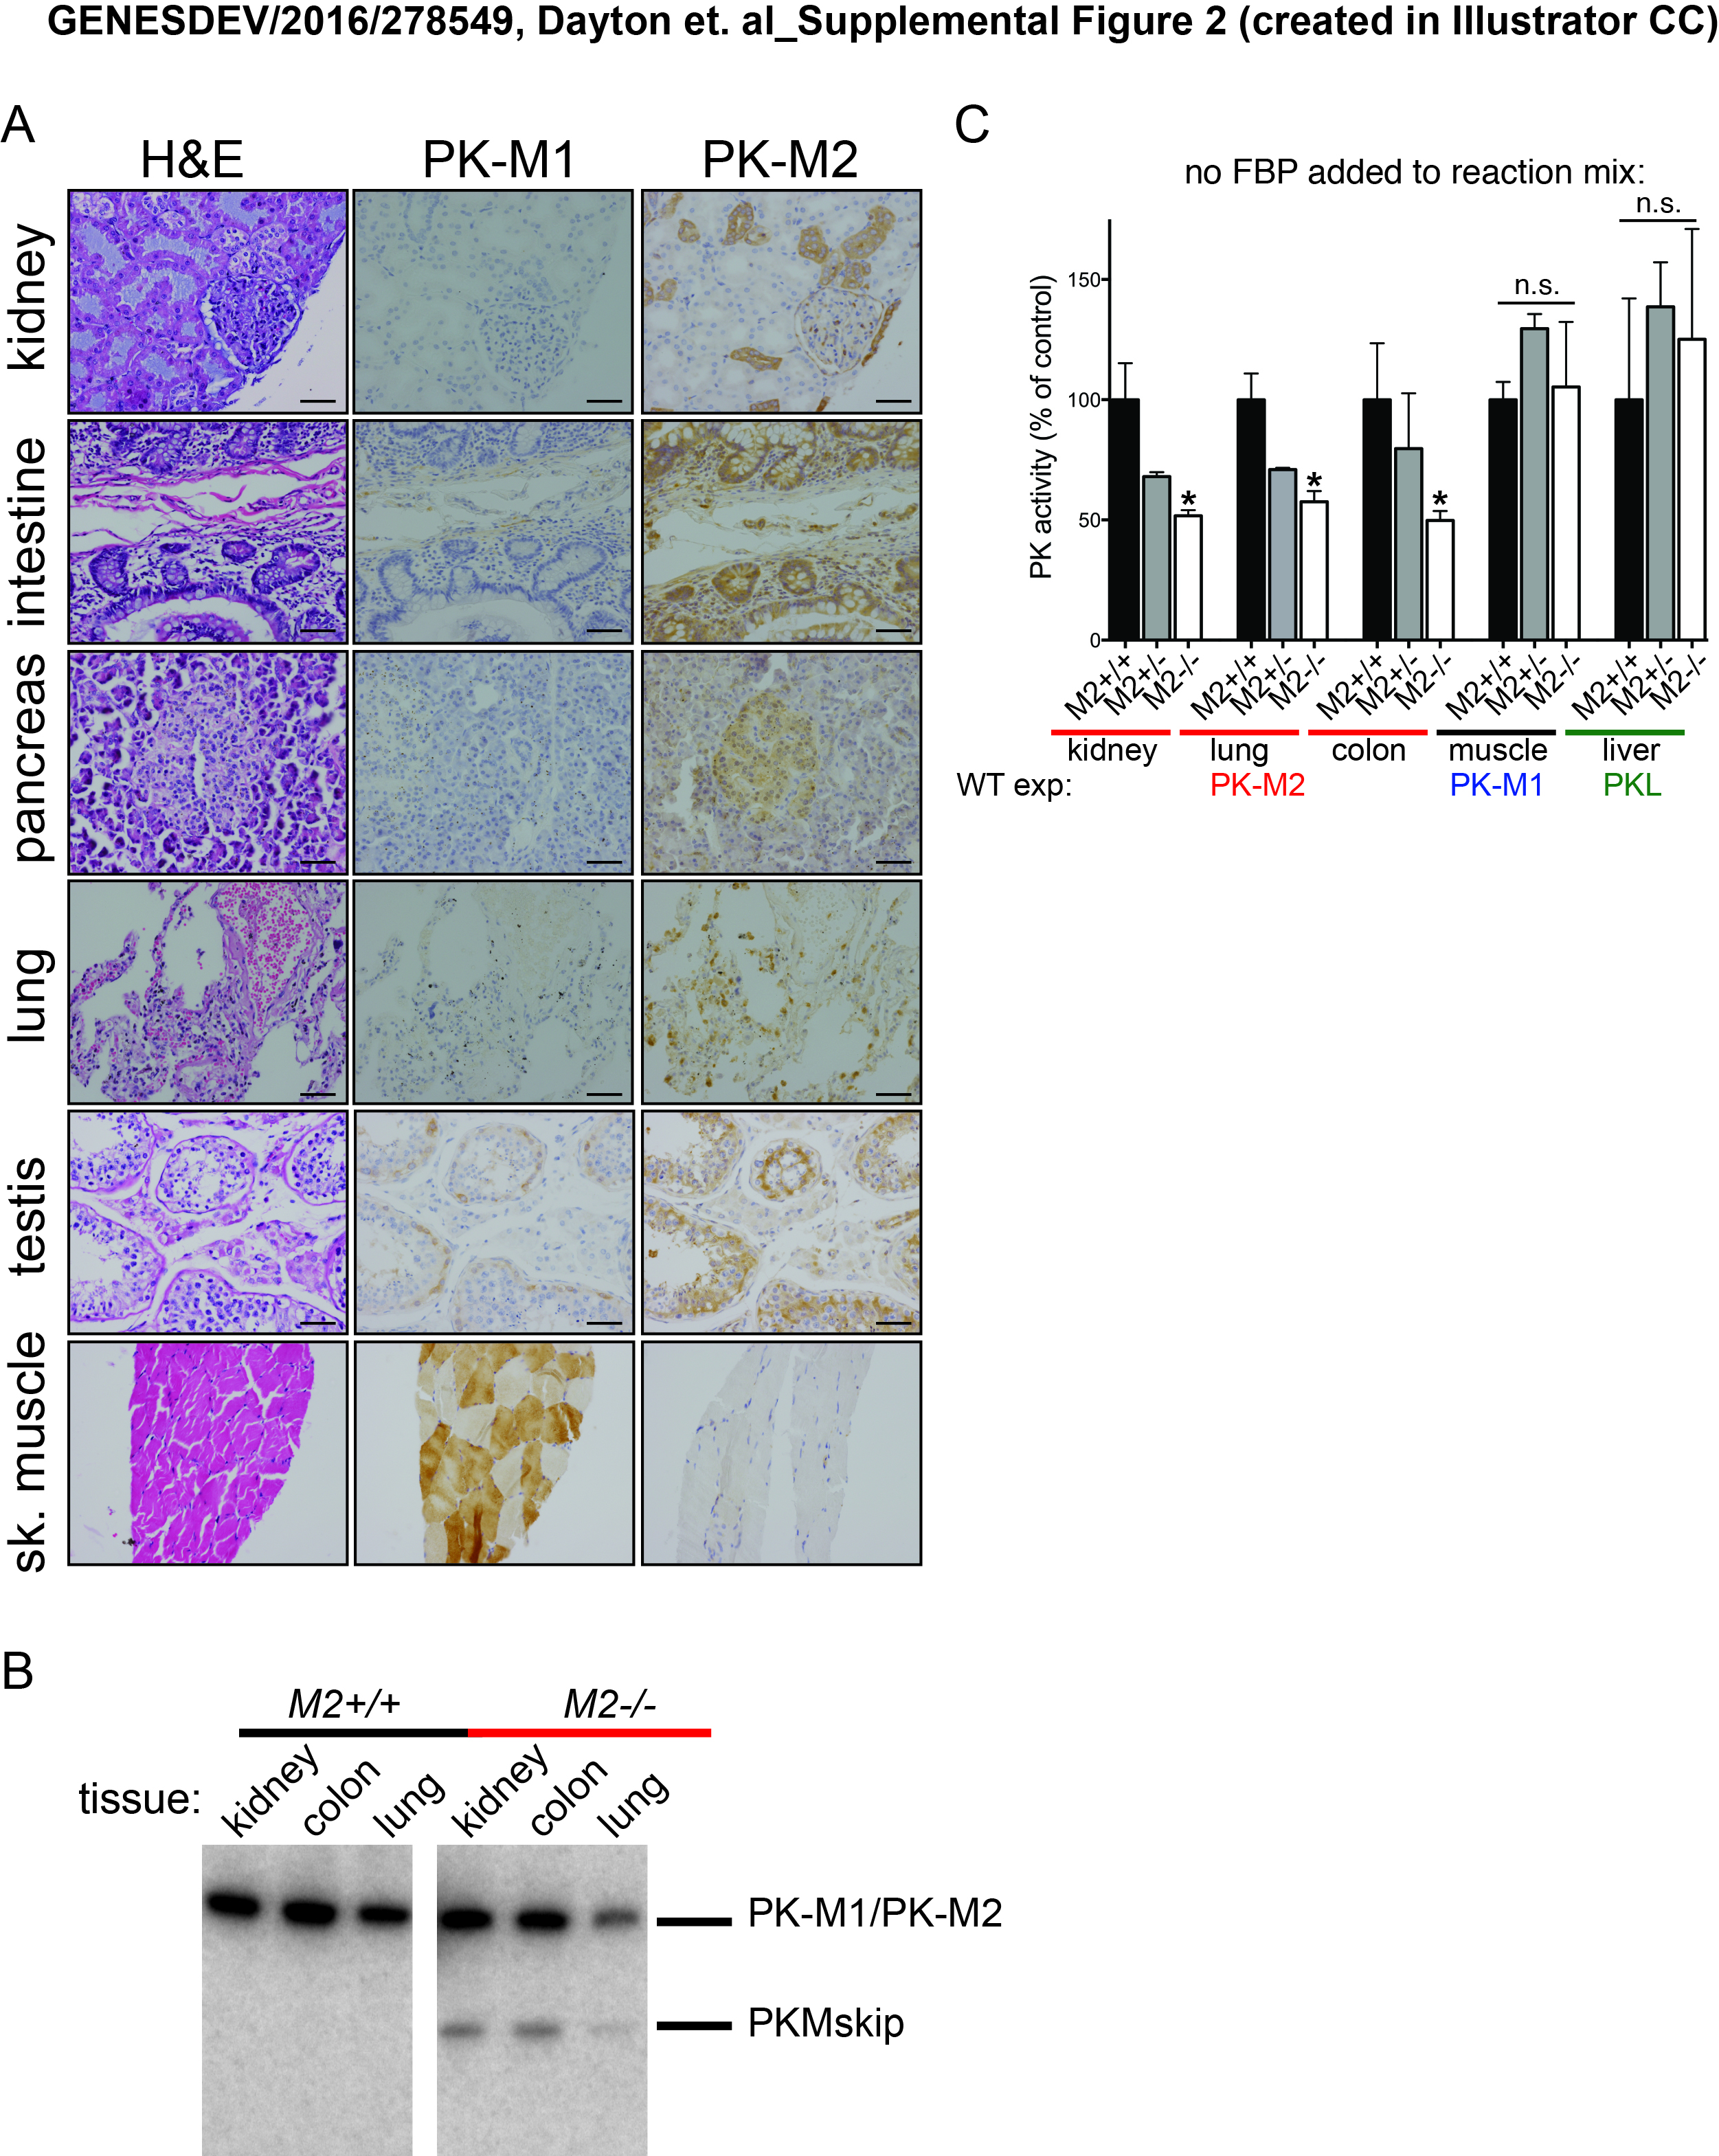
To characterize expression of PKM1 and PKM2 in wild-type and Pkm2−/− mice at the cell and tissue level, we performed immunohistochemistry (IHC) staining of embryonic day 14.5 (E14.5) mouse embryos using antibodies specific to either PKM1 or PKM2. With the exception of cells in the fetal liver, all cells in wild-type embryos expressed PKM2 (Fig. 1A). Pkm2−/− embryos, on the other hand, expressed PKM1, suggesting that PKM1 expression in this context is compatible with embryonic development. While PKM2 is the predominant isoform in most wild-type adult tissues, PKM1 was the predominant isoform in all of the adult Pkm2−/− tissues examined (Fig. 1B,C). IHC analysis of adult wild-type tissues identified specific PKM2-expressing cell types within select tissues, including kidney tubular cells, intestinal epithelial cells, pancreatic islet cells, and lung epithelial cells (Fig. 1C). Analysis of the same tissues isolated from Pkm2−/− mice revealed PKM1 expression in these cell types. Other PKM2-expressing cell types in wild-type mice include spermatogonia, the cortex cells of the adrenal glands, and the choroid plexus cells of the brain (Supplemental Fig. S1C,D).
Figure 1.
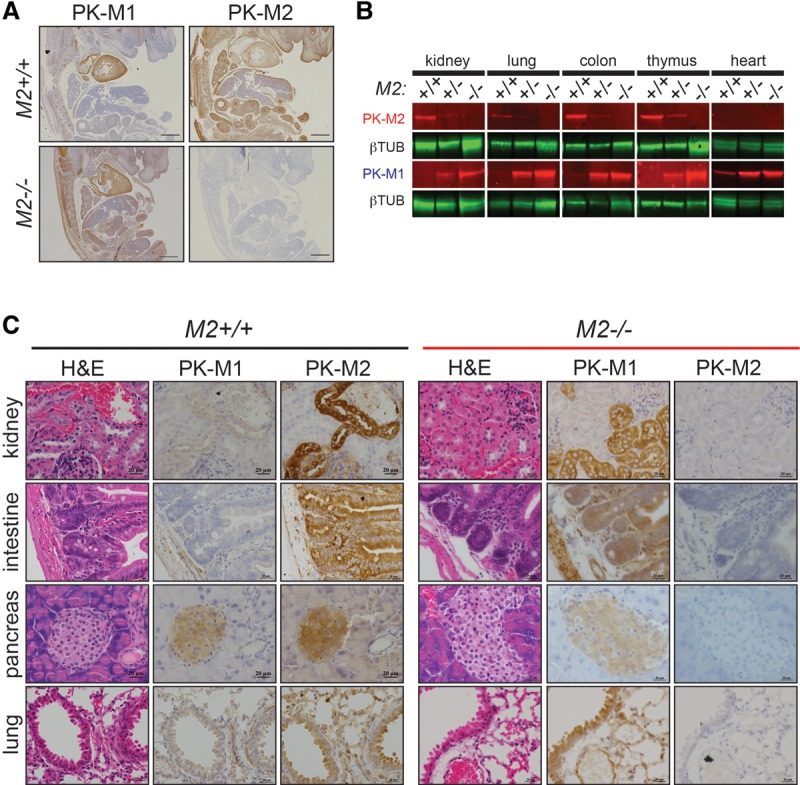
Germline loss of PKM2 leads to expression of PKM1. (A) Representative images of IHC for PKM1 and PKM2 in wild-type (M2+/+) and Pkm2-deficient (M2−/−) mouse embryos harvested at E14.5. Bars, 500 μm. (B) Western blot analysis for PKM2 protein on tissue lysates from M2+/+, M2+/−, or M2−/− mice. β-Tubulin was used as a loading control. (C) Representative images of IHC for PKM1 and PKM2 in M2+/+ (left set of panels) and M2−/− (right set of panels) tissues. Corresponding hematoxylin and eosin (H&E) images are shown. Bars, 20 μm.
To validate the PK isoform expression patterns noted in adult wild-type mouse tissues by an independent method and determine whether human tissues show a similar expression pattern, we analyzed two publicly available data sets with tissue-specific RNA-sequencing (RNA-seq) data present for both mouse and human tissues (The ENCODE Project Consortium 2012; Illumina Human Body Map 2.0). Low inclusion of the PKM1-specific exon 9 was observed in most tissues (Fig. 2A,B), confirming that PKM2 is the predominant isoform in many adult mouse and human tissues. The human RNA-seq data were also consistent with expression analysis of human tissue by IHC for PKM1 and PKM2 (Supplemental Fig. S2A).
Figure 2.

PKM2 is the predominant isoform in mouse and human tissues, and germline loss of PKM2 leads to decreased levels of total PK. RNA-seq read coverage across Pkm exons 8–11 of adult mouse tissue (A) and PKM exons 8–11 of adult human tissue (B). MISO (Katz et al. 2010) percentage spliced-in (Ψ) values for inclusion of exon 9 (corresponding to the Pkm1 isoform) are shown at the right for each tissue. The regions that correspond to each exon and the direction of transcription are indicated below. (C) Expression of PKM1, PKM2, and total Pkm mRNA in tissue isolated from M2+/+, M2+/−, or M2−/− mice was assessed by quantitative RT–PCR (qRT–PCR). (D) PK enzymatic activity assays in kidney, lung, colon, skeletal muscle (gastrocnemius), or liver tissue lysates isolated from M2+/+, M2+/−, or M2−/− mice. For C and D, P-values using unpaired t-test are shown. (*) P < 0.05; (**) P < 0.01. n = 3 mice.
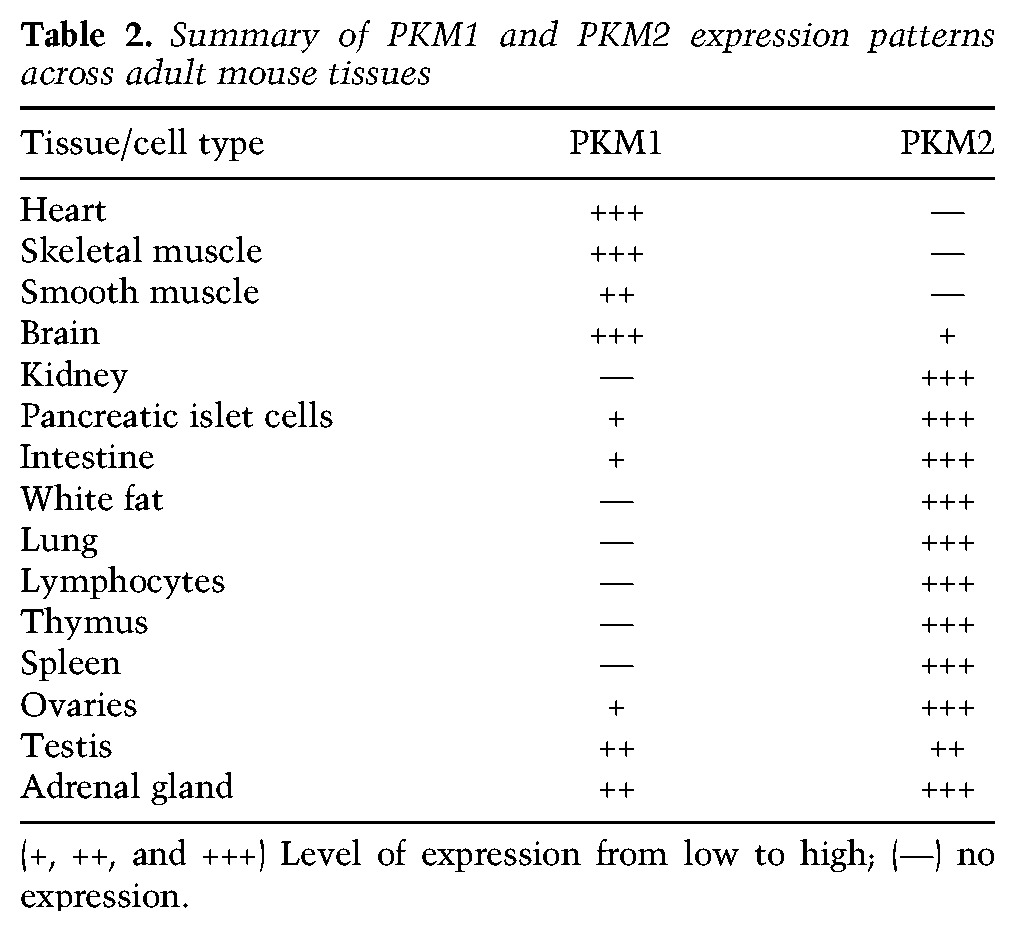
In agreement with the protein analysis of PK isoform expression in wild-type and Pkm2−/− mice, quantitative RT–PCR (qRT–PCR) analysis of the same tissue revealed a switch from PKM2 to PKM1 in Pkm2−/− tissues (Fig. 2C). Similarly, the transcript levels for PKM1 were dramatically increased in Pkm2−/− tissues relative to wild-type tissues. This quantitative approach also revealed that the levels of total Pkm transcripts were reduced in null tissues compared with wild type (Fig. 2C). Lower Pkm transcript levels in Pkm2−/− mouse tissues might be explained in part by the observation that a percentage of the transcripts from the Pkm2− locus results in exon skipping that generates PKMskip (Supplemental Fig. S2B), an mRNA species that is degraded by nonsense-mediated decay (Israelsen et al. 2013). Interestingly, the decrease in total levels of Pkm transcripts was accompanied by a reduction in the maximum rate of reaction (Vmax) for PK enzyme activity in Pkm2−/− tissue lysates from the kidney, lung, and colon (Fig. 2D; Supplemental Fig. S2C). The decrease in PK enzymatic activity appears to be specific to Pkm2−/− tissue that normally expresses PKM2, as there was no change in the PK enzymatic activity of lysates from Pkm2−/− skeletal muscle or liver tissue compared with wild type (tissues that express PKM1 and PKL, respectively). Collectively, these data demonstrate that PKM2 expression is not restricted to or necessary for the viability of proliferative cells or tissues that have a high rate of cell turnover (Table 2).
Table 2.
Summary of PKM1 and PKM2 expression patterns across adult mouse tissues
PKM2-null mice develop late-onset spontaneous HCC
Since Pkm2−/− mice did not display any overt developmental defects, we examined the consequences of PKM2 loss in adult mice. Pathological analysis of the lungs, liver, kidneys, intestines, heart, skeletal muscle, spleen, pancreas, brain, and reproductive organs from young homozygous mutant mice did not reveal any morphological differences (data not shown). Strikingly, however, aged PKM2-deficient mice displayed a dramatic incidence of liver tumors. Macroscopic inspection of livers from Pkm2−/− mice between 55 and 94 wk of age revealed that many aged Pkm2−/− mice developed multiple macroscopic liver tumors that occupy between 30% and 80% of the liver (Fig. 3A). Histological analysis indicated that the tumors were low- to mid-grade HCCs with a high proliferative index, as revealed by incorporation of 5-bromodeoxyuridine (BrdU) (Fig. 3B,C). Moreover, we identified various histological patterns showing that there was heterogeneity across tumor lesions even within the same liver (Fig. 3B). Interestingly, there was a clear gender disparity with regard to the incidence of HCC. Whereas 65% of aged Pkm2−/− male mice developed HCC, only 22% of the age-matched female littermates exhibited this phenotype (five out of 23 mice) (Supplemental Fig. S3A). Age-matched male and female mice heterozygous for the Pkm2-null allele also developed tumors, albeit with a lower incidence (33% and 14%, respectively). By comparison, small adenomas were occasionally observed in aged wild-type mice, but none progressed to HCC (Fig. 3D).
Figure 3.

Aged PKM2-null mice develop spontaneous HCC with high penetrance. (A) Representative macroscopic images of livers harvested from aged wild-type or M2−/− mice. The table indicates the frequency of HCC in male mice, as identified at necropsy. (B) Representative H&E images of liver tumors from aged M2−/− mice. Bars: left images, 100 μm; right images, 20 μm. (C) Quantification of BrdU-positive cells in the livers and HCC sections of aged M2+/+ or M2−/− mice. A representative 10× image of IHC for BrdU in an M2−/− tumor is shown. Bar, 100 μm. Means and P-value using unpaired t-test are indicated. (****) P < 0.0001. (D) Summary of hepatic adenoma and HCC incidence in M2+/+ and M2−/− male mice. (E) Dual-color IHC for PKM1 (brown) and total HNF4α (purple) in M2−/− HCC. Bars: left, 100 μm; right, 20 μm. (F) Representative images of IHC for β-catenin, pERK, p53, or NQO1 on M2−/− HCC. Bar, 20 μm. (Bottom right) Expression of Nqo1 mRNA as determined by qRT–PCR in wild-type livers, M2−/− livers, or M2−/− HCC. Mean ± SEM and P-values using unpaired t-test are shown. (*) P < 0.05. (G) Quantification of IHC results for different markers of active oncogenic pathways.
The observation that Pkm2−/− mice developed spontaneous HCCs was unexpected for multiple reasons. Although a subset of HCCs is thought to arise from hepatic progenitor cells (HPCs), most HCCs arise from differentiated hepatocytes (Tschaharganeh et al. 2014; Marquardt et al. 2015). The PK isoform expression of HPCs is unknown; however, differentiated hepatocytes do not express PKM2 (Supplemental Fig. S3B–D) but instead express the liver-specific PKL isoform (Mazurek 2011). Furthermore, previous reports have suggested that formation of HCCs involves a change in PK isoform expression from PKL to PKM2 (Hacker et al. 1998; Wong et al. 2014). Therefore, we hypothesized that HCCs in Pkm2−/− mice express PKM1.
To investigate the PK expression pattern of tumors and livers from Pkm2−/− and wild-type mice and distinguish tumor cells and differentiated hepatocytes from stromal cells, we performed dual-color IHC for a marker of hepatocyte differentiation, HNF4α, with PKM1 or PKM2 antibodies (Fig. 3E; Supplemental Fig. S3C,E). We found that while Pkm2−/− tumors contained cells that expressed PKM1, the majority of these cells were not tumor cells (Fig. 3E). In fact, colocalization of HNF4α and PKM1 was only occasionally observed in tumors from Pkm2−/− mice. The majority of PKM1-expressing cells present in both tumors and non-tumor-bearing livers from Pkm2−/− mice were stromal cells.
Our observations in Pkm2−/− HCC raised the possibility that PKM2 might not be the predominant isoform in the benign liver lesions found in wild-type mice. In fact, the expression pattern for PKM2 in both wild-type livers and liver adenomas was similar to the PKM1 expression pattern found in Pkm2−/− livers and HCC (Supplemental Fig. S3F). To determine whether these observations were relevant to the human disease, we analyzed RNA-seq data from human HCCs (The Cancer Genome Atlas [TCGA]; https://tcga-data.nci.nih.gov/tcga), and performed IHC for PKM2 on primary human tumor sections (Supplemental Fig. S3G,H). Both analyses revealed heterogeneous PKM2 expression across human HCCs, with some tumors showing very high expression of PKM2 and others showing very low levels of PKM2. These data argue that increased PKM2 expression is not a universal feature of hepatic neoplasia in mice or humans. Furthermore, Pkm2−/− mice develop spontaneous HCC in which neither PKM isoform is significantly expressed, arguing that PKM2 is not required for the growth of benign or malignant liver tumors.
HCCs in PKM2-null mice show diverse oncogenic driver events
The fact that PKM2 is not expressed in benign liver lesions from wild-type mice and that PKM1 is not the predominant isoform expressed in HCC from Pkm2−/− mice raised the possibility that HCC in Pkm2−/− mice was arising from a stochastic process influenced by non-cell-autonomous factors. Therefore, we asked whether HCCs in Pkm2−/− mice shared common molecular changes. Recent exome sequencing of human HCCs has identified 11 recurrently altered pathways, including WNT/β-catenin, Tp53/cell cycle, oxidative stress, mitogen-activated protein kinase (MAPK), and interleukin (IL)-6/JAK–STAT (Schulze et al. 2015). To determine whether tumors from Pkm2−/− mice exhibited alterations in these pathways, we performed targeted qRT–PCR and IHC analysis (Fig. 3F,G). IHC of β-catenin in tumors from Pkm2−/− mice revealed cells with nuclear localization of β-catenin in more than half of the tumors analyzed. Next, we assessed MAPK signaling by IHC for phosphorylated p42/p44 MAPK (pERK) and detected pathway activation in 13 out of 29 tumors. We also found one tumor that showed strong nuclear staining for p53, potentially indicative of a p53 mutation (Olive et al. 2004). Finally, we interrogated changes in the oxidative stress pathway in Pkm2−/− tumors through qRT–PCR and IHC analysis of Nqo1, a canonical Nrf2 target gene. Out of seven tumors analyzed, five had increased Nqo1 levels compared with healthy wild-type and Pkm2−/− livers. Some tumors also showed up-regulation of Hmox1 and Gclc, two additional Nrf2 target genes (Supplemental Fig. S3I). Consistent with the increase in oxidative stress that we observed in Pkm2−/− tumors, livers and tumors from Pkm2−/− mice displayed evidence of DNA damage, as indicated by increased levels of γ-H2AX protein as compared with wild-type livers (Supplemental Fig. S3J). Taken together, these results suggest that loss of PKM2 predisposes livers to spontaneous tumor development through a stochastic process that causes a variety of potential genetic driver events, some of which target the same pathways that are often altered in the human disease.
Germline loss of PKM2 induces discrete metabolite and gene expression changes in the liver that precede HCC
Overt HCC development did not become apparent in Pkm2−/− male mice until ∼60–88 wk of age. Nonetheless, we hypothesized that changes in liver metabolites, gene expression, or both might precede tumor formation in these mice. Thus, we probed the metabolite and gene expression profiles of livers from Pkm2−/− mice at 35 wk of age, a time point prior to any overt histological evidence of tumors (Fig. 4A). Because HCC development is favored in Pkm2−/− male mice, we focused our analysis on these animals.
Figure 4.

Metabolite and RNA-seq profiles of prediseased livers reveal early changes in PKM2-null mice. (A) Representative H&E images of livers from M2+/+ and M2−/− male mice at the indicated ages. Bars, 20 μm. Heat maps of differentially expressed metabolites (B) and differentially expressed genes (C) (RNA-seq; false discovery rate < 0.05; fold change > 1.5) identified in livers of 35-wk-old M2+/+ or M2−/− mice. (D) The top up-regulated (top) and down-regulated (bottom) canonical pathways based on differentially expressed genes identified in C, analyzed by Ingenuity Pathway Analysis (IPA).
Global metabolite profiles of livers from 35-wk-old male mice with and without germline loss of PKM2 revealed a 16-metabolite signature that distinguished Pkm2−/− from wild-type livers (Fig. 4B; Supplemental Tables S1, S2). Moreover, both unsupervised clustering and principal component analysis (PCA) showed that Pkm2−/− livers exhibited consistent metabolite changes (Supplemental Fig. S4A,B). Although the metabolite changes found in Pkm2−/− livers did not reveal an obvious pattern of liver dysfunction at this time point, we did observe metabolite changes consistent with early stages of disease. Of note, phosphocholine and fructose-6-phosphate, two metabolites whose increase has been associated with proliferation and malignant transformation (Tong et al. 2009; Glunde et al. 2011; Jain et al. 2012; Patra and Hay 2014), were increased in PKM2-null livers (Fig. 4B).
RNA-seq analysis of livers from 35-wk-old Pkm2−/− and control mice revealed significant changes in gene expression (Fig. 4C; Supplemental Table S3). Unsupervised clustering showed that the three null samples cluster closely together, suggesting that germline loss of PKM2 elicits consistent gene expression changes in the liver (Supplemental Fig. S4C). We used gene set enrichment analysis (GSEA) to identify statistically enriched gene sets within gene expression changes in the livers from PKM2-null mice (Subramanian et al. 2005). Surprisingly, despite a lack of overt morphological changes in Pkm2−/− livers at this time, we found enriched gene sets from a diverse set of HCC models (Supplemental Fig. S4D; Supplemental Table S4). Significant gene set enrichment resulted only from down-regulated genes in our data set. Furthermore, Ingenuity Pathway Analysis (IPA; Qiagen, http://www.qiagen.com/ingenuity) suggested that the enriched pathways fell into two main categories: immune responses and metabolic regulation (Fig. 4D).
In the category of metabolic regulation, we were particularly interested in the observation that RNA-seq differential expression analysis showed up-regulation of the sterol regulatory element-binding transcription factor 1 (Srebf1), which regulates genes involved in lipid biosynthesis. Up-regulation of Srebf1 in hepatocytes has been implicated in both fatty liver and hepatocarcinogenesis (Horie et al. 2004; Knebel et al. 2012). Interestingly, we also observed down-regulation of the UDP-glucose transporter Slc35d2, a finding consistent with reduced levels of the metabolite UDP-glucose in Pkm2−/− livers (Fig. 4B).
In the category of immune responses, we noted up-regulation of Il18 and leukocyte-derived chemotaxin 2 (Lect). We also detected increased expression of genes associated with proliferation and oncogenesis, including Mapk15 and Erbb4. The expression patterns for Srebf1, Ucp2, Ide1, Erbb4, and another target, Nt5e, were validated by qRT–PCR in the same experimental samples used for the RNA-seq analysis as well as in four additional independent liver samples (Supplemental Fig. S4E).
PKM2-null mice display increased high-fat diet (HFD)-induced metabolic distress and inflammation and increased hepatocyte proliferation
IPA analysis of the gene expression changes that we observed in the livers of Pkm2−/− mice suggested that both inflammation and metabolic pathways were altered prior to tumor development. Moreover, because we observed a reduction in both total Pkm expression and maximal PK enzymatic activity in Pkm2−/− tissues peripheral to the liver and because Pkm is important for glucose metabolism, we hypothesized that glucose homeostasis and metabolic function might be impaired in Pkm2 mutant animals. To determine whether young Pkm2−/− mice are more prone to develop metabolic disease if placed under metabolic stress, groups of 8- to 12-wk-old wild-type and Pkm2−/− male mice were fed either a low-fat diet (LFD; 10% calories from fat) or a HFD (60% calories from fat) for 10 wk.
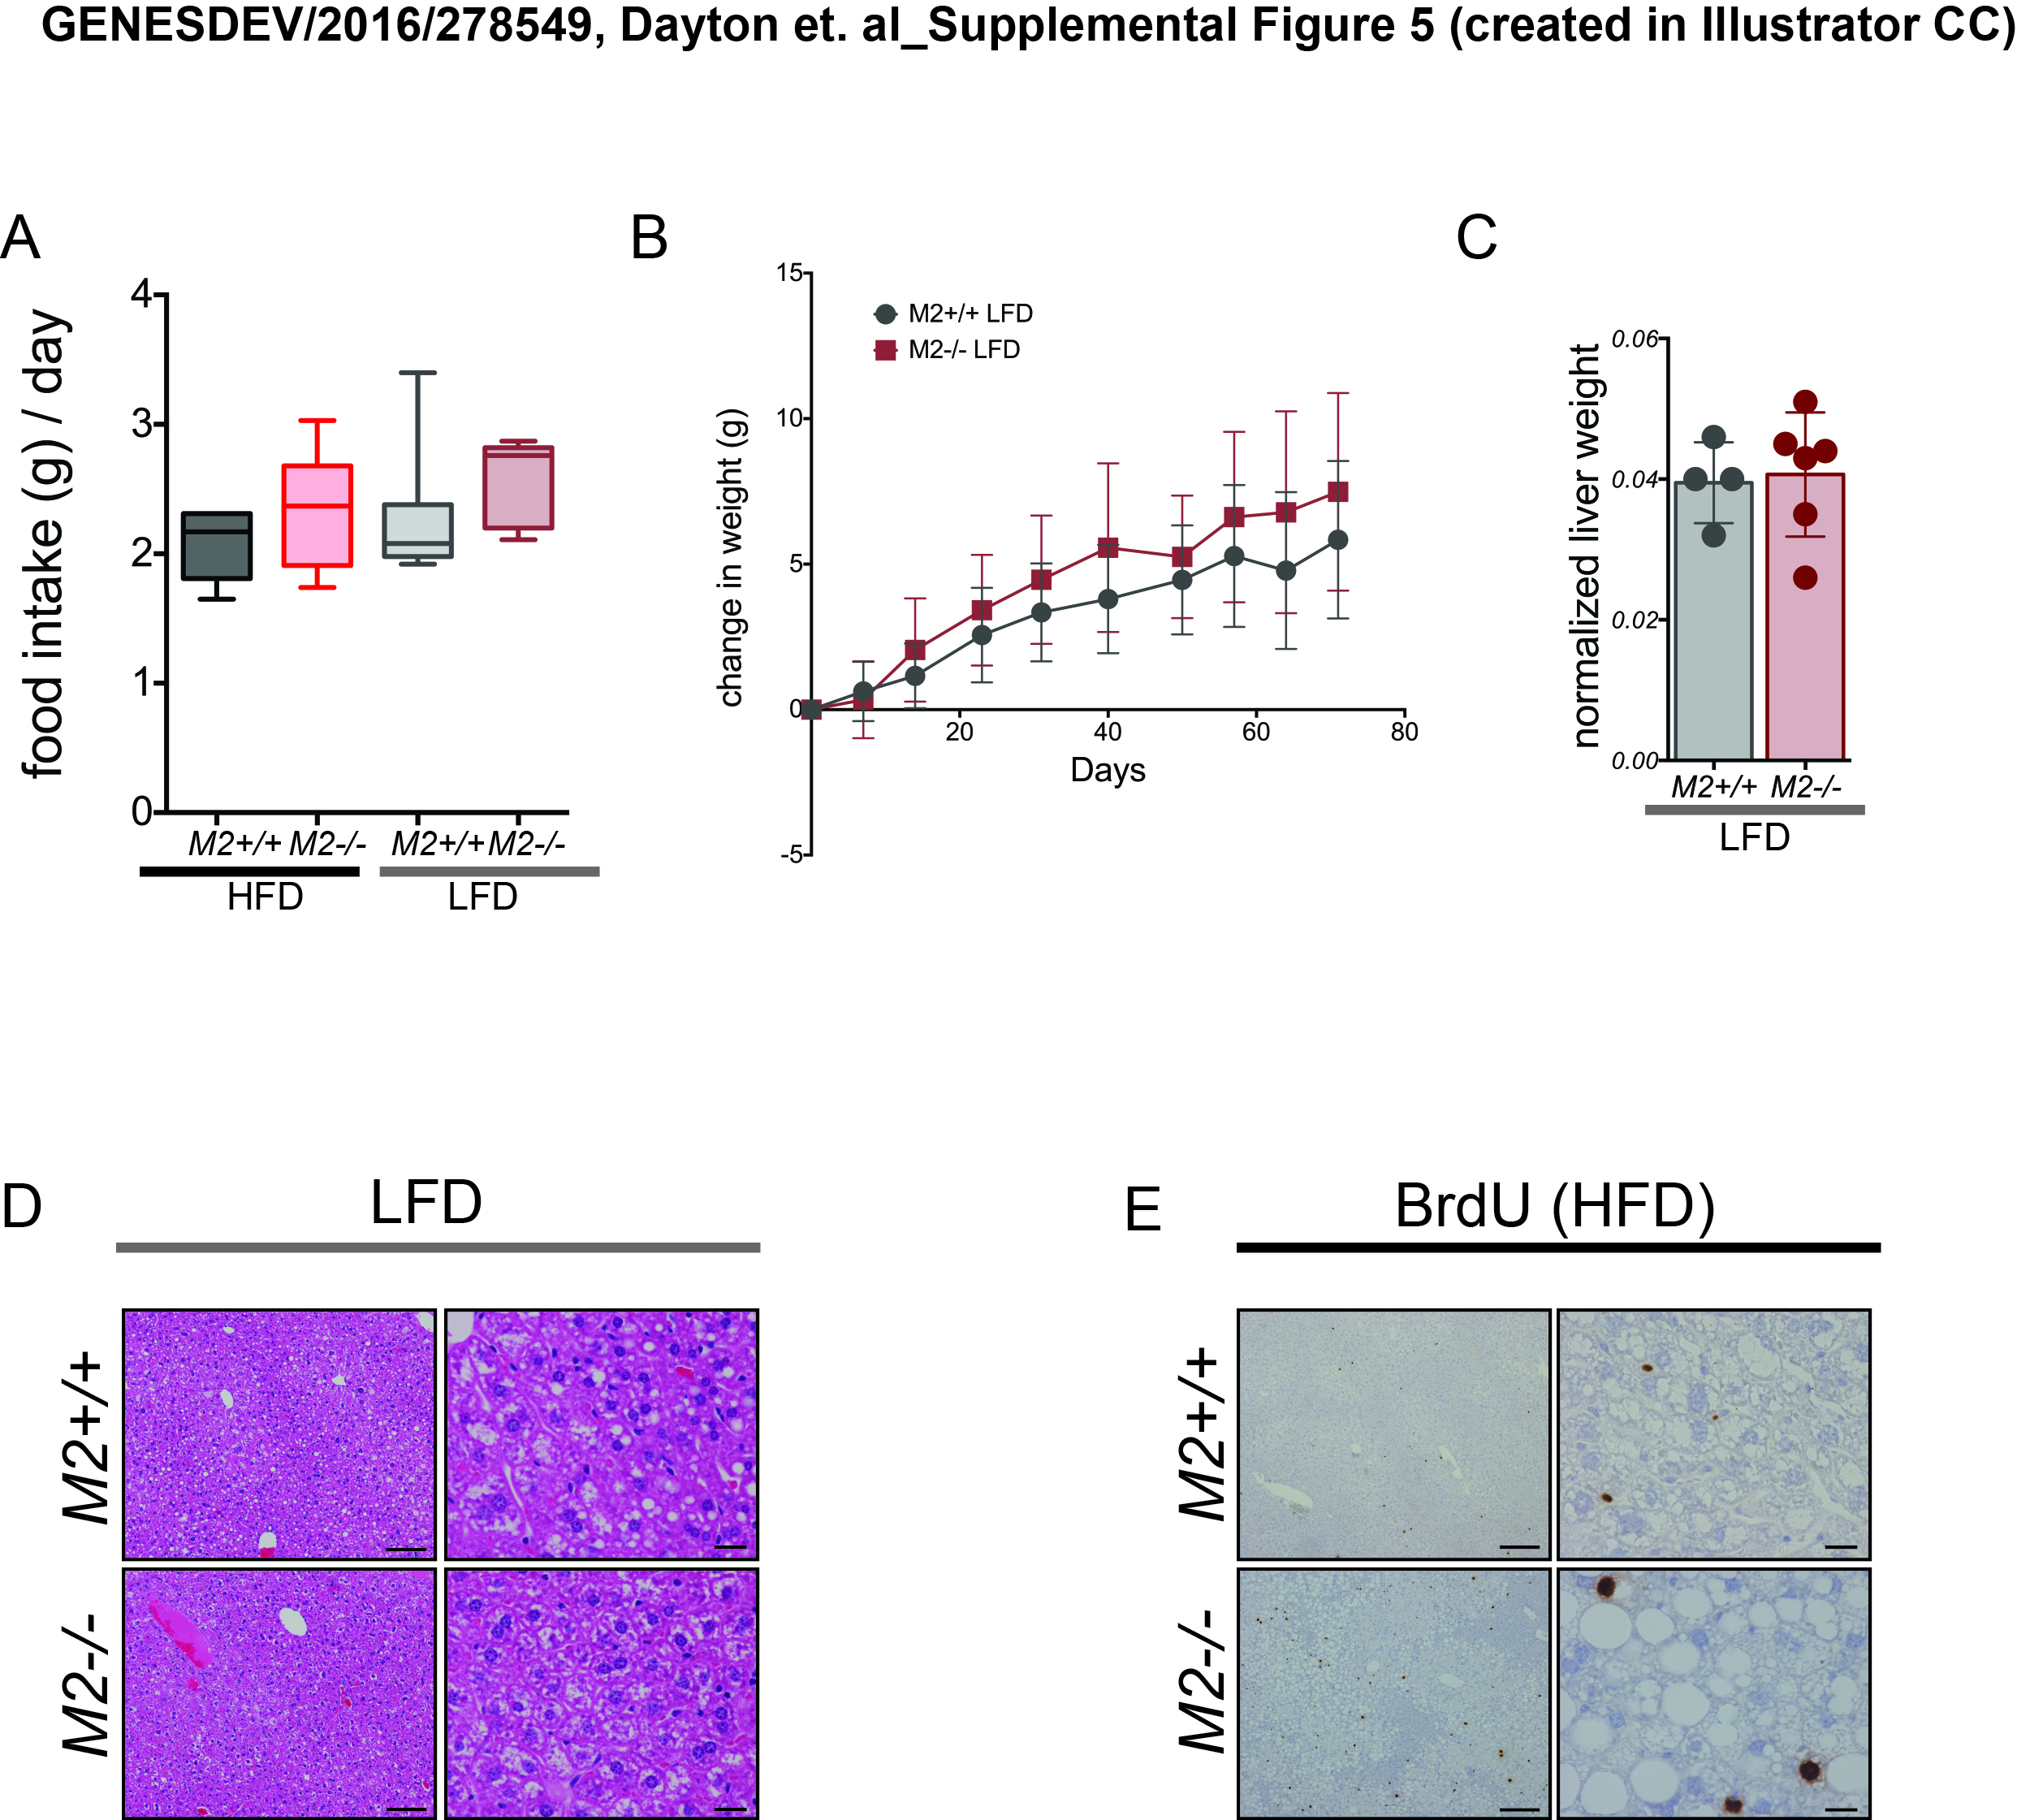
Pkm2−/− mice fed a HFD displayed increased weight gain compared with wild-type mice on the same diet, which could not be explained by differences in food intake (Fig. 5A; Supplemental Fig. S5A). Mice exposed to the LFD did not display any significant difference in weight gain (Supplemental Fig. S5B). Furthermore, after 6 wk on a HFD, Pkm2−/− mice had increased fasting blood glucose levels that were accompanied by a trend toward an increase in fasting insulin (Fig. 5B,C). Pkm2−/− mice also exhibited signs of liver damage after 6 wk of exposure to a HFD, as evidenced by increased serum alanine aminotransferase (ALT) compared with wild-type littermate controls (Fig. 5D).
Figure 5.
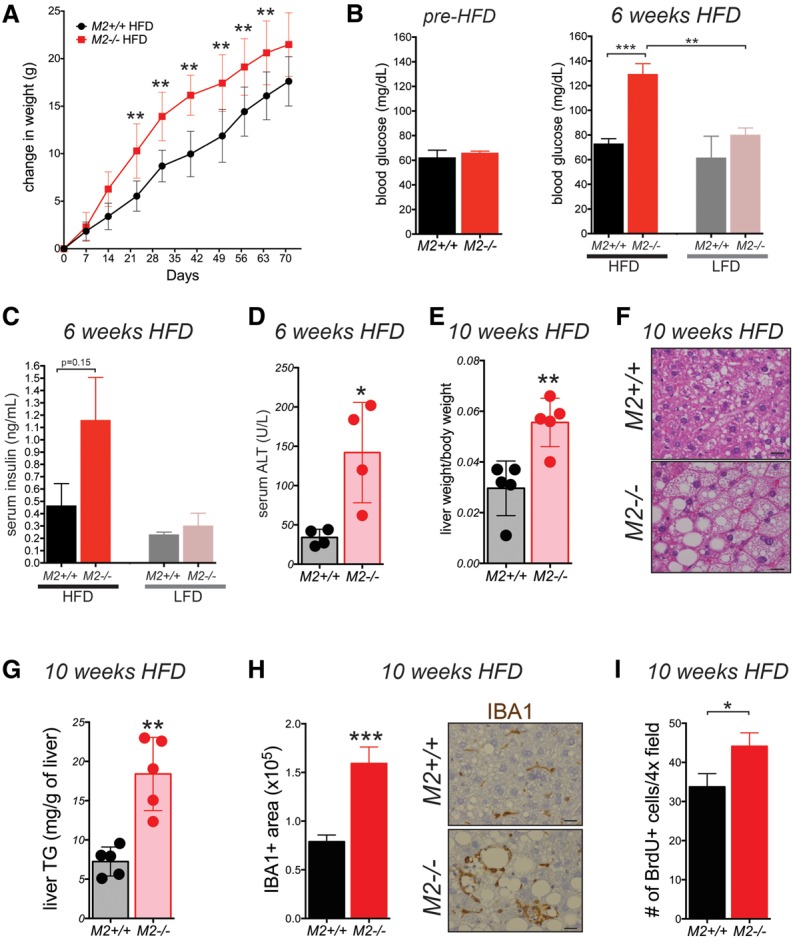
PKM2-null mice are sensitive to HFD-induced metabolic distress. (A) Weekly weight measurements of 8- to 12-wk-old M2+/+ and M2−/− male mice fed a HFD. Blood glucose (B) and serum insulin (C) were measured in fasted (16 h) M2+/+ or M2−/− mice fed a HFD or LFD for 6 wk. (B) The fasting glucose levels of mice before being placed on either diet are shown at the left. (D) Levels of ALT were measured in serum of M2+/+ or M2−/− mice after 6 wk on a HFD. (E) Ratio of liver weight to body weight of mice fed a HFD at the end of the 10-wk regimen. (F) Representative H&E images of livers from M2+/+ and M2−/− male mice after a 10-wk HFD regimen. Bars, 20 μm. (G) Triglyceride (TG) concentrations were measured in the livers of fed M2+/+ or M2−/− mice after 10 wk on a HFD. (H) Quantification of Iba1+ macrophages in livers from M2+/+ or M2−/− mice fed a HFD for 10 wk. Representative images of the IHC for Iba1 are shown. Bars, 20 μm. (I) Quantification of BrdU-positive cells in livers from M2+/+ or M2−/− mice fed a HFD for 10 wk. Means ± SEM and P-values using unpaired t-test are shown. (*) P < 0.05; (**) P < 0.01; (***) P < 0.001.
At the end of the 10-wk regimen, livers from Pkm2−/− mice fed a HFD were twofold larger relative to body weight than those of wild-type controls (Fig. 5E). Whereas livers from wild-type mice on a HFD only had moderate steatosis, Pkm2−/− mice on the same diet exhibited severe hepatic steatosis (Fig. 5F) and increased liver triglyceride content (Fig. 5G). Livers from both wild-type and Pkm2−/− mice fed a LFD displayed only mild steatosis, and the liver weight to body weight ratio was similar in each cohort (Supplemental Fig. S5C,D). In addition, the liver area that stained positive for a common macrophage marker, IBA1, was higher in livers from Pkm2−/− mice fed a HFD as compared with wild-type mice on the same diet (Fig. 5H), indicating more macrophage infiltration in the liver in response to the HFD.
Finally, after 10 wk of exposure to a HFD, the livers of Pkm2−/− mice showed higher BrdU incorporation compared with livers of Pkm2+/+ mice on the same diet (Fig. 5I; Supplemental Fig. S5E). These data demonstrate that PKM2 deficiency exacerbates HFD-induced metabolic distress and liver inflammation in adult male mice. Furthermore, the observation of increased hepatocyte proliferation in the livers of Pkm2−/− mice exposed to a HFD suggests that these two conditions—metabolic distress and inflammation—create a liver microenvironment that is more prone to tumor development.
PKM2-null mice display increased age-induced metabolic distress and inflammation and increased hepatocyte proliferation
The fact that Pkm2−/− male mice were more prone to the metabolic distress induced by a HFD argues that loss of PKM2 and the consequent aberrant expression of PKM1 in Pkm2−/− mice lead to increased susceptibility to metabolic stress. Furthermore, because HCC is associated with systemic metabolic disease, including type 2 diabetes, metabolic syndrome, and NAFLD (Leung et al. 2015), and because changes in PK isoform expression can impact glucose fate (Lunt et al. 2015), we asked whether Pkm2−/− mice might likewise be more susceptible to age-induced whole-body metabolic changes. We measured fasting blood glucose and insulin levels in young and old Pkm2−/− mice or wild-type littermates. Glucose and insulin levels were not altered in young Pkm2−/− mice, and we found that these animals had a normal glucose tolerance test (GTT) (Fig. 6A,B; Supplemental Fig. S6A). Older Pkm2−/− male mice (≥85 wk), however, had increased fasting blood glucose and insulin levels as compared with wild-type littermates (Fig. 6A,B). A similar trend was observed in female mice, but only the difference in fasting glucose was statistically significant (Supplemental Fig. S6B,C).
Figure 6.

HCC in PKM2-null mice is accompanied by metabolic distress and preceded by hepatic inflammation and increased hepatocyte proliferation. Blood glucose (A) and serum insulin (B) were measured in fasted (16 h) M2+/+ or M2−/− mice of the indicated ages. (C) Representative H&E images of livers from 54- to 62-wk-old M2+/+ and M2−/− male mice reveal hepatic steatosis in M2−/− mice. Bars, 20 μm. (D) Degree of steatosis was graded as none, mild, intermediate, or severe according to the proportion of total liver displaying a steatosis phenotype. (E) Levels of ALT were measured in serum of young (24 wk) or old (85 wks) M2+/+ or M2−/− mice. (F) Quantification of macrophages (Iba1+ area) in livers from M2+/+ or M2−/− mice fed a HFD for 10 wk. Representative images of Iba1 IHC are shown. Bars, 20 μm. (G) Levels of IL-6 in the serum of young (12 wk) and aged (85 wk) M2+/+ and M2−/− mice were determined by multiplex array. (H) Expression of Il18 mRNA in the livers of young (35 wk) or aged (85 wk) M2+/+ and M2−/− male mice as determined by qRT–PCR. (I) Western blot analysis for IL-18 on whole liver tissue lysates from young (top) and aged (bottom) M2+/+ or M2−/− mice. Hsp90 was used as a loading control. (J) Quantification of BrdU-positive cells in liver sections of 40- to 56-wk-old M2+/+ or M2−/− mice. Means ± SEM and P-values using unpaired t-test are shown. (*) P < 0.05; (**) P < 0.01; (***) P < 0.001; (n.s.) P > 0.05.
Consistent with metabolic distress in Pkm2−/− male mice, the majority of these mice also developed hepatic steatosis consisting of both macrovesicular and microvesicular patterns of lipid accumulation (Fig. 6C). Livers from Pkm2−/− and wild-type mice were scored for the degree of steatosis as negative, mild, intermediate, and severe. All of the mutant mice in our analysis showed signs of steatosis, with ∼50% of the mice displaying severe steatosis (Fig. 6D). Aged Pkm2−/− males also showed a subtle but significant increase in weight (Supplemental Fig. S6D). Increased concentrations of ALT in the serum of aged Pkm2−/− males suggested increased liver damage in older mice (Fig. 6E). Taken together, these data show that HCC in Pkm2−/− mice is accompanied by features of systemic metabolic disease, including hyperglycemia, hyperinsulinemia, and hepatic steatosis.
Consistent with our analysis of Pkm2−/− mice exposed to a HFD, we found that livers from aged Pkm2−/− mice (59-wk; no macroscopic HCC) showed increased macrophage infiltration, as indicated by IHC for IBA1 (Fig. 6F). Human patients with systemic metabolic disease also exhibit increased systemic inflammation (Rahman et al. 2013), and increased circulating Interleukin-6 (IL-6) is associated with this type of obesity-induced inflammation (Mauer et al. 2015). Therefore, we characterized the circulating cytokine profile of young and old Pkm2−/− male mice together with age- and sex-matched wild-type littermate controls. No differences in cytokine levels were observed in the serum of 12-wk-old Pkm2−/− mice; however, 85-wk-old mutant mice showed a consistent increase in serum IL-6 (Fig. 6G). Furthermore, qPCR analysis of white adipose tissue from the same mice revealed increased levels of Tnfα mRNA in Pkm2−/− tissue compared with wild-type (Supplemental Fig. S6E). The levels of CD45 and F4/80 mRNA were also increased in tissue from mutant animals, suggesting increased immune cell infiltration in adipose tissue and consistent with our observations of increased systemic inflammation.
These results led us to revisit Il18, a chemokine gene identified in our RNA-seq analysis and whose transcript levels were increased in the livers of Pkm2−/− mice compared with age- and sex-matched wild-type mice (Fig. 4C; Supplemental Table S3). We confirmed these results in livers from 35-wk-old Pkm2−/− and wild-type mice by qRT–PCR analysis and also found that the up-regulation of Il18 mRNA was more pronounced in the livers of 85-wk-old Pkm2−/− mice than in livers of younger mice and wild-type controls (Fig. 6H). The increase in Il18 mRNA in Pkm2−/− livers relative to wild-type livers was accompanied by an increase in IL18 protein levels and, importantly, the levels of the cleaved/active form of the cytokine (Fig. 6I). IL18 has been implicated in both chronic hepatic inflammation and the development of diethylnitrosamine (DEN)-induced HCC in mice (Li et al. 2015).
Chronic inflammation in the setting of obesity and metabolic disease is thought to cause liver injury with cycles of compensatory proliferation that eventually lead to HCC development (Farazi and DePinho 2006). Furthermore, IL18 has been shown to promote hepatocyte proliferation following partial hepatectomy in rats (Zhang et al. 2014). Therefore, we asked whether livers from older Pkm2−/− mice show increased rates of proliferation. To test this hypothesis, we analyzed BrdU incorporation in the livers of 54-wk-old Pkm2−/− male mice, a time point with low penetrance of HCC. Compared with wild-type livers, Pkm2−/− livers showed an increase in the number of BrdU+ cells (Fig. 6J). Collectively, these findings suggest that HCC in Pkm2−/− mice is accompanied by metabolic imbalance and hepatic inflammation, both of which appear to be progressive processes that become more pronounced with age, are associated with increased hepatocyte proliferation, and culminate in the development of HCC.
Discussion
The observations that PKM2 is not required for embryonic and postnatal development and that Pkm2−/− mice develop spontaneous HCC challenge some existing models of PKM2 function and suggest that this isoform is dispensable for both normal cell and HCC proliferation. Importantly, our results also indicate that PKM2 and PKM isoform selection play a previously unappreciated role in maintaining systemic energy homeostasis and thereby in preventing spontaneous HCC.
Role of PKM2 in embryonic and postnatal development
PKM2 is universally expressed in tumors and can play a role in regulating glycolysis and therefore the metabolic phenotype of cancer cells (Christofk et al. 2008a). A number of other studies have suggested that PKM2 expression in cancer cells is driven by its unique protein kinase or nuclear functions (Lv et al. 2011; Gao et al. 2012; Yang et al. 2011, 2012b,c). Our observation that PKM2 is not required for normal embryonic or postnatal development indicates that both the canonical metabolic and putative noncanonical nuclear functions of PKM2 are not required for normal proliferation or organismic viability.
Importantly, loss of PKM2 results in aberrant expression of PKM1, arguing that, in the contexts of embryonic and postnatal development, PKM1 can compensate for the lack of PKM2. This is surprising for several reasons. First, the distinct tissue and cell type-specific expression patterns of PKM1 and PKM2 in wild-type tissue suggest nonredundant functions for each isoform. Second, the enzymatic activities of PKM1 and PKM2 are regulated by distinct mechanisms. While PKM1 is constitutively active, PKM2 can be inhibited by a variety of cellular signals, many of which are known to promote cell and tissue growth (Mazurek et al. 2005; Christofk et al. 2008b; Hitosugi et al. 2009; Vander Heiden et al. 2010; Lv et al. 2011). The lower expression of total Pkm observed in PKM2-expressing tissues from Pkm2−/− mice argues that lower PK activity associated with PKM2 regulation is important for tissues that normally express PKM2. Whether changes in PKM1 expression levels allow tissues that would otherwise use allosteric mechanisms to regulate PKM2 activity to access different levels of enzyme activity remains an open question.
Previous studies of primary cells in culture suggest that the constitutive enzymatic activity associated with PKM1 expression can be incompatible with rapid proliferation (Lunt et al. 2015). Acute deletion of PKM2 in untransformed cultured cells leads to proliferative arrest (Lunt et al. 2015), and activation of PKM2 enzymatic activity by small-molecule activators, which renders the enzyme more similar to PKM1, impedes xenograft tumor formation in mice (Anastasiou et al. 2012). Furthermore, in a mouse model of leukemia, uniform expression of PKM1 limited tumor progression (Wang et al. 2014). In a breast cancer model, on the other hand, heterogeneous PKM1 expression across tumors cell populations allowed the tumor cells with lower PKM1 expression to proliferate and thus did not impede tumor progression (Israelsen et al. 2013). Although similar to what was observed in HCC in PKM2-null mice, many breast cancer cells were found to express neither PKM1 nor PKM2 at appreciable levels (Israelsen et al. 2013).
In contrast to these findings in cancer, we saw uniform expression of PKM1 in Pkm2−/− embryos and nonetheless found that embryonic development, a process that requires rapid proliferation, was unperturbed. The ability of Pkm2−/− cells to proliferate in the absence of PKM2 and despite the expression of PKM1 raises the possibility that the role of PK regulation in normal proliferation, as seen during embryonic development or normal tissue homeostasis, may differ from that in cancer. Of note, the consequences of increased constitutive PK enzymatic activity through expression of PKM1 in Pkm2−/− mice might be mitigated by both the down-regulation of total Pkm transcripts and the reduction of PK enzymatic activity that we observed in Pkm2−/− tissues compared with wild-type tissues.
Role of PKM2 in spontaneous HCC and systemic energy homeostasis
Given the established role played by PKM2 in cancer metabolism and that several reports implicate PKM2 specifically in HCC, it is striking that Pkm2−/− mice spontaneously develop large, multifocal liver tumors. It is remarkable that the tumor formation that we observed in Pkm2−/− mice occurs in the absence of a defined genetic oncogenic driver event. Although both breast tumors and leukemia have been shown to initiate and progress despite loss of PKM2, these tumors arose in the context of defined oncogenic events that are well-established drivers of tumorigenesis. In contrast, in Pkm2−/− mice, HCC tumor formation was not driven by a defined cell-intrinsic oncogenic driver event; rather, tumors appear to arise through a stochastic process. Furthermore, because the hepatocyte cells of origin for HCC do not express PKM2, we suggest that HCC formation in Pkm2−/− mice must arise through a non-cell-autonomous mechanism. The finding that tumors from Pkm2+/− mice all maintain the wild-type Pkm allele, as determined by quantitative genomic PCR (data not shown), further supports this notion.
Nonetheless, cell-autonomous consequences of PKM2 loss are also potentially involved in HCC formation in Pkm2−/− mice. Further investigation is needed to delineate the precise mechanism by which non-cell-autonomous changes in PKM isoform selection promote liver tumor formation.
Although most cancer metabolism studies have focused on cancer cell-intrinsic phenotypes, cell-extrinsic metabolic changes, such as alterations in systemic metabolism, are strongly associated with cancer (Pi-Sunyer 2009). Manifestations of systemic metabolic dysfunction include insulin resistance, nonalcoholic fatty liver disease (NAFLD), dyslipidemia, cardiovascular disease, systemic inflammation, and metabolic syndrome, which encompasses many of these conditions (Kaur 2014). Although these altered metabolic phenotypes are associated with both increased incidence and morbidity of a number of human cancers (Pi-Sunyer 2009; Esposito et al. 2012), the link between metabolic disease and HCC is particularly striking, with strong associations noted between HCC and both type 2 diabetes and NAFLD (El-Serag et al. 2004).
In addition to promoting HCC development in aged mice, germline loss of PKM2 increases susceptibility to metabolic distress induced by either aging or a HFD. We propose that the metabolic distress that develops in Pkm2−/− mice leads to chronic liver injury and results in both systemic and local liver inflammation, hepatocyte proliferation, and, ultimately, HCC. Metabolite analysis and RNA-seq data from liver samples taken prior to pathologically evident disease were indicative of a progressive condition in which aberrations in metabolic and immune response pathways preceded overt metabolic distress and tumor formation in Pkm2−/− mice.
The molecular changes observed in prediseased livers are likely the result of the non-cell-autonomous/systemic and microenvironmental changes induced by germline loss of PKM2 and consequent expression of PKM1 in other cell types. While it is not immediately apparent which of the many molecular changes are causative of the metabolic distress and HCC that manifest with time, several hepatocyte gene expression changes in Pkm2−/− livers are consistent with changes observed in other HCC models. For example, up-regulation of Srebf1 has been shown to result in increased hepatic triglyceride levels and is one of the early and primary changes observed in liver-specific Pten knockout mice, which also develop HCC (Horie et al. 2004; Ueki et al. 2004; Knebel et al. 2012).
Due to the widespread expression of PKM2 in adult tissue, it is difficult to determine which tissues or cell types are contributing to metabolic disease in Pkm2−/− mice. Metabolic aberrations in PKM2-expressing tissues, including white adipose tissue and pancreatic islet cells, could be contributing to the systemic metabolic distress that we observed in Pkm2−/− mice; however, it is likely that PKM2 loss (and consequent PKM1 expression) across tissues and cell types is involved. Future work on the subject is likely to lead to new insights into how PKM isoform selection in different tissues contributes to systemic energy homeostasis.
The immune system has also been shown to play a key role in both systemic metabolic disease and the formation of HCC. It is notable that all of the major phenotypes that we uncovered in Pkm2−/− mice (late-onset hyperglycemia and hyperinsulinemia, hepatic steatosis, inflammation, and, ultimately, spontaneous HCC) are most pronounced in aged male mice. Metabolic disease and HCC are also more prevalent in men (El-Serag and Rudolph 2007). The gender disparity observed in human HCC has been attributed in part to the inhibitory action of estrogen on inflammation and, specifically, on the production of IL-6 (Naugler et al. 2007; Barros and Gustafsson 2011; Rahman et al. 2013). Thus, an influence of inflammation and the immune system may underlie the predisposition for metabolic distress and HCC in Pkm2−/− mice. The observed increase of Il18 mRNA and protein in Pkm2−/− livers further supports this notion.
These findings provide new insights into the complex roles played by PKM2 and glucose regulation in whole-body and cancer cell metabolism. Pkm2−/− mice appear to be a model that can be used to further investigate the links between systemic metabolism, the immune system, and HCC progression. As a growing percentage of HCC cases are associated with metabolic syndrome, type 2 diabetes, and NAFLD (Baffy et al. 2012; Rahman et al. 2013; Byrne and Targher 2015), a better understanding of the mechanistic link between systemic metabolic disease and HCC formation is of crucial importance. An advantage of this mouse model is that HCC arises in the context of systemic metabolic distress, appears to be induced by non-cell-autonomous events, and does not involve the use of chemical tumor promoters. The future study of Pkm2−/− mice will provide new avenues to further elucidate the distinct cell-intrinsic and cell-extrinsic roles of PKM2 in both the normal metabolic and inflammatory responses to aging and aberrant proliferation in the context of cancer.
Materials and methods
Mice
Generation of the Pkm2fl/+ mouse strain has been described previously (Israelsen et al. 2013). Pkm2fl/+ and EIIA-Cre mice (Lakso et al. 1996) were crossed to obtain Pkm2+/− mice. All animals were maintained on a mixed C57BL/6J × 129SvJ genetic background. The Massachusetts Institute of Technology (MIT) Institutional Animal Care and Use Committee approved all animal studies and procedures. Genotyping primers used were 5′-TAGGGCAGGACCAAAGGATTCCCT-3′ and 5′-CTGGCCCAGAGCCACTCACTCTTG-3′.
RNA-seq data analysis
Sequencing was performed on an Illumina HiSeq 2000 instrument to obtain paired-end 40-nucleotide reads. All reads that passed quality metrics were mapped to the University of California at Santa Cruz mm9 mouse genome build (http://genome.ucsc.edu) using RNA-seq by Expectation-Maximization (RSEM) (Li and Dewey 2011; The ENCODE Project Consortium 2012). Data normalization (MedianNorm) and differential analyses between experimental conditions were performed using EBSeq version 1.4.0 (Leng et al. 2013). All RNA-seq analyses were conducted in the R statistical programming language (http://www.r-project.org). Heat maps were generated using the Heatplus package in R. GSEAs were carried out using the preranked mode using log2 fold change values with default settings (Subramanian et al. 2005).
Isoform detection in external RNA-seq data sets
RNA-seq data from different mouse tissues produced by ENCODE (The ENCODE Project Consortium 2012) were analyzed for PKM isoform-level read coverage using MISO (Katz et al. 2010). Similarly, human tissue RNA-seq data sets from the Illumina Body Map 2.0 project were analyzed for alternate isoform usage. These stranded paired-end data sets were aligned to the mouse (mm9) or human (hg19) genome builds using TopHat (Trapnell et al. 2009).
Histology and IHC
Tissues were fixed in zinc formalin (Polysciences, Inc., 21516) at room temperature and then transferred to 70% ethanol until paraffin embedding. IHC was performed on 4-μm-thick sections using ABC VectaStain kit (Vector Laboratories) with antibodies to PKM1 (1:500; Cell Signaling Technology, 7067), PKM2 (1:500, Cell Signaling Technology, 4053), KI67 (1:100; Vector Laboratories, VP-RM04), BrdU (1:100; Abcam, ab6326), HNF4α (1:200; Sant Cruz Biotechnology, SC-6556), β-catenin (1:200; BD Biosciences, 610154), glutamine synthetase (1:50; BD, 610517), NQO1 (1:500; Sigma, HPA007308), pERK (1:200; Cell Signaling Technology, 4370s), p53 (1:100; Vector Laboratories, VP-RM04), and Iba1 (1:500; Wako Chemicals, 019-19741). The staining was visualized with DAB (Vector Laboratories, SK-4100), and the slides were counterstained with hematoxylin. For dual staining, DAB and Vector Red (Vector Laboratories, SK-5100) or ImmPACT VIP (Vector Laboratories, SK-4605) were used. Hematoxylin and eosin (H&E) staining was performed on a Varistain Gemini automated slide stainer (Thermo Shandon). The proliferation analysis was performed using ImageJ to determine the number of BrdU-positive cells per 4× field, five 4× fields were counted per mouse, and at least five mice of each genotype were used for the analysis. Human tissue arrays were purchased from US Biomax, Inc., for normal human tissue (FDA808a1) and HCC (HLiv-HCC060CD-02).
Immunoblotting
Tissue lysates were generated from flash-frozen ground whole tissue or tumors following lysis with ice-cold RIPA buffer supplemented with HALT phosphatase and protease inhibitors (Thermo-Scientific, PI-78420 and 87786). Protein concentrations of the cell lysates were quantified using the DC protein assay kit (Bio-Rad, 500-0112). Next, 15 μg of total protein was separated on 4%–12% Bis-Tris gradient gels (Life Technologies) by SDS-PAGE and then transferred to nitrocellulose membranes. The following antibodies were used for immunoblotting: anti-β-tubulin (1:10000; Sigma, T4026), anti-Hsp90 (1:10000; BD Biosciences, 610418), anti-γ-H2AX (1:1000; Cell Signaling Technology, 9718) anti-PKM1 (1:5000; Cell Signaling Technology, 7067), and anti-PKM2 (1:5000; Cell Signaling Technology, 4053).
PK activity
PK activity was measured as described previously (Christofk et al. 2008b). Briefly, flash-frozen, ground tissue was lysed and homogenized in hypotonic lysis buffer (20 mM HEPES, 5 mM KCl, 1 mM MgCl2, 1 mM DTT) with HALT protease inhibitors. Immediately prior to start, between 0.5 and 2 μg of protein was mixed with 1× PK reaction buffer (100 mM KCl, 50 mM Tris-HCl at pH 7.5, 5 mM MgCl2, 1 mM DTT) containing 0.5 mM PEP (Sigma, P3637), 0.6 mM ADP (Sigma, A5285), 180 μM NADH (Sigma, 8129), 16 μg of LDH (Sigma, 2500), and 100 μM FBP (Sigma, F6803) where applicable. The final reaction volume was 100 μL in 96-well plates, and all samples were tested in duplicate.
Physiological and analytical measurements
Mice were fasted for 16 h prior to glucose measurement and plasma collection. Glucose concentrations were measured using glucose strips and a glucometer (Lifescan One Touch Ultra). Insulin levels were measured using a mouse ultrasensitive insulin ELISA kit (Crystal Chem, 90080). Serum triglycerides of fasted mice and liver triglycerides from fed mice were measured using a triglyceride assay kit (Cayman Chemical, 10010303). GTT was performed in 16-h-fasted mice using 1.5 g/kg glucose interperitoneal injection. Serum alanine aminotransferase measurements were performed by IDEXX BioResearch Laboratory.
Cytokine analysis
Serum and tissue homogenate cytokines were quantified using different Discovery assays (Eve Technologies Corp., assays MD31, MYCTI-07-103, and MYCTI-06-101). The multiplex assay was performed at Eve Technologies by using the Bio-Plex 200 system (Bio-Rad Laboratories, Inc.).
BrdU incorporation
Mice were given one pulse of intraperitoneal injection with 30 μg of BrdU per gram of mouse weight (Sigma, B5002) for 3 h.
Accession Numbers
All primary RNA-seq data are available on Gene Expression Omnibus under accession number GSE79535.
Supplementary Material
Acknowledgments
We thank Nadya Dimitrova, Francisco Sanchez-Rivera, Laura Danai, and Chengcheng Jin for critical review of the manuscript. We are grateful to Ben Olenchock and Eric Bell for assistance with metabolic phenotyping, Paul L. Boutz for insightful comments on isoform regulation analyses, and Anthony Couvillon for sharing the EIIA-Cre mice. We also thank David Feldser, Nadya Dimitrova, Nikhil Joshi, Hao Yin, Aaron Hosios, Wen Xue, and the entire Jacks and Vander Heiden laboratories for helpful discussions and experimental assistance. We thank the Koch Institute Swanson Biotechnology Center (SBC) for technical support, specifically Denise Crowley and Kathleen Cormier in the Hope Babette Tang (1983) Histology Facility. Additionally, we acknowledge the ENCODE project, the Gingeras laboratory (Cold Spring Harbor Laboratory), and the Illumina Body Map project for RNA-seq data. This work was partially supported by Cancer Center Support grant P30CA14051 from the National Cancer Institute and by grants from the Howard Hughes Medical Institute (T.J.), the Burroughs Wellcome Fund (M.G.V.H.), the Smith Family (M.G.V.H.), and the Department of Health and Human Services (P01CA117969 to T.J., and R01CA168653 to M.G.V.H.). T.L.D. was partially supported by a National Defense Science and Engineering Graduate (NDSEG) Fellowship Award. V.G. was supported by a Jane Coffin Childs Memorial Fund Postdoctoral Fellowship. T.J. is a Howard Hughes Investigator, the David H. Koch Professor of Biology, and a Daniel K. Ludwig Scholar at Massachusetts Institute of Technology. M.G.V.H. is a consultant and advisory board member for Agios Pharmaceuticals. We dedicate this paper to the memory of Officer Sean Collier for his caring service to the Massachusetts Institute of Technology community and his sacrifice.
Footnotes
Supplemental material is available for this article.
Article published online ahead of print. Article and publication date are online at http://www.genesdev.org/cgi/doi/10.1101/gad.278549.116.
References
- Anastasiou D, Yu Y, Israelsen WJ, Jiang J-K, Boxer MB, Hong BS, Tempel W, Dimov S, Shen M, Jha A, et al. 2012. Pyruvate kinase M2 activators promote tetramer formation and suppress tumorigenesis. Nat Chem Biol 8: 839–847. [DOI] [PMC free article] [PubMed] [Google Scholar]
- Baffy G, Brunt EM, Caldwell SH. 2012. Hepatocellular carcinoma in non-alcoholic fatty liver disease: an emerging menace. J Hepatol 56: 1384–1391. [DOI] [PubMed] [Google Scholar]
- Barros RPA, Gustafsson J-Å. 2011. Estrogen receptors and the metabolic network. Cell Metab 14: 289–299. [DOI] [PubMed] [Google Scholar]
- Byrne CD, Targher G. 2015. NAFLD: a multisystem disease. J Hepatol 62: S47–S64. [DOI] [PubMed] [Google Scholar]
- Cairns RA, Harris IS, Mak TW. 2011. Regulation of cancer cell metabolism. Nat Rev Cancer 11: 85–95. [DOI] [PubMed] [Google Scholar]
- Chaneton B, Hillmann P, Zheng L, Martin ACL, Maddocks ODK, Chokkathukalam A, Coyle JE, Jankevics A, Holding FP, Vousden KH, et al. 2012. Serine is a natural ligand and allosteric activator of pyruvate kinase M2. Nature 491: 458–462. [DOI] [PMC free article] [PubMed] [Google Scholar]
- Christofk HR, Vander Heiden MG, Harris MH, Ramanathan A, Gerszten RE, Wei R, Fleming MD, Schreiber SL, Cantley LC. 2008a. The M2 splice isoform of pyruvate kinase is important for cancer metabolism and tumour growth. Nature 452: 230–233. [DOI] [PubMed] [Google Scholar]
- Christofk HR, Vander Heiden MG, Wu N, Asara JM, Cantley LC. 2008b. Pyruvate kinase M2 is a phosphotyrosine-binding protein. Nature 452: 181–186. [DOI] [PubMed] [Google Scholar]
- Clower CV, Chatterjee D, Wang Z, Cantley LC, Vander Heiden MG, Krainer AR. 2010. The alternative splicing repressors hnRNP A1/A2 and PTB influence pyruvate kinase isoform expression and cell metabolism. Proc Natl Acad Sci 107: 1894–1899. [DOI] [PMC free article] [PubMed] [Google Scholar]
- David CJ, Chen M, Assanah M, Canoll P, Manley JL. 2010. HnRNP proteins controlled by c-Myc deregulate pyruvate kinase mRNA splicing in cancer. Nature 463: 364–368. [DOI] [PMC free article] [PubMed] [Google Scholar]
- El-Serag HB, Rudolph KL. 2007. Hepatocellular carcinoma: epidemiology and molecular carcinogenesis. Gastroenterology 132: 2557–2576. [DOI] [PubMed] [Google Scholar]
- El-Serag HB, Tran T, Everhart JE. 2004. Diabetes increases the risk of chronic liver disease and hepatocellular carcinoma. Gastroenterology 126: 460–468. [DOI] [PubMed] [Google Scholar]
- The ENCODE Project Consortium. 2012. An integrated encyclopedia of DNA elements in the human genome. Nature 489: 57–74. [DOI] [PMC free article] [PubMed] [Google Scholar]
- Esposito K, Chiodini P, Colao A, Lenzi A, Giugliano D. 2012. Metabolic syndrome and risk of cancer: a systematic review and meta-analysis. Diabetes Care 35: 2402–2411. [DOI] [PMC free article] [PubMed] [Google Scholar]
- Farazi PA, DePinho RA. 2006. Hepatocellular carcinoma pathogenesis: from genes to environment. Nat Rev Cancer 6: 674–687. [DOI] [PubMed] [Google Scholar]
- Gao X, Wang H, Yang JJ, Liu X, Liu Z-R. 2012. Pyruvate kinase M2 regulates gene transcription by acting as a protein kinase. Mol Cell 45: 598–609. [DOI] [PMC free article] [PubMed] [Google Scholar]
- Glunde K, Bhujwalla ZM, Ronen SM. 2011. Choline metabolism in malignant transformation. Nat Rev Cancer 11: 835–848. [DOI] [PMC free article] [PubMed] [Google Scholar]
- Hacker HJ, Steinberg P, Bannasch P. 1998. Pyruvate kinase isoenzyme shift from L-type to M2-type is a late event in hepatocarcinogenesis induced in rats by a choline-deficient/DL-ethionine-supplemented diet. Carcinogenesis 19: 99–107. [DOI] [PubMed] [Google Scholar]
- Hanahan D, Weinberg RA. 2011. Hallmarks of cancer: the next generation. Cell 144: 646–674. [DOI] [PubMed] [Google Scholar]
- Hitosugi T, Kang S, Vander Heiden MG, Chung T-W, Elf S, Lythgoe K, Dong S, Lonial S, Wang X, Chen GZ, et al. 2009. Tyrosine phosphorylation inhibits PKM2 to promote the Warburg effect and tumor growth. Sci Signal 2: ra73. [DOI] [PMC free article] [PubMed] [Google Scholar]
- Horie Y, Suzuki A, Kataoka E, Sasaki T, Hamada K, Sasaki J, Mizuno K, Hasegawa G, Kishimoto H, Iizuka M, et al. 2004. Hepatocyte-specific Pten deficiency results in steatohepatitis and hepatocellular carcinomas. J Clin Invest 113: 1774–1783. [DOI] [PMC free article] [PubMed] [Google Scholar]
- Hosios AM, Fiske BP, Gui DY, Vander Heiden MG. 2015. Lack of evidence for PKM2 protein kinase activity. Mol Cell 59: 850–857. [DOI] [PMC free article] [PubMed] [Google Scholar]
- Israelsen WJ, Dayton TL, Davidson SM, Fiske BP, Hosios AM, Bellinger G, Li J, Yu Y, Sasaki M, Horner JW, et al. 2013. PKM2 isoform-specific deletion reveals a differential requirement for pyruvate kinase in tumor cells. Cell 155: 397–409. [DOI] [PMC free article] [PubMed] [Google Scholar]
- Jain M, Nilsson R, Sharma S, Madhusudhan N, Kitami T, Souza AL, Kafri R, Kirschner MW, Clish CB, Mootha VK. 2012. Metabolite profiling identifies a key role for glycine in rapid cancer cell proliferation. Science 336: 1040–1044. [DOI] [PMC free article] [PubMed] [Google Scholar]
- Katz Y, Wang ET, Airoldi EM, Burge CB. 2010. Analysis and design of RNA sequencing experiments for identifying isoform regulation. Nat Methods 7: 1009–1015. [DOI] [PMC free article] [PubMed] [Google Scholar]
- Kaur J. 2014. A comprehensive review on metabolic syndrome. Cardiol Res Pract 2014: 943162. [DOI] [PMC free article] [PubMed] [Google Scholar] [Retracted]
- Keller KE, Doctor ZM, Dwyer ZW, Lee Y-S. 2014. SAICAR induces protein kinase activity of PKM2 that is necessary for sustained proliferative signaling of cancer cells. Mol Cell 53: 700–709. [DOI] [PMC free article] [PubMed] [Google Scholar]
- Knebel B, Haas J, Hartwig S, Jacob S, Köllmer C, Nitzgen U, Muller-Wieland D, Kotzka J. 2012. Liver-specific expression of transcriptionally active SREBP-1c is associated with fatty liver and increased visceral fat mass. PLoS One 7: e31812. [DOI] [PMC free article] [PubMed] [Google Scholar]
- Lakso M, Pichel JG, Gorman JR, Sauer B, Okamoto Y, Lee E, Alt FW, Westphal H. 1996. Efficient in vivo manipulation of mouse genomic sequences at the zygote stage. Proc Natl Acad Sci 93: 5860–5865. [DOI] [PMC free article] [PubMed] [Google Scholar]
- Leng N, Dawson JA, Thomson JA, Ruotti V, Rissman AI, Smits BMG, Haag JD, Gould MN, Stewart RM, Kendziorski C. 2013. EBSeq: an empirical Bayes hierarchical model for inference in RNA-seq experiments. Bioinformatics 29: 1035–1043. [DOI] [PMC free article] [PubMed] [Google Scholar]
- Leung C, Yeoh SW, Patrick D, Ket S, Marion K, Gow P, Angus PW. 2015. Characteristics of hepatocellular carcinoma in cirrhotic and non-cirrhotic non-alcoholic fatty liver disease. World J Gastroenterol 21: 1189–1196. [DOI] [PMC free article] [PubMed] [Google Scholar]
- Li B, Dewey CN. 2011. RSEM: accurate transcript quantification from RNA-seq data with or without a reference genome. BMC Bioinformatics 12: 323. [DOI] [PMC free article] [PubMed] [Google Scholar]
- Li S, Sun R, Chen Y, Wei H, Tian Z. 2015. TLR2 limits development of hepatocellular carcinoma by reducing IL18-mediated immunosuppression. Cancer Res 75: 986–995. [DOI] [PubMed] [Google Scholar]
- Lu Z. 2012. Nonmetabolic functions of pyruvate kinase isoform M2 in controlling cell cycle progression and tumorigenesis. Chin J Cancer 31: 5–7. [DOI] [PMC free article] [PubMed] [Google Scholar]
- Lunt SY, Muralidhar V, Hosios AM, Israelsen WJ, Gui DY, Newhouse L, Ogrodzinski M, Hecht V, Xu K, Acevedo PNM, et al. 2015. Pyruvate kinase isoform expression alters nucleotide synthesis to impact cell proliferation. Mol Cell 57: 95–107. [DOI] [PMC free article] [PubMed] [Google Scholar]
- Luo W, Hu H, Chang R, Zhong J, Knabel M, O'Meally R, Cole RN, Pandey A, Semenza GL. 2011. Pyruvate kinase M2 is a PHD3-stimulated coactivator for hypoxia-inducible factor 1. Cell 145: 732–744. [DOI] [PMC free article] [PubMed] [Google Scholar]
- Lv L, Li D, Zhao D, Lin R, Chu Y, Zhang H, Zha Z, Liu Y, Li Z, Xu Y, et al. 2011. Acetylation targets the M2 isoform of pyruvate kinase for degradation through chaperone-mediated autophagy and promotes tumor growth. Mol Cell 42: 719–730. [DOI] [PMC free article] [PubMed] [Google Scholar]
- Marquardt JU, Andersen JB, Thorgeirsson SS. 2015. Functional and genetic deconstruction of the cellular origin in liver cancer. Nat Rev Cancer 15: 653–667. [DOI] [PubMed] [Google Scholar]
- Mauer J, Denson JL, Brüning JC. 2015. Versatile functions for IL-6 in metabolism and cancer. Trends Immunol 36: 92–101. [DOI] [PubMed] [Google Scholar]
- Mazurek S. 2011. Pyruvate kinase type M2: a key regulator of the metabolic budget system in tumor cells. Int J Biochem Cell Biol 43: 969–980. [DOI] [PubMed] [Google Scholar]
- Mazurek S, Boschek C, Hugo F. 2005. Pyruvate kinase type M2 and its role in tumor growth and spreading. Semin Cancer Biol 15: 300–308. [DOI] [PubMed] [Google Scholar]
- Naugler WE, Sakurai T, Kim S, Maeda S, Kim K, Elsharkawy AM, Karin M. 2007. Gender disparity in liver cancer due to sex differences in MyD88-dependent IL-6 production. Science 317: 121–124. [DOI] [PubMed] [Google Scholar]
- Noguchi T, Yamada K, Inoue H, Matsuda T, Tanaka T. 1987. The L- and R-type isozymes of rat pyruvate kinase are produced from a single gene by use of different promoters. J Biol Chem 262: 14366–14371. [PubMed] [Google Scholar]
- Olive KP, Tuveson DA, Ruhe ZC, Yin B, Willis NA, Bronson RT, Crowley D, Jacks T. 2004. Mutant p53 gain of function in two mouse models of Li-Fraumeni syndrome. Cell 119: 847–860. [DOI] [PubMed] [Google Scholar]
- Patra KC, Hay N. 2014. The pentose phosphate pathway and cancer. Trends Biochem Sci 39: 347–354. [DOI] [PMC free article] [PubMed] [Google Scholar]
- Pi-Sunyer X. 2009. The medical risks of obesity. Postgrad Med 121: 21–33. [DOI] [PMC free article] [PubMed] [Google Scholar]
- Rahman R, Hammoud GM, Almashhrawi AA, Ahmed KT, Ibdah JA. 2013. Primary hepatocellular carcinoma and metabolic syndrome: an update. World J Gastrointest Oncol 5: 186–194. [DOI] [PMC free article] [PubMed] [Google Scholar]
- Schulze K, Imbeaud S, Letouzé E, Alexandrov LB, Calderaro J, Rebouissou S, Couchy G, Meiller C, Shinde J, Soysouvanh F, et al. 2015. Exome sequencing of hepatocellular carcinomas identifies new mutational signatures and potential therapeutic targets. Nat Genet 47: 505–511. [DOI] [PMC free article] [PubMed] [Google Scholar]
- Subramanian A, Tamayo P, Mootha VK, Mukherjee S, Ebert BL, Gillette MA, Paulovich A, Pomeroy SL, Golub TR, Lander ES, et al. 2005. Gene set enrichment analysis: a knowledge-based approach for interpreting genome-wide expression profiles. Proc Natl Acad Sci 102: 15545–15550. [DOI] [PMC free article] [PubMed] [Google Scholar]
- Takenaka M, Yamada K, Lu T, Kang R, Tanaka T, Noguchi T. 1996. Alternative splicing of the pyruvate kinase M gene in a minigene system. Eur J Biochem 235: 366–371. [DOI] [PubMed] [Google Scholar]
- Tong X, Zhao F, Thompson CB. 2009. The molecular determinants of de novo nucleotide biosynthesis in cancer cells. Curr Opin Genet Dev 19: 32–37. [DOI] [PMC free article] [PubMed] [Google Scholar]
- Trapnell C, Pachter L, Salzberg SL. 2009. TopHat: discovering splice junctions with RNA-seq. Bioinformatics 25: 1105–1111. [DOI] [PMC free article] [PubMed] [Google Scholar]
- Tschaharganeh DF, Xue W, Calvisi DF, Evert M, Michurina TV, Dow LE, Banito A, Katz SF, Kastenhuber ER, Weissmueller S, et al. 2014. p53-dependent Nestin regulation links tumor suppression to cellular plasticity in liver cancer. Cell 158: 579–592. [DOI] [PMC free article] [PubMed] [Google Scholar]
- Ueki K, Kondo T, Tseng Y-H, Kahn CR. 2004. Central role of suppressors of cytokine signaling proteins in hepatic steatosis, insulin resistance, and the metabolic syndrome in the mouse. Proc Natl Acad Sci 101: 10422–10427. [DOI] [PMC free article] [PubMed] [Google Scholar]
- Vander Heiden MG, Locasale JW, Swanson KD, Sharfi H, Heffron GJ, Amador-Noguez D, Christofk HR, Wagner G, Rabinowitz JD, Asara JM, et al. 2010. Evidence for an alternative glycolytic pathway in rapidly proliferating cells. Science 329: 1492–1499. [DOI] [PMC free article] [PubMed] [Google Scholar]
- Wang Y-H, Israelsen WJ, Lee D, Yu VWC, Jeanson NT, Clish CB, Cantley LC, Vander Heiden MG, Scadden DT. 2014. Cell-state-specific metabolic dependency in hematopoiesis and leukemogenesis. Cell 158: 1309–1323. [DOI] [PMC free article] [PubMed] [Google Scholar]
- Wong CC-L, Au SL-K, Tse AP-W, Xu IM-J, Lai RK-H, Chiu DK-C, Wei LL, Fan DN-Y, Tsang FH-C, Lo RC-L, et al. 2014. Switching of pyruvate kinase isoform L to m2 promotes metabolic reprogramming in hepatocarcinogenesis. PLoS One 9: e115036. [DOI] [PMC free article] [PubMed] [Google Scholar]
- Yang W, Xia Y, Ji H, Zheng Y, Liang J, Huang W, Gao X, Aldape K, Lu Z. 2011. Nuclear PKM2 regulates β-catenin transactivation upon EGFR activation. Nature 480: 118–122. [DOI] [PMC free article] [PubMed] [Google Scholar]
- Yang W, Xia Y, Cao Y, Zheng Y, Bu W, Zhang L, You MJ, Koh MY, Cote G, Aldape K, et al. 2012a. EGFR-induced and PKCε monoubiquitylation-dependent NF-κB activation upregulates PKM2 expression and promotes tumorigenesis. Mol Cell 48: 771–784. [DOI] [PMC free article] [PubMed] [Google Scholar]
- Yang W, Xia Y, Hawke D, Li X, Liang J, Xing D, Aldape K, Hunter T, Alfred Yung WK, Lu Z. 2012b. PKM2 phosphorylates histone H3 and promotes gene transcription and tumorigenesis. Cell 150: 685–696. [DOI] [PMC free article] [PubMed] [Google Scholar]
- Yang W, Zheng Y, Xia Y, Ji H, Chen X, Guo F, Lyssiotis CA, Aldape K, Cantley LC, Lu Z. 2012c. ERK1/2-dependent phosphorylation and nuclear translocation of PKM2 promotes the Warburg effect. Nat Cell Biol 14: 1295–1304. [DOI] [PMC free article] [PubMed] [Google Scholar]
- Zhang J, Ma C, Liu Y, Yang G, Jiang Y, Xu C. 2014. Interleukin 18 accelerates the hepatic cell proliferation in rat liver regeneration after partial hepatectomy. Gene 537: 230–237. [DOI] [PubMed] [Google Scholar]
Associated Data
This section collects any data citations, data availability statements, or supplementary materials included in this article.