

In this study, Yan et al. use a mouse model to show that loss of folliculin (FLCN), which forms a repressor complex with AMPK, results in a complete metabolic reprogramming of adipose tissues, resulting in enhanced oxidative metabolism. The results provide new insight into the role of FLCN as a negative regulator of mitochondrial function as well as the pathways involved in the browning of white adipocytes and the activity of brown fat.
Keywords: brown fat, high-fat diet, metabolic reprogramming, nuclear receptors, obesity, thermogenesis
Abstract
The tumor suppressor folliculin (FLCN) forms a repressor complex with AMP-activated protein kinase (AMPK). Given that AMPK is a master regulator of cellular energy homeostasis, we generated an adipose-specific Flcn (Adipoq-FLCN) knockout mouse model to investigate the role of FLCN in energy metabolism. We show that loss of FLCN results in a complete metabolic reprogramming of adipose tissues, resulting in enhanced oxidative metabolism. Adipoq-FLCN knockout mice exhibit increased energy expenditure and are protected from high-fat diet (HFD)-induced obesity. Importantly, FLCN ablation leads to chronic hyperactivation of AMPK, which in turns induces and activates two key transcriptional regulators of cellular metabolism, proliferator-activated receptor γ (PPARγ) coactivator-1α (PGC-1α) and estrogen-related receptor α (ERRα). Together, the AMPK/PGC-1α/ERRα molecular axis positively modulates the expression of metabolic genes to promote mitochondrial biogenesis and activity. In addition, mitochondrial uncoupling proteins as well as other markers of brown fat are up-regulated in both white and brown FLCN-null adipose tissues, underlying the increased resistance of Adipoq-FLCN knockout mice to cold exposure. These findings identify a key role of FLCN as a negative regulator of mitochondrial function and identify a novel molecular pathway involved in the browning of white adipocytes and the activity of brown fat.
Obesity is one of the most serious public health problems worldwide and is characterized by the excessive accumulation of lipids in adipose tissue. Obesity is initiated from a chronic imbalance between energy intake and expenditure and is a major risk factor for metabolic disorders such as type 2 diabetes, cardiovascular diseases, and certain cancers. There are two major types of adipose tissue with distinct functions: white adipose tissue (WAT) and brown adipose tissue (BAT). WAT is mainly involved in the storage of lipids, mostly triglycerides (TGs), whereas BAT specializes in the oxidation of lipids by mitochondria in order to produce heat through a process of nonshivering thermogenesis (Rosen and Spiegelman 2006). Recently, a third type of adipose tissue, named brite (“brown and white”) or beige, was identified. It resides in certain depots of WAT and exhibits an inducible BAT phenotype in response to appropriate stimuli such as cold exposure or β-adrenergic stimulation (Wu et al. 2012; Schulz et al. 2013). Notably, beige adipocytes are characterized by an induction of thermogenic gene expression, such as proliferator-activated receptor γ (PPARγ) coactivator-1α (PGC-1α) and uncoupling proteins (UCP1 and UCP3), and at least partial conversion of unilocular adipocytes into multilocular mitochondria-rich adipocytes (Wang et al. 2001; Harms and Seale 2013). The distribution of brite/beige cells differs between WAT depots in mice. A large accumulation of brown-like cells can be found in the subcutaneous inguinal WAT (iWAT) but is also occasionally observed in gonadal/perigonadal WAT (gWAT) during cold exposure (Seale et al. 2011). Remarkably, many studies have reported that mice displaying an increase in the abundance of brite/beige adipocytes in WAT are associated with resistance to high-fat diet (HFD)-induced obesity (Hansen et al. 2004; Ye et al. 2012; Rajakumari et al. 2013). Therefore, understanding the underlying mechanisms of WAT browning has attracted much interest to prevent, control, or treat obesity.
Birt-Hogg-Dube (BHD) syndrome is an autosomal dominant hereditary disorder characterized by a predisposition to develop melanoma, hair follicle tumors, lung and kidney cysts, renal cell carcinoma, and colon cancer. This syndrome is caused by loss-of-function mutations of a tumor suppressor gene that encodes a 64-kDa protein named folliculin (FLCN) (Baba et al. 2006). FLCN has no significant sequence homology with any known protein and is highly conserved across species, suggesting an important biological role, as illustrated by the embryonic lethality of Flcn homozygous disruption in mice (Baba et al. 2008; Chen et al. 2008; Hudon et al. 2010). FLCN functions as a repressor of the master energy sensor AMP-activated protein kinase (AMPK) via FLCN-interacting protein (FNIP) (Baba et al. 2006, 2008; Behrends et al. 2010; Preston et al. 2011; Possik et al. 2014; Yan et al. 2014).
AMPK is an evolutionarily conserved serine/threonine protein kinase that plays a key role in cellular and whole-body energy homeostasis. When cellular energy levels drop, AMP or ADP binds to the γ subunit of AMPK and induces its allosteric conformational change. This change leads to the activation of AMPK by phosphorylation in an attempt to restore energy balance by switching cells from an anabolic (ATP consumption) to a catabolic (ATP production) state (Mihaylova and Shaw 2011). Activation of AMPK leads to a concomitant increase in the phosphorylation of acetyl-CoA carboxylase (ACC), which inhibits fatty acid synthesis and promotes fatty acid oxidation (FAO) by up-regulation of CPT-1 activity (Dobrzyn et al. 2004). Pharmacological activation of AMPK in mice leads to an increase in adipose tissue browning and a decrease in fat mass. Similarly, constitutive activation of hepatic AMPK-α1 in mice induces resistance to HFD-induced obesity (Zhang et al. 2012). Therefore, FLCN modulation of AMPK activity might affect lipid metabolism and WAT/BAT functions.
We reported previously that ablation of FLCN expression or loss of FLCN binding to AMPK induces chronic AMPK pathway hyperactivation in nematodes and various cellular contexts, leading to increased energy reserves, enhanced metabolic and osmotic stress resistance, and metabolic transformation (Preston et al. 2011; Possik et al. 2014; Yan et al. 2014). This hyperactivation of AMPK induces the expression of PGC-1α in muscle cells, mouse embryonic fibroblasts (MEFs), and cancer cells, which triggers mitochondrial biogenesis and promotes transcriptional regulation of nuclear-encoded mitochondrial genes (Jäger et al. 2007; Yan et al. 2014). Up-regulation of PGC-1α expression in adipose tissues also leads to increased mitochondrial biogenesis and protects from HFD-induced obesity in mice (Ye et al. 2012). To control mitochondrial gene expression, PGC-1α acts in concert with the transcription factor estrogen-related receptor α (ERRα), a member of the nuclear receptor family (Giguère 2008). The PGC-1α/ERRα transcriptional axis is now well appreciated as a master transcriptional regulatory node of cell metabolism, binding and regulating the vast majority of nuclear-encoded mitochondrial genes (Eichner and Giguère 2011), illustrative of their positive control of mitochondrial activity and heat production in BAT (Villena et al. 2007; Handschin and Spiegelman 2013). Moreover, upon FLCN inactivation and consequent AMPK hyperactivation, PGC-1α and ERRα might act as downstream effectors of FLCN to mediate metabolic cellular reprogramming.
To investigate the potential role of FLCN in fat metabolism, we generated an adipose-specific Flcn (Adipoq-FLCN) knockout mouse model. Adipoq-FLCN knockout mice exhibited an elevated energy expenditure, providing protection from HFD-induced obesity. Notably, loss of FLCN induced AMPK-dependent PGC-1α/ERRα transcriptional control of energy metabolism and stimulated mitochondrial biogenesis and activity in both WAT and BAT. Importantly, loss of FLCN in adipose tissue resulted in a higher abundance of brite/beige adipocytes in WAT, underlying the increased resistance to cold exposure in these mice via a greater induction in UCP1 levels and thus promoting uncoupling and FAO to generate heat.
Results
Adipose-specific FLCN knockout mice are resistant to HFD-induced obesity
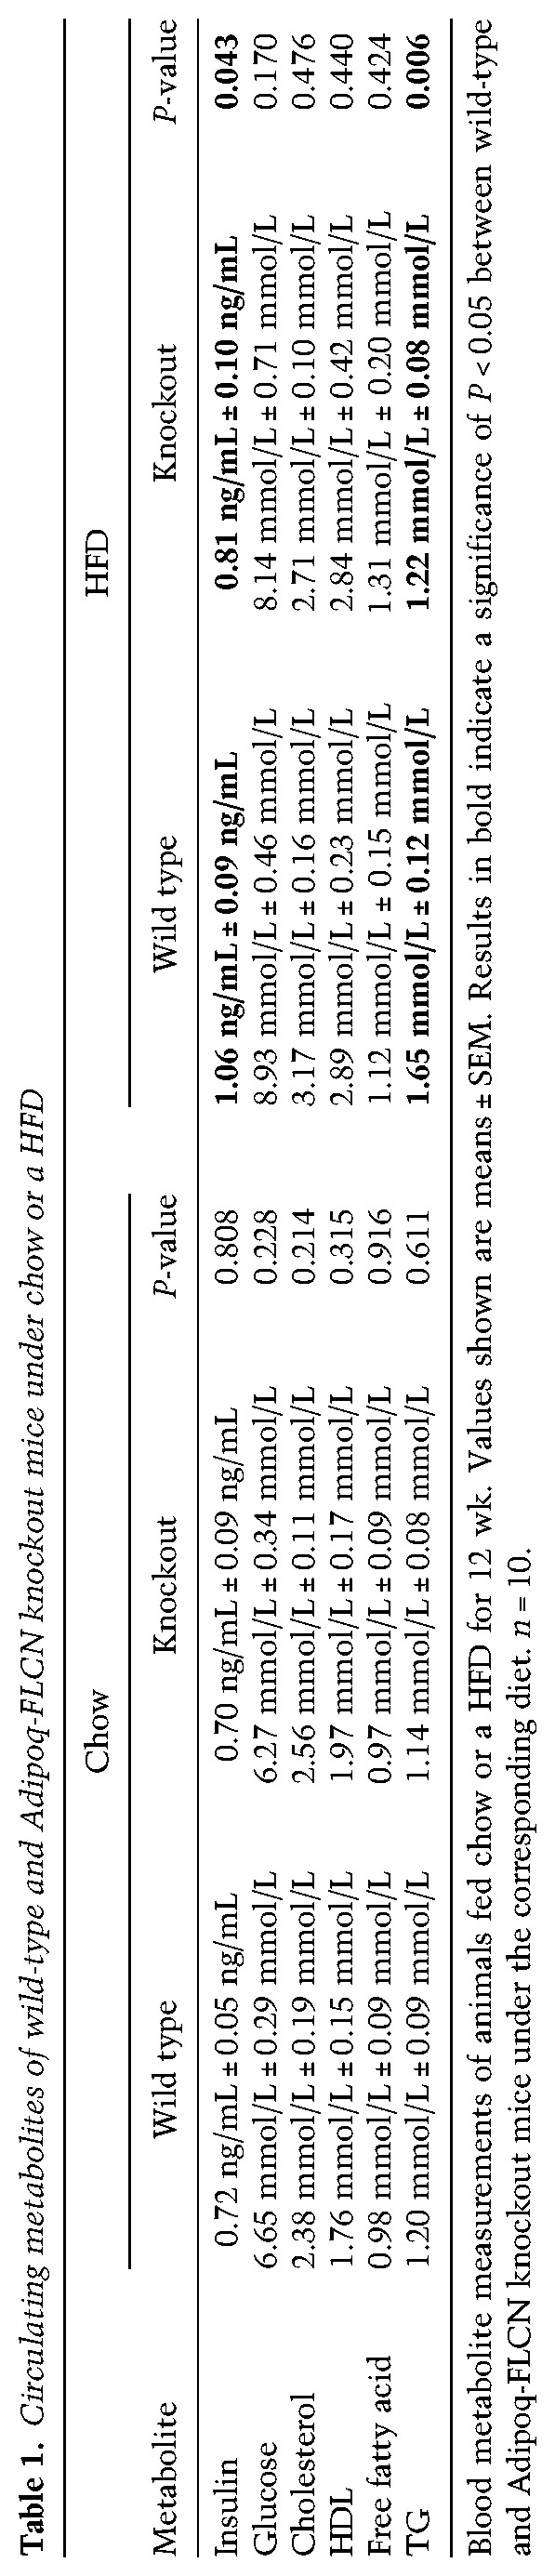
Global homozygous deletion of Flcn in mice results in early embryonic lethality around day 8.5 (Baba et al. 2008; Chen et al. 2008; Hudon et al. 2010). To elucidate the role of FLCN in adipose tissue, we generated an adipose-specific FLCN knockout mouse model by crossing Flcnlox/lox mice (loxP sites flanking exon 7) (Supplemental Fig. S1A,B; Baba et al. 2008) with adiponectin-Cre mice (Lee et al. 2013) to generate mice with conditional Flcn disruption in both WAT and BAT (Adipoq-FLCN knockout) (Fig. 1A). Adipoq-FLCN knockout mice are born at the expected Mendelian frequency, display no developmental defects, survive without difficulty, are fertile, and have similar weights compared with wild-type mice at weaning (4 wk of age). To establish whether loss of FLCN in adipose tissue alters the metabolic physiology of the mice, we first subjected wild-type and FLCN knockout mice to either normal chow or a HFD over a 14-wk period. No difference in weight gain over time was observed between chow-fed wild-type and knockout mice (Fig. 1B). However, FLCN knockout mice displayed increased resistance to weight gain under a HFD challenge (Fig. 1B,C). Next, we assessed the levels of circulating metabolites between wild-type and Adipoq-FLCN knockout mice under both chow and a HFD. No differences between the mice were found under chow (Table 1). Under a HFD, wild-type mice exhibited an increase in blood glucose, insulin, cholesterol, HDL, and TG levels compared with a standard chow diet. The HFD-induced rise in circulating insulin and TG levels in wild-type mice was not observed in the FLCN knockout mice (Table 1). Consistent with these results, under a HFD diet, Adipoq-FLCN mice exhibited improved glucose handling, demonstrated by reduced blood glucose levels during both glucose tolerance tests (GTTs) and insulin tolerance tests (ITTs) (Fig. 1D,E). No difference in GTTs and ITTs between chow-fed wild-type and knockout mice was observed (Supplemental Fig. S1C,D).
Figure 1.
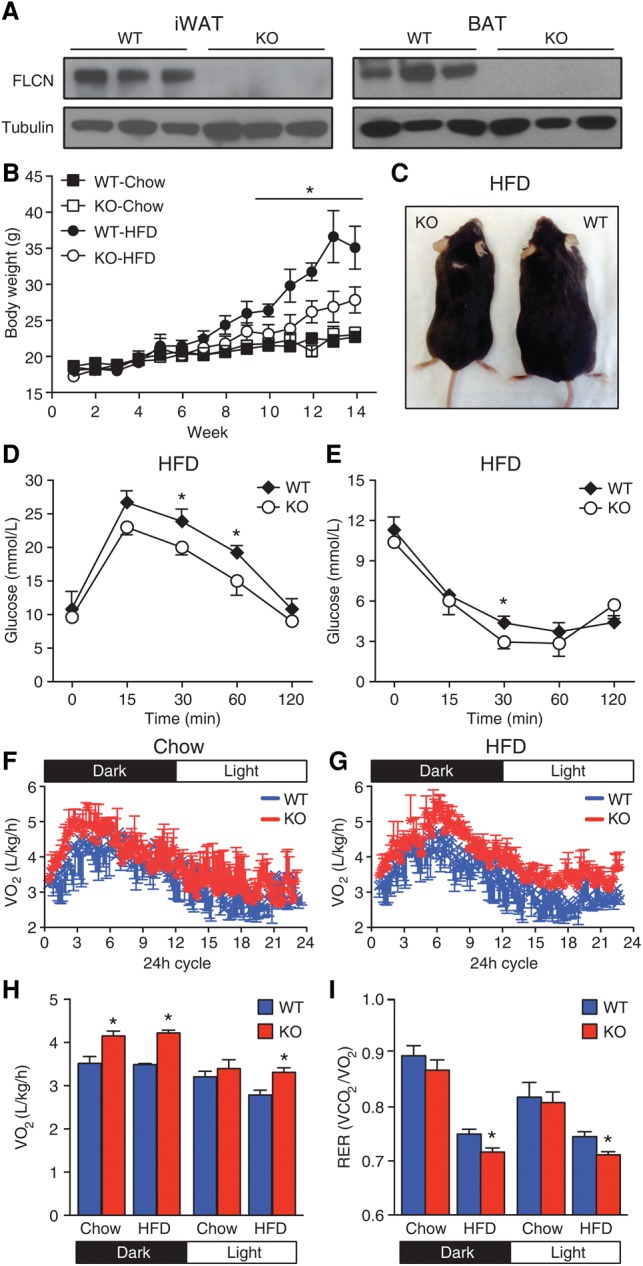
Adipose-specific Flcn deletion protects from HFD-induced obesity. (A) Western blot analysis of FLCN expression levels in iWAT (left) and BAT (right) of 5-mo-old mice. Tubulin was used as loading control. (B–I) Six-week-old wild-type or Adipoq-FLCN knockout mice were fed with either chow or a HFD. (B) Body weight gain of mice during a 14-wk period measured weekly. (C) Representative mouse images of 5-mo-old wild-type or Adipoq-FLCN knockout mice fed a HFD for 13 wk. (D) Blood glucose during a GTT in HFD-fed wild-type or Adipoq-FLCN knockout mice following a 16-h fast and intraperitoneal glucose administration of 2 g per kilogram of body weight. (E) Blood glucose during an ITT in HFD-fed wild-type or Adipoq-FLCN knockout mice following a 16-h fast and intraperitoneal insulin administration of 0.75 U per kilogram of body weight. (F–I) Metabolic cage analyses of 4-mo-old mice fed with chow or HFD and housed individually for 3 d. The VO2 consumption during a 12-h light:12-h dark cycle (F,G), mean VO2 consumption levels (H), and the respiratory exchange ratio (RER; VCO2/VO2) (I) were measured simultaneously. Data in B, D, E, H, and I are presented as mean ± SEM. n = 8–10 mice per genotype per diet. (*) P < 0.05.
Table 1.
Circulating metabolites of wild-type and Adipoq-FLCN knockout mice under chow or a HFD
To gain further insight into the effect of adipose-specific Flcn deletion on whole-body metabolism, metabolic cages were used for the simultaneous measurement of food intake, physical activity, and energy expenditure (VO2 consumption and VCO2 production) in the mice. Four-month-old mice fed chow or a HFD were examined during a 3-d period. No significant difference in food intake, total activity, or VCO2 production was observed between wild-type and knockout mice (Supplemental Fig. S1E–G). However, Adipoq-FLCN knockout mice were found to have higher VO2 consumption rates throughout a 12-h light:12-h dark cycle under both chow and a HFD (Fig. 1F–H). In addition, the respiratory exchange ratio (RER = VCO2/VO2) was significantly lower in HFD-fed Adipoq-FLCN knockout mice compared with wild type (Fig. 1I), indicating increased oxidation of fatty acids in response to enriched nutritional stress in these mice. Taken together, the data demonstrate that adipose-specific loss of FLCN ameliorates the metabolic profile of mice, protecting them from diet-induced obesity.
Disruption of Flcn alters adipocyte physiology
To help elucidate the underlying mechanism governing protection against diet-induced obesity in Adipoq-FLCN knockout mice, we isolated different fat depots and tissues of 5-mo-old mice and measured their weights relative to the whole-body weights of the mice. We observed markedly decreased iWAT and gWAT mass in knockout animals compared with wild type under a HFD (Fig. 2A). No significant difference in BAT and other isolated organ weights (liver, heart, kidney, and spleen) between wild-type and knockout mice was found (Fig. 2B; Supplemental Fig. S2A). In line with the observed resistance to a HFD, white adipocytes of Adipoq-FLCN knockout mice were significantly smaller in size compared with wild-type mice under a HFD (Fig. 2B,C). Of note, no differences were observed in BAT cell size between the mice (Fig. 2B,C).
Figure 2.
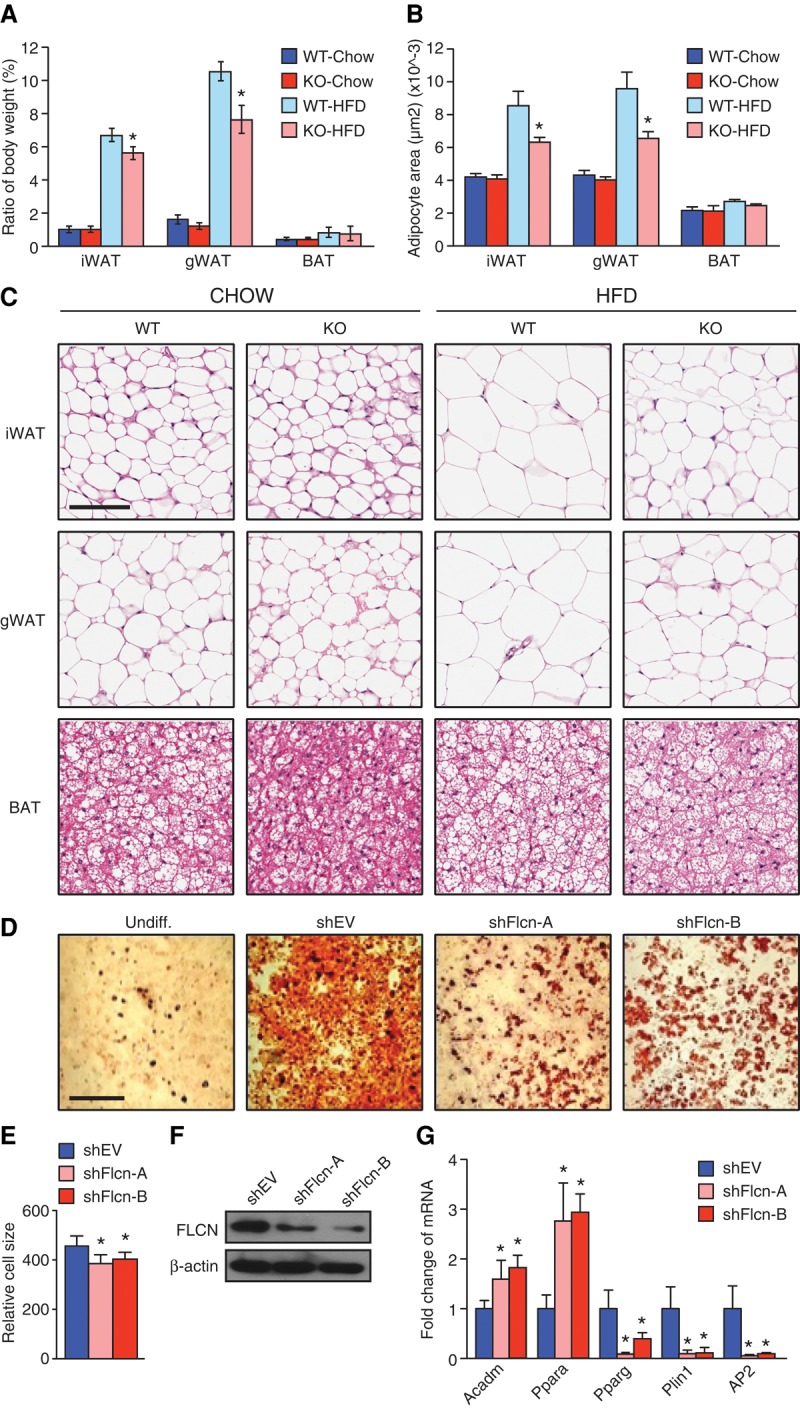
Loss of FLCN decreases lipid accumulation and adipocyte cell size. (A) Fat index (percentage of fat pad weight relative to the whole-body weight) of iWAT, gWAT, and BAT. (B) Mean adipocyte area of adipose tissues quantified from hematoxylin and eosin (H&E)-stained tissue sections, five fields per mouse, using Metaxpress software. (C) Representative images of H&E-stained adipose tissue sections from 5-mo-old mice fed either chow or a HFD. Magnification, 20×. Bar, 100 µm. Lipid droplet production as demonstrated by Oil-Red-O staining (D) and relative units of cell size (E) measured by FACS analysis in differentiated 3T3-L1 adipocytes at day 6 after induction of differentiation. (Undiff.) Undifferentiated 3T3-L1 cells as a control. Bar, 20 µm. (F) Determination of FLCN protein levels following FLCN knockdown in 3T3-L1 adipocytes using shRNA (shFlcn-A and shFlcn-B) or control shRNA (shEV). (G) Relative mRNA levels of genes involved in lipid oxidation (Acadm and Ppara) as well as adipocyte differentiation markers (Pparg, Plin1, and AP2). Data in A and B are presented as mean ± SEM (n = 8–10 mice per genotype per diet), and the data in E and G are presented as mean ± SEM of four independent experiments performed in triplicate. (*) P < 0.05.
Next, we addressed whether loss of FLCN expression in vitro could mimic the effect on adipocyte cell size observed in vivo. To this end, 3T3-L1 cells were transduced with either shEV as control or one of two shRNAs specific for Flcn (shFlcn-A and shFlcn-B), and cells were induced to differentiate into adipocytes by which cell size and lipid production were assessed. We observed a significant decrease in adipocyte cell size, reflecting the reduction in lipid droplet production in 3T3-L1 adipocytes lacking FLCN compared with control cells at day 6 of differentiation (Fig. 2D–F; Supplemental Fig. S2B,C). In support of these observations, the expression of two FAO genes (Acadm and Ppara) was increased, and three markers of differentiation (Pparg, Plin1, and Fabp4 [AP2]) were decreased in 3T3-L1 adipocytes lacking FLCN relative to control cells at differentiation day 6 (Fig. 2G). These results prompted us to investigate the molecular signature of FLCN-null adipocytes responsible for the altered metabolic and lipid storage phenotype.
Loss of FLCN in vivo results in metabolic reprogramming and browning of WAT via AMPK/PGC-1α/ERRα signaling
FLCN interacts with AMPK and has been described as a negative regulator of AMPK signaling (Baba et al. 2006; Possik et al. 2014, 2015; Yan et al. 2014). Indeed, we recently demonstrated that loss of FLCN constitutively activates AMPKα, which in turn leads to an elevation in PGC-1α levels and consequently induces mitochondrial biogenesis (Yan et al. 2014). ERRα is now well recognized as one of the major partners of PGC-1α in regulating mitochondrial metabolism and is an important component of the transcriptional network that drives mitochondrial biogenesis and oxidative capacity in BAT (Villena et al. 2007). Thus, ERRα may play a central role in WAT metabolic reprogramming of Adipoq-FLCN knockout mice.
Western blot analysis of iWAT and BAT lysates show increased phosphorylation of AMPK (pT172-AMPKα) in Adipoq-FLCN knockout mice under both chow and HFD conditions, with a concomitant elevation in the phosphorylation status of ACC (pS78-ACC), a major downstream target of AMPK that inhibits fatty acid synthesis (Fig. 3A,B). In parallel, both transcript and protein levels of PGC-1α and ERRα were significantly increased in Adipoq-FLCN knockout mice under both diets (Fig. 3A–C; Supplemental Fig. S3A). Consistent with the increased abundance of the metabolic regulators PGC-1α and ERRα, FLCN-null adipose tissues had elevated expression of mitochondrial oxidative phosphorylation (OXPHOS) genes (Cox5b, Cox8b, Ndufb4, and Uqcr10) as well as higher levels of Mterf1 and Tfam, two important regulators of mitochondrial biogenesis (Fig. 3D; Supplemental Fig. S3A). In accordance with these observations, FLCN-null iWAT and BAT had increased mitochondrial DNA:nuclear DNA (mtDNA:nDNA) ratios compared with wild-type (Fig. 3E). In support of the increased abundance of mitochondria and oxidative potential in Adipoq-FLCN knockout mice, we found increased expression of Acadm to be involved in lipid oxidation in WATs of these mice (Fig. 3F; Supplemental Fig. S3A). In addition, a HFD led to an induction of the lipogenic genes Fasn and Scd1 in wild-type but not Adipoq-FLCN knockout WAT (Fig. 3F; Supplemental Fig. S3A). No significant difference in adipose inflammatory gene expression between the mice was found under either chow diet or a HFD (Supplemental Fig. S3B).
Figure 3.

FLCN repression up-regulates an AMPK/PGC-1α/ERRα molecular axis, promoting metabolic reprogramming and WAT browning. (A,B) Western blot analysis performed with the indicated antibodies on iWAT (A) and BAT (B) of 4-mo-old mice fed either chow or a HFD. Relative expression of mRNA transcripts encoding PGC-1α (Ppargc1a) and ERRα (Esrra) (C) as well as mRNA levels of mitochondrial associated genes (D) in iWAT and BAT of wild-type and Adipoq-FLCN knockout mice are shown. (E) Adipose tissue mitochondrial content was determined by the ratio of mtDNA:nDNA. Quantitative RT–PCR (qRT–PCR) analysis of genes related to lipid metabolism (F) and thermogenesis (G) in iWAT and BAT of wild-type and Adipoq-FLCN knockout mice. (H) UCP1 protein levels in BAT of wild-type and Adipoq-FLCN-null mice fed chow or a HFD. Tubulin levels are shown as a loading control. Data in C–G are presented as mean ± SEM. n = 8–10 mice per group. (*) P < 0.05.
Next, we quantified markers of BAT in the mice, including genes encoding UCP proteins, which enable mitochondria to generate heat instead of ATP through the dissipation of the mitochondrial proton gradient. Interestingly, we observed increased mRNA levels of Ucp1 and Ucp3 in both WAT and BAT of Adipoq-FLCN knockout mice compared with wild-type littermates (Fig. 3G; Supplemental Fig. S3A). In agreement with these data, we found greater UCP1 protein levels in BAT of FLCN knockout mice (Fig. 3H), while UCP1 levels were below the limit of detection in WATs. In addition, we found increased transcript levels of PR domain-containing 16 (Prdm16) in knockout adipose tissues (Fig. 3G; Supplemental Fig. S3A), another important factor that has been associated with brown-like adipocytes (Seale et al. 2011; Harms et al. 2014). Analysis of other brown fat markers revealed altered expression of Cidea and Dio3 in FLCN-null WAT (Supplemental Fig. S3C). Collectively, our data indicate that repression of FLCN up-regulates an AMPK/PGC-1α/ERRα axis, promoting white adipose browning and BAT activity and thus enhancing both mitochondrial oxidative capacity and burning of fat.
FLCN knockdown drives AMPK-induced PGC-1α/ERRα transcriptional activity, stimulating mitochondrial oxidative function
We next sought to validate in vitro our findings of an AMPK/PGC-1α/ERRα signaling axis in Adipoq-FLCN mice that is responsible for the increased ability to burn fat via WAT browning and increased adipose mitochondrial activity. We took advantage of previously described MEFs that were deleted for Flcn (Possik et al. 2014; Yan et al. 2014). First, we confirmed that Flcn ablation led to an activated AMPK signaling pathway and increased PGC-1α and ERRα transcript and protein levels (Fig. 4A,B). Additionally, several mitochondrial proteins were up-regulated in FLCN knockout MEFs (Fig. 4A). Moreover, we observed increased mRNA levels of metabolic genes linked to FAO, including Cpt1a and Acadvl, as well as the brown adipocyte markers Ucp1 and Prmd16 (Fig. 4B). Next, the activity of the PGC-1α/ERRα transcriptional axis was assessed using a luciferase-based system containing three ERR response elements (ERREs). As expected, a significant increase in luciferase activity was observed in FLCN-null MEFs, indicating increased PGC-1/ERR activity in these cells (Fig. 4C). Accordingly, ChIP-qPCR (chromatin immunoprecipitation [ChIP] and quantitative PCR [qPCR]) analysis demonstrated a significant global increase in ERRα DNA binding (P = 1 × 10⁻⁵), with increased binding to known metabolic target genes involved in mitochondrial activity, such as Aco2 required for the citric acid cycle (CAC) and several OXPHOS genes (Atp5b, Atp5g3, Ndufb4, Uqcr1, and Uqcr10) (Fig. 4D). Similar results were obtained in 3T3-L1 cells using two independent shRNAs against Flcn (Supplemental Fig. S4A–D). In support of the increased oxidative metabolic signature observed with FLCN repression, extracellular flux experiments established that FLCN knockout MEFs exhibit significantly higher oxygen consumption rates (OCRs) (Fig. 4E,F). Addition of etomoxir, which blocks the production of energy generated by FAO by inhibiting CPT-1, repressed to a greater extent the OCRs of FLCN knockout MEFs compared with that observed in wild-type MEFs (Fig. 4E,F). Moreover, we determined the OCR profile of the cells by sequential addition of the mitochondrial complex V inhibitor oligomycin, responsible for ATP synthesis, followed by the uncoupling agent p-trifluoromethoxy carbonyl cyanide phenyl hydrazone (FCCP) and addition of rotenone, a mitochondrial complex I inhibitor. FLCN knockout MEFs were found to have markedly greater FCCP-stimulated OCRs relative to control cells, demonstrating that loss of FLCN results in enhanced mitochondrial function and respiratory capacity. Knockdown of ERRα by use of specific siRNAs completely abolished the improved metabolic oxidative capacity of MEFs lacking FLCN (Fig. 4G,H). Similarly, the induced OCR observed in wild-type MEFs treated with siRNAs against Flcn was lost in siFlcn-treated primary ERRα-null MEFs (Supplemental Fig. S4E,F).
Figure 4.

PGC-1α/ERRα expression/activity and mitochondrial respiration are induced upon loss of FLCN in an AMPK-dependent manner. (A) Western blot analysis of the indicated proteins is shown in wild-type and FLCN-null MEFs. (B) Transcript levels of Ppargc1a, Esrra, and genes related to mitochondrial activity in FLCN wild-type or knockout MEFs are shown. (C) PGC-1/ERR activity assessed using an ERRE luciferase reporter assay in MEFs expressing FLCN or not. (D) Relative fold enrichments of ERRα binding to metabolic target genes by ChIP-qPCR in wild-type or FLCN knockout MEFs. n = 3. (E) Extracellular OCR profiles following addition of the indicated mitochondrial perturbing drugs in FLCN wild-type or knockout MEFs. (Oligo) Oligomycin. (F, left) Etomoxir, an inhibitor of FAO, abolished the induced OCR levels in FLCN-null MEFs. (Right) Western blot analysis of FLCN protein levels in wild-type and FLCN knockout MEFs. β-Actin levels are shown as a loading control. (G) Extracellular OCR profiles following addition of the indicated mitochondrial perturbing drugs in FLCN wild-type or knockout MEFs treated with siRNAs against ERRα (siERRα) or control (siC). (Oligo) Oligomycin. (H, left) The increased OCR in FLCN knockout MEFs was lost when ERRα expression was inhibited. (Right) Western blot analysis of FLCN and ERRα protein levels in the wild-type or FLCN MEFs treated with or without siERRα or siC. β-Actin levels are shown as a loading control. (I) Western blot analysis of the indicated proteins are shown in wild-type and AMPKα-null MEFs treated with shRNAs against FLCN (shFlcn) or control (shEV). (J) Transcript levels of Ppargc1a, Esrra, and genes related to FAO and thermogenesis in AMPKα wild-type and knockout MEFs treated with or without shFlcn. (K) Loss of AMPKα in MEFs abolished the increased recruitment of ERRα to metabolic target genes following FLCN repression as determined by ChIP-qPCR analyses. n = 3. Data in B, C, E–H, and J are presented as mean ± SEM taken from at least three independent experiments. (*) P < 0.05.
To confirm that AMPK is responsible for induction of PGC-1α/ERRα activity following FLCN inhibition, we used previously described MEFs deleted for Prkaa1 and Prkaa2 (encoding the two catalytic AMPKα subunits) (Yan et al. 2014). Importantly, genetic inactivation of AMPKα blocked the induction of both PGC-1α and ERRα expression, the transcript levels of FAO and BAT-associated genes, and ERRα recruitment to CAC and OXPHOS target genes (Fig. 4I–K). Altogether, the data clearly demonstrate a functional link between AMPK and PGC-1α/ERRα responsible for the metabolic reprogramming induced upon FLCN loss of function.
FLCN ablation enhances resistance to cold
Adaptive nonshivering thermogenesis is a key defense response to maintain body temperature in the cold, particularly in small mammals and newborns, which is mediated by BAT (Kusminski and Scherer 2012). Both PGC-1α and ERRα are required for proper adaptive thermogenesis under cold exposure as well as for heat production by positively regulating mitochondrial activity and uncoupling (Puigserver et al. 1998; Schreiber et al. 2004; Uldry et al. 2006; Villena et al. 2007). As our data collectively show that loss of FLCN increases PGC-1α/ERRα activity and mitochondrial oxidative capacity, impairs lipid accumulation, and promotes browning of WAT, we hypothesized that Adipoq-FLCN knockout mice would have an elevated tolerance to cold exposure. To test this possibility, we examined the body temperature adaptation to cold exposure of two cohorts of 3-mo-old chow-fed wild-type and Adipoq-FLCN knockout mice. The mice were maintained for 24 h at thermoneutrality (30°C) and then transferred to 4°C in individual precooled cages, and the body temperature of the mice was recorded hourly using a rectal probe thermometer. Body temperatures between the genotypes were equal prior to cold exposure (time = 0) (Fig. 5A). During exposure to cold over a 5-h period, the body temperature of the wild-type mice dropped significantly after 3 h, while the Adipoq-FLCN knockout mice showed improved tolerance, indicating increased adaptive thermogenesis in these mice (Fig. 5A). As such, higher levels of thermogenic genes were found in BAT but also WAT of Adipoq-FLCN knockout mice, including Ppargc1a (PGC-1α) and Ucp1 following cold exposure (Fig. 5B; Supplemental Fig. S5). Notably, we observed >20-fold higher Ucp1 mRNA levels in both iWAT and gWAT of Adipoq-FLCN knockout mice compared with wild-type mice. Increased UCP1 protein accumulation in BAT and iWAT of Adipoq-FLCN knockout mice was confirmed using Western blotting and immunohistochemistry, respectively (Fig. 5C,D). Taken together, our data demonstrate that targeting FLCN improves resistance to cold exposure via induction of a thermogenic gene program, browning of WAT, and increased uncoupling potential in BAT.
Figure 5.

FLCN ablation in adipose tissues promotes cold resistance and browning of iWAT. Three-month-old wild-type or Adipoq-FLCN knockout mice were housed for 24 h at 30°C (thermoneutrality) and then transferred to 4°C in individual precooled cages. (A) Rectal temperature recordings taken hourly during 5 h of cold exposure using a rectal digital probe (Physitemp Instruments, Inc.). (B) Relative mRNA expression of thermogenic markers determined by qRT–PCR in BAT and iWAT of FLCN wild-type or knockout mice isolated following 5 h of cold exposure. (C) Western blot analysis of UCP1 proteins levels in BAT of wild-type or FLCN knockout mice after 5 h of cold exposure. FLCN protein levels are shown, and tubulin was used as loading control. (D) Immunohistochemistry (IHC) staining with a UCP1-specific antibody (left) and H&E staining (right) in iWAT sections of cold-exposed FLCN wild-type or knockout mice. Bar, 100 µm. Data in A and B are presented as mean ± SEM. n = 6 animals pre genotype. (*) P < 0.05.
Discussion
In the present study, we showed that deletion of Flcn in mouse adipose tissues leads to a complete metabolic reprogramming of both white and brown adipocytes. As a result, adipose-specific Flcn knockout mice exhibit significantly higher energy expenditure associated with an increase in mitochondrial respiration. Importantly, this remodeling induces several advantages in vivo, including resistance to obesity and increased adaptive thermogenesis. Mechanistically, we demonstrated that the absence of FLCN in adipose tissues activates AMPK, thereby inducing the activity of the PGC-1α/ERRα transcriptional axis. Together, they positively modulated the expression of nuclear-encoded mitochondrial genes, thus enhancing mitochondrial biogenesis and activity as well as lipid oxidation. Overall, our results establish a critical role of FLCN as a negative regulator of oxidative metabolism, functionally linking the FLCN/AMPK and PGC-1α/ERRα transcriptional axis.
As observed in vivo and in vitro, FLCN repression activates AMPK, which drives PGC-1α expression and results in increased mitochondrial activity, as observed previously (Possik et al. 2014; Yan et al. 2014; Audet-Walsh et al. 2016). It is known that AMPK activation can induce PGC-1α activity by two distinct mechanisms: directly by phosphorylation and indirectly by increasing its expression (Jäger et al. 2007; Yan et al. 2014). Once activated, PGC-1α can increase its own expression as well as that of ERRα increasing the binding of ERRα to its promoter (Laganière et al. 2004; Mootha et al. 2004). This autoregulation induces a positive feedback loop between PGC-1α and ERRα, which is likely the underlying reason why both transcriptional regulators are up-regulated following FLCN repression or genetic ablation. PGC-1α, together with ERRα, acts as a key regulatory unit of energy homeostasis in both normal and cancer cells (Giguère 2008; Deblois et al. 2013). Here, we demonstrate that, upon AMPK activation, PGC-1α/ERRα act as downstream effectors of AMPK to stimulate mitochondrial biogenesis and activity. Indeed, the induction of ERRα DNA binding at several of its metabolic target genes involved in the CAC (Aco2) and electron transport chain (e.g., Atp5g3, Ndufb4, and Uqcr10) following FLCN repression was abolished in AMPKα−/− MEFs (Fig. 4K). As a consequence, Adipoq-FLCN-null mice are more resistant to HFD-induced obesity due to the metabolic reprogramming of WAT, increasing lipid oxidation over storage in addition to stimulating the mitochondrial potential of BAT, again favoring fat burning. Similarly, loss of Fnip1, which belongs to the FLCN/FNIP/AMPK complex, results in chronic AMPK activation and increased oxidative metabolism in β cells and skeletal muscle in an AMPK/PGC1α-dependent manner (Park et al. 2012; Reyes et al. 2015). Discovery of pharmacological tools designed to inhibit FLCN expression or interfere with the formation of the FLCN/FNIP/AMPK complex would therefore be of great interest to treat obesity and other related metabolic disorders.
There has been considerable effort in the last several years toward understanding the role of transcription factors in white adipocyte browning. Notably, PRDM16, PPARγ, and PGC-1α have been shown to be critical determinants in the transcriptional control of mitochondrial and thermogenic genes during this transition (Seale et al. 2011; Kleiner et al. 2012). We can now add FLCN as a negative regulator of the WAT browning but also ERRα as an effector in this process, acting downstream from the activated AMPK pathway in Adipoq-FLCN knockout mice. Importantly, we determined that Adipoq-FLCN knockout mice have significantly higher levels of PGC-1α, ERRα, and brown fat markers in both WAT and BAT, especially under a HFD. Notably, FLCN-null adipose tissues express increased levels of genes encoding the uncoupling proteins UCP1 and UCP3 as well as PRDM16 and CIDEA. Although it is not clear whether ERRα can modulate UCP expression directly, it indirectly affects their activity by stimulating mitochondrial biogenesis, therefore increasing the ability of the cells to produce heat (Schreiber et al. 2004; Villena et al. 2007). In addition, PRDM16 and PGC-1α were recently shown to interact together at the Ucp1 promoter (Iida et al. 2015), suggesting that the observed induction in UCP1 expression in vivo and in vitro following FLCN repression is in part due to increased expression of these two factors. Additionally, activation of AMPK promotes FAO through inactivation of ACC via direct phosphorylation and, by promoting CPT-1 activity, the shuttle, allowing entry of fatty acids in mitochondria. Overall, Flcn deletion in adipose tissue results in activation of an AMPK/PGC-1α/ERRα molecular axis, promoting mitochondrial biogenesis, oxygen consumption, FAO, UCP expression, and heat production, thereby shifting white adipocytes from “lipid storage compartments” to active sites of lipid metabolism.
Genetic loss of ERRα in mice has been previously described to confer resistance to HFD-induced obesity, attributable to altered lipid metabolism in these mice (Luo et al. 2003), in addition to decreased lipid absorption in the intestinal system (Carrier et al. 2004). On the other hand, increased ERRα activity achieved by up-regulation of PGC-1β in mice also conferred resistance to HFD-induced obesity due to a global increase in energy expenditure (Kamei et al. 2003). In line with our results, these studies highlight ERRα as a key regulator of lipid handling and utilization. Importantly, the observed hyperactivation of ERRα when FLCN is repressed was shown to be AMPK-dependent, as deletion of AMPK in MEFs abrogated ERRα activity. Interestingly, modulation of ERRα or ERRγ expression in mouse muscle cells also affects AMPK activity, indicating that ERRs themselves can activate the AMPK pathway, possibly underlying a positive feedback loop between AMPK and the ERRs (Dufour et al. 2007; Narkar et al. 2011).
In conclusion, we revealed that loss of FLCN is involved in an AMPK-dependent induction of metabolically active adipose tissue, particularly involving browning of WAT via induction of a PGC-1α/ERRα transcriptional program, enhancing mitochondrial oxidative metabolism. These results show an unexpected role for FLCN in metabolic control and identify a novel molecular pathway involved in browning of white adipocytes. The findings described here also highlight new possibilities for obesity treatment strategies through the role of FLCN in adipocyte metabolism.
Materials and methods
Reagents
Commercial antibodies were purchased as follows: β-actin (Sigma-Aldrich, AC74), PGC-1α (Calbiochem, 4C1.3), ERRα (Epitomics, 2131), tubulin (Sigma, T9026), AMPKα (Cell Signaling Technology, 2532), phospho (Thr172) AMPKα (Cell Signaling Technology, 2531), ACC (Cell Signaling Technology, 3676), phospho (S79) ACC (Cell Signaling Technology, 3661), Mito OXPHOS (Abcam, ab110413), and UCP1 (Abcam, 10983). Anti-mouse FLCN polyclonal antibody was generated by the McGill University Animal Resource Center Services through injecting purified GST-FLCN recombinant protein in rabbits as reported (Yan et al. 2014).
Animals
All procedures for generating the Flcn knockout mouse model were performed at McGill University. Maintenance and experimental manipulation of mice were performed according to the guidelines and regulations of the McGill University Research and Ethic Animal Committee and the Canadian Council on Animal Care. All studies were carried out using C57BL/6 female mice obtained from The Jackson Laboratory and housed on a 12-h light:12-h dark cycle at 22°C. Flcnf/f (BHDf/f) mice were generated as previously described (Baba et al. 2008). To generate adipose-specific Flcn knockout mice, Flcnf/f mice were crossed with Adipoq-Cre transgenic mice (kind gift from Dr. André Marette, Laval University, Quebec, Canada). Flcn knockout mice were generated by crossing female Flcnf/f mice homozygous for the floxed allele with Flcnf/+; Adipoq-Cre+/− males. Mice were fed on a chow diet containing 10 kcal percent fat (D12450B, Research Diet, Inc.) or subjected to a HFD containing 60 kcal percent fat (D12492, Research Diet, Inc.) beginning at ∼6–7 wk of age as indicated and fed ad libidum. Body weight and food intake were measured weekly.
Metabolic measurements in vivo
Mice were housed individually in metabolic cages for 72 h at a 12-h light:12-h dark cycle with free access to food and water using a comprehensive laboratory animal monitoring system (CLAMS; Columbus Instruments). Food, energy expenditure, physical activity, and RER (calculated as VCO2/VO2) were assessed simultaneously.
GTTs and ITTs
For the GTTs, mice on either chow or a HFD were subjected to a 16-h fast with free access to water and then injected intraperitoneally with 2 g of 20% D-glucose per kilogram of body weight. The ITTs were performed similarly, with an initial 16 h of fasting and subsequent intraperitoneal injection of 0.75 U of insulin per kilogram of body weight. Blood glucose levels were measured at 0, 15, 30, 60, and 120 min with a OneTouch ultramini glucose meter (OneTouch).
Blood metabolites
Blood was collected after a 16-h fast from the abdominal vena cava at sacrifice. Plasma insulin levels were quantified using an ultrasensitive mouse insulin ELISA kit (Crystal Chem, catalog no. 90080). Free fatty acid levels were measured using a free fatty acid quantification kit (Sigma-Aldrich, FG0100) according to the manufacturer's instructions. Plasma glucose, cholesterol, TGs, and HDL were determined by the Diagnostic Laboratory of Comparative Medicine Animal Resources Centre at McGill University.
RNA isolation and real-time PCR analysis
Total RNA from cultured cells or mouse tissues was isolated by TRIzol (Ambion) extraction and purified using RNeasy minicolumns according to the manufacturer's instructions (Qiagen). For quantitative real-time PCR analysis, 1 μg of total RNA was reverse-transcribed using the SuperScript III kit (Invitrogen). SYBR Green reactions using the SYBR Green qPCR supermix (Invitrogen) and specific primers (Supplemental Table S1) were performed using an MX300 (Stratagene). Relative expression of mRNAs was determined after normalization to the housekeeping gene RPLP0. Student's t-test was used to evaluate statistical significance.
Western blot analysis
For whole-cell lysates, cells were washed twice with cold phosphate-buffered saline (PBS) and lysed in AMPK lysis buffer as previously described (Yan et al. 2014). Mouse tissues were isolated, snap-frozen in liquid nitrogen, and stored at −80°C. For protein extraction from WAT and BAT, ∼60 mg of frozen tissue was homogenized using Tissuelyser (Qiagen) in 1× RIPA buffer containing 0.1% SDS in 100 µL of lysis buffer (Tris at pH 7.5, 2 mM EDTA, 2 mM EGTA, 0.5 M mannitol, 1% Triton, phosphatase, protease inhibitors). Extracts were spun down, and the fat layer and cell debris were removed before analysis by Western blotting.
Mitochondrial and nuclear DNA quantification
The relative number of mitochondria in mouse adipose tissue was determined by measuring the ratio of mtDNA:nDNA. Total cellular DNA from iWAT and BAT was extracted using the DNeasy blood and tissue kit (Qiagen), and the relative levels of mtDNA and nDNA were quantified using primers specific for mitochondrial Cox2 (mt-Cox2; forward, 5′-GCCGACTAAATCAAGCAACA-3′; and reverse, 5′-CAATGGGCATAAAGCTATGG-3′) and the nuclear gene Hbb-b1 (forward, 5′-GAAGCGATTCTAGGGAGCAG-3′; and reverse, 5′-GGAGCAGCGATTCTGAGTAGA-3′).
ERRE luciferase reporter assays
MEFs or 3T3-L1 cells were transfected with the firefly luciferase PGC-1α/ERRα activity reporter pGL2-TK-ERRE plasmid for 24 h (Laganière et al. 2004). Luciferase activity was measured using the dual-luciferase assay system (Promega) and normalized to TK-Renilla reporter control activity, according to the manufacturer's instructions.
Oxygen consumption in vitro
OCR profiles were determined using the XF24 extracellular flux analyzer (Seahorse Bioscience). Briefly, 20,000 cells per well were seeded, and, after 24 h, medium was changed for the nonbuffered Seahorse assay medium supplemented with 25 mM glucose, 1 mM glutamine, and 1 mM Na-pyruvate and equilibrated in a CO2-free incubator for 1 h at 37°C. OCR measurements were obtained at baseline and following injection of 100 µM Etomoxir, 10 µM oligomycin, 3 µM carbonylcyanide-p-trifluoromethoxyphenylhydrazone (FCCP, Sigma), and 10 µM rotenone (Sigma). The value of basal respiration, mitochondrial proton leak, maximal respiration, and nonmitochondrial respiration was determined as described in the Seahorse operator's manual.
Cold exposure studies
Three-month-old chow-fed mice were housed individually in cages for 24 h at 30°C with free access to food and water and then transferred to a cold room at 4°C. Body temperature was measured hourly for 5 h using a digital rectal probe (Physitemp Instruments, Inc.). At the end of the experiment, mice were sacrificed, and adipose tissues were harvested (iWAT, gWAT, and BAT), snap-frozen in liquid nitrogen, and stored at −80°C.
Histology
For histological analysis, adipose tissues were fixed in 4% formaldehyde overnight at room temperature immediately after sacrifice, embedded in paraffin, and cut to 6-μm sections on slides. The slides were stained with hematoxylin and eosin (Sigma) according to the standard protocol. Adipocyte area was determined using Metaxpress software for integrated morphology analysis. At least 30 fields from random sections of each mouse sample were quantified. Immunohistochemistry was performed using the VectaStain Elite ABC kit according to the manufacturer's instructions using rabbit UCP1 antibodies (1:1000) as described previously (Harms et al. 2014).
Cell culture
The MEF cell lines with AMPKα1/AMPKα2 (Prkaa1 and Prkaa2) double knockout and Flcn knockdown were previously described (Yan et al. 2014). Primary wild-type and ERRα-null MEFs were produced in the laboratory. 3T3-L1 cells were obtained from American Type Culture Collection, and FLCN knockdown was generated using shRNA pLKO-puro lentiviral transduction according to the standard protocol (Mission, Sigma). The cells were grown at 37°C in 5% CO2 in 10% FBS-DMEM. After 2 d of post-confluence (counted as day 0), adipocyte differentiation was induced with MDI (0.5 mM IBMX, 1 µg/mL insulin, 10 µM dexamethasone) for 2 d. Cells were then maintained in growth medium supplemented with 1 µg/mL insulin (maintenance medium) and grown for up to 12 d. The medium was changed every 2 d. At day 6, fully differentiated cells were assessed by Oil-Red-O staining, or RNA was extracted for qRT–PCR analysis.
FACS analysis
3T3-L1 differentiated cells at differentiation day 6 were trypsinized and resuspended in FACS buffer (PBS containing 1.5% BSA). The mean intensity of forward scatter (FSC) was measured using the FACSCalibur flow cytometer (BD Biosciences).
Oil-Red-O staining
The differentiated 3T3-L1 adipocytes were assessed using a typical Oil-Red-O staining. Cells were washed with 1× PBS and fixed with 4% paraformaldehyde for 60 min. Cells were rinsed twice with deionized water followed by adding Oil-Red-O in 60% isopropanol for 20 min and rinsed again. The cells were mounted on coverslips, visualized, and photographed using a Zeiss microscope under 20× magnification and a Axio Cam MRC digital camera.
ChIP-qPCR analysis
MEFs or undifferentiated 3T3-L1 preadipocytes were cross-linked with 1% formaldehyde, and nuclei were enriched by sequential centrifugations. After sonication, immunoprecipitation was performed overnight at 4°C with an anti-ERRα rabbit antibody (Epitomics 2131) or a control anti-rabbit IgG antibody (Sigma-Aldrich) using Dynabeads (Life Technologies). Enriched DNA was then purified using the Qiagen PCR purification kit and analyzed by qPCR using a Roche LightCycler 480. Nontargeted rabbit IgG ChIP was used as a control of antibody-nonspecific binding, and two negative regions (Ctrl 1 and Ctrl 2) were used for normalization. Fold enrichment was calculated following normalization with both negative regions and IgG background (set at 1). ChIP primers are listed in Supplemental Table S1.
Supplementary Material
Acknowledgments
We thank Dr. Claire Brown and Erika Tse-Luen Wee for assistance with image analyses (McGill Imaging Facility), Ken McDonald for cell sorting analysis (McGill Flow Cytometry Facility), and Jean-Martin Lapointe and Jo-Ann Bader for tissue processing (Goodman Cancer Research Centre Histology Facility at McGill University). We thank André Marette (Laval University) for the Adipoq-Cre transgenic mouse strain, and Wissal El-Assaad for technical support. We kindly thank Marie-Claude Gingras for critical reading of the manuscript, and our laboratory colleagues for critical comments on this study. M.Y. was a holder of the Canadian Institutes of Health Research (CIHR) Doctoral Research Award. E.A.-W. is recipient of a post-doctoral fellowship from CIHR and the Fonds de Recherche du Québec–Santé (FRQS). Both M.Y. and E.A.-W. are supported by the McGill Integrated Cancer Research Training Program (MICRTP) scholarship. This work was funded by the Kidney Foundation of Canada KFOC100021 (A.P.), the Myrovlytis Trust (A.P.), a Terry Fox Research Institute Program Project Team Grant on Oncometabolism (116128), the New Innovation Fund CFI 21875, CIHR MOP-125885 (V.G.), and McGill University.
Footnotes
Supplemental material is available for this article.
Article is online at http://www.genesdev.org/cgi/doi/10.1101/gad.281410.116.
References
- Audet-Walsh E, Papadopoli DJ, Gravel SP, Yee T, Bridon G, Caron M, Bourque G, Giguère V, St-Pierre J. 2016. The PGC-1α/ERRα axis represses one-carbon metabolism and promotes sensitivity to anti-folate therapy in breast cancer. Cell Rep 14: 920–931. [DOI] [PubMed] [Google Scholar]
- Baba M, Hong SB, Sharma N, Warren MB, Nickerson ML, Iwamatsu A, Esposito D, Gillette WK, Hopkins RF III, Hartley JL, et al. 2006. Folliculin encoded by the BHD gene interacts with a binding protein, FNIP1, and AMPK, and is involved in AMPK and mTOR signaling. Proc Natl Acad Sci 103: 15552–15557. [DOI] [PMC free article] [PubMed] [Google Scholar]
- Baba M, Furihata M, Hong SB, Tessarollo L, Haines DC, Southon E, Patel V, Igarashi P, Alvord WG, Leighty R, et al. 2008. Kidney-targeted Birt-Hogg-Dube gene inactivation in a mouse model: Erk1/2 and Akt–mTOR activation, cell hyperproliferation, and polycystic kidneys. J Natl Cancer Inst 100: 140–154. [DOI] [PMC free article] [PubMed] [Google Scholar]
- Behrends C, Sowa ME, Gygi SP, Harper JW. 2010. Network organization of the human autophagy system. Nature 466: 68–76. [DOI] [PMC free article] [PubMed] [Google Scholar]
- Carrier JC, Deblois G, Champigny C, Levy E, Giguère V. 2004. Estrogen-related receptor α (ERRα) is a transcriptional regulator of apolipoprotein A-IV and controls lipid handling in the intestine. J Biol Chem 279: 52052–52058. [DOI] [PubMed] [Google Scholar]
- Chen J, Futami K, Petillo D, Peng J, Wang P, Knol J, Li Y, Khoo SK, Huang D, Qian CN, et al. 2008. Deficiency of FLCN in mouse kidney led to development of polycystic kidneys and renal neoplasia. PLoS One 3: e3581. [DOI] [PMC free article] [PubMed] [Google Scholar]
- Deblois G, St-Pierre J, Giguère V. 2013. The PGC-1/ERR signaling axis in cancer. Oncogene 32: 3483–3490. [DOI] [PubMed] [Google Scholar]
- Dobrzyn P, Dobrzyn A, Miyazaki M, Cohen P, Asilmaz E, Hardie DG, Friedman JM, Ntambi JM. 2004. Stearoyl-CoA desaturase 1 deficiency increases fatty acid oxidation by activating AMP-activated protein kinase in liver. Proc Natl Acad Sci 101: 6409–6414. [DOI] [PMC free article] [PubMed] [Google Scholar]
- Dufour CR, Wilson BJ, Huss JM, Kelly DP, Alaynick WA, Downes M, Evans RM, Blanchette M, Giguère V. 2007. Genome-wide orchestration of cardiac functions by the orphan nuclear receptors ERRα and γ. Cell Metab 5: 345–356. [DOI] [PubMed] [Google Scholar]
- Eichner LJ, Giguère V. 2011. Estrogen related receptors (ERRs): a new dawn in transcriptional control of mitochondrial gene networks. Mitochondrion 11: 544–552. [DOI] [PubMed] [Google Scholar]
- Giguère V. 2008. Transcriptional control of energy homeostasis by the estrogen-related receptors. Endocr Rev 29: 677–696. [DOI] [PubMed] [Google Scholar]
- Handschin C, Spiegelman BM. 2013. Peroxisome proliferator-activated receptor γ coactivator 1 coactivators, energy homeostasis, and metabolism. Endocr Rev 27: 728–735. [DOI] [PubMed] [Google Scholar]
- Hansen JB, Jørgensen C, Petersen RK, Hallenborg P, De Matteis R, Bøye HA, Petrovic N, Enerbäck S, Nedergaard J, Cinti S. 2004. Retinoblastoma protein functions as a molecular switch determining white versus brown adipocyte differentiation. Proc Natl Acad Sci 101: 4112–4117. [DOI] [PMC free article] [PubMed] [Google Scholar]
- Harms M, Seale P. 2013. Brown and beige fat: development, function and therapeutic potential. Nat Med 19: 1252–1263. [DOI] [PubMed] [Google Scholar]
- Harms MJ, Ishibashi J, Wang W, Lim H-W, Goyama S, Sato T, Kurokawa M, Won K-J, Seale P. 2014. Prdm16 is required for the maintenance of brown adipocyte identity and function in adult mice. Cell Metab 19: 593–604. [DOI] [PMC free article] [PubMed] [Google Scholar]
- Hudon V, Sabourin S, Dydensborg AB, Kottis V, Ghazi A, Paquet M, Crosby K, Pomerleau V, Uetani N, Pause A. 2010. Renal tumour suppressor function of the Birt-Hogg-Dube syndrome gene product folliculin. J Med Genet 47: 182–189. [DOI] [PubMed] [Google Scholar]
- Iida S, Chen W, Nakadai T, Ohkuma Y, Roeder RG. 2015. PRDM16 enhances nuclear receptor-dependent transcription of the brown fat-specific Ucp1 gene through interactions with Mediator subunit MED1. Gene Dev 29: 308–321. [DOI] [PMC free article] [PubMed] [Google Scholar]
- Jäger S, Handschin C, St-Pierre J, Spiegelman BM. 2007. AMP-activated protein kinase (AMPK) action in skeletal muscle via direct phosphorylation of PGC-1α. Proc Natl Acad Sci 104: 12017–12022. [DOI] [PMC free article] [PubMed] [Google Scholar]
- Kamei Y, Ohizumi H, Fujitani Y, Nemoto T, Tanaka T, Takahashi N, Kawada T, Miyoshi M, Ezaki O, Kakizuka A. 2003. PPARγ coactivator 1β/ERR ligand 1 is an ERR protein ligand, whose expression induces a high-energy expenditure and antagonizes obesity. Proc Natl Acad Sci 100: 12378–12383. [DOI] [PMC free article] [PubMed] [Google Scholar]
- Kleiner S, Douris N, Fox EC, Mepani RJ, Verdeguer F, Wu J, Kharitonenkov A, Flier JS, Maratos-Flier E, Spiegelman BM. 2012. FGF21 regulates PGC-1α and browning of white adipose tissues in adaptive thermogenesis. Gene Dev 26: 271–281. [DOI] [PMC free article] [PubMed] [Google Scholar]
- Kusminski CM, Scherer PE. 2012. Mitochondrial dysfunction in white adipose tissue. Trends Endocrinol Metab 23: 435–443. [DOI] [PMC free article] [PubMed] [Google Scholar]
- Laganière J, Tremblay GB, Dufour CR, Giroux S, Rousseau F, Giguère V. 2004. A polymorphic autoregulatory hormone response element in the human estrogen-related receptor α (ERRα) promoter dictates peroxisome proliferator-activated receptor γ coactivator-1α control of ERRα expression. J Biol Chem 279: 18504–18510. [DOI] [PubMed] [Google Scholar]
- Lee KY, Russell SJ, Ussar S, Boucher J, Vernochet C, Mori MA, Smyth G, Rourk M, Cederquist C, Rosen ED. 2013. Lessons on conditional gene targeting in mouse adipose tissue. Diabetes 62: 864–874. [DOI] [PMC free article] [PubMed] [Google Scholar]
- Luo J, Sladek R, Carrier J, Bader J-A, Richard D, Giguère V. 2003. Reduced fat mass in mice lacking orphan nuclear receptor estrogen-related receptor α. Mol Cell Biol 23: 7947–7956. [DOI] [PMC free article] [PubMed] [Google Scholar]
- Mihaylova MM, Shaw RJ. 2011. The AMPK signalling pathway coordinates cell growth, autophagy and metabolism. Nat Cell Biol 13: 1016–1023. [DOI] [PMC free article] [PubMed] [Google Scholar]
- Mootha VK, Handschin C, Arlow D, Xie X, Pierre JS, Sihag S, Yang W, Altshuler D, Puigserver P, Patterson N. 2004. Errα and Gabpa/b specify PGC-1α-dependent oxidative phosphorylation gene expression that is altered in diabetic muscle. Proc Natl Acad Sci 101: 6570–6575. [DOI] [PMC free article] [PubMed] [Google Scholar]
- Narkar VA, Fan W, Downes M, Ruth TY, Jonker JW, Alaynick WA, Banayo E, Karunasiri MS, Lorca S, Evans RM. 2011. Exercise and PGC-1α-independent synchronization of type I muscle metabolism and vasculature by ERRγ. Cell Metab 13: 283–293. [DOI] [PMC free article] [PubMed] [Google Scholar]
- Park H, Staehling K, Tsang M, Appleby MW, Brunkow ME, Margineantu D, Hockenbery DM, Habib T, Liggitt HD, Carlson G. 2012. Disruption of Fnip1 reveals a metabolic checkpoint controlling B lymphocyte development. Immunity 36: 769–781. [DOI] [PMC free article] [PubMed] [Google Scholar]
- Possik E, Jalali Z, Nouet Y, Yan M, Gingras MC, Schmeisser K, Panaite L, Dupuy F, Kharitidi D, Chotard L, et al. 2014. Folliculin regulates ampk-dependent autophagy and metabolic stress survival. PLoS Genet 10: e1004273. [DOI] [PMC free article] [PubMed] [Google Scholar]
- Possik E, Ajisebutu A, Manteghi S, Gingras MC, Vijayaraghavan T, Flamand M, Coull B, Schmeisser K, Duchaine T, van Steensel M, et al. 2015. FLCN and AMPK confer resistance to hyperosmotic stress via remodeling of glycogen stores. PLoS Genet 11: e1005520. [DOI] [PMC free article] [PubMed] [Google Scholar]
- Preston RS, Philp A, Claessens T, Gijezen L, Dydensborg AB, Dunlop EA, Harper KT, Brinkhuizen T, Menko FH, Davies DM, et al. 2011. Absence of the Birt-Hogg-Dube gene product is associated with increased hypoxia-inducible factor transcriptional activity and a loss of metabolic flexibility. Oncogene 30: 1159–1173. [DOI] [PMC free article] [PubMed] [Google Scholar]
- Puigserver P, Wu Z, Park CW, Graves R, Wright M, Spiegelman BM. 1998. A cold-inducible coactivator of nuclear receptors linked to adaptive thermogenesis. Cell 92: 829–839. [DOI] [PubMed] [Google Scholar]
- Rajakumari S, Wu J, Ishibashi J, Lim HW, Giang AH, Won KJ, Reed RR, Seale P. 2013. EBF2 determines and maintains brown adipocyte identity. Cell Metab 17: 562–574. [DOI] [PMC free article] [PubMed] [Google Scholar]
- Reyes NL, Banks GB, Tsang M, Margineantu D, Gu H, Djukovic D, Chan J, Torres M, Liggitt HD, Hirenallur SD, et al. 2015. Fnip1 regulates skeletal muscle fiber type specification, fatigue resistance, and susceptibility to muscular dystrophy. Proc Natl Acad Sci 112: 424–429. [DOI] [PMC free article] [PubMed] [Google Scholar]
- Rosen ED, Spiegelman BM. 2006. Adipocytes as regulators of energy balance and glucose homeostasis. Nature 444: 847–853. [DOI] [PMC free article] [PubMed] [Google Scholar]
- Schreiber SN, Emter R, Hock MB, Knutti D, Cardenas J, Podvinec M, Oakeley EJ, Kralli A. 2004. The estrogen-related receptor α (ERRα) functions in PPARγ coactivator 1α (PGC-1α)-induced mitochondrial biogenesis. Proc Natl Acad Sci 101: 6472–6477. [DOI] [PMC free article] [PubMed] [Google Scholar]
- Schulz TJ, Huang P, Huang TL, Xue R, McDougall LE, Townsend KL, Cypess AM, Mishina Y, Gussoni E, Tseng YH. 2013. Brown-fat paucity due to impaired BMP signalling induces compensatory browning of white fat. Nature 495: 379–383. [DOI] [PMC free article] [PubMed] [Google Scholar]
- Seale P, Conroe HM, Estall J, Kajimura S, Frontini A, Ishibashi J, Cohen P, Cinti S, Spiegelman BM. 2011. Prdm16 determines the thermogenic program of subcutaneous white adipose tissue in mice. J Clin Invest 121: 96. [DOI] [PMC free article] [PubMed] [Google Scholar]
- Uldry M, Yang W, St-Pierre J, Lin J, Seale P, Spiegelman BM. 2006. Complementary action of the PGC-1 coactivators in mitochondrial biogenesis and brown fat differentiation. Cell Metab 3: 333–341. [DOI] [PubMed] [Google Scholar]
- Villena JA, Hock MB, Chang WY, Barcas JE, Giguère V, Kralli A. 2007. Orphan nuclear receptor estrogen-related receptor α is essential for adaptive thermogenesis. Proc Natl Acad Sci 104: 1418–1423. [DOI] [PMC free article] [PubMed] [Google Scholar]
- Wang SP, Laurin N, Himms-Hagen J, Rudnicki MA, Levy E, Robert MF, Pan L, Oligny L, Mitchell GA. 2001. The adipose tissue phenotype of hormone-sensitive lipase deficiency in mice. Obes Res 9: 119–128. [DOI] [PubMed] [Google Scholar]
- Wu J, Boström P, Sparks LM, Ye L, Choi JH, Giang A-H, Khandekar M, Virtanen KA, Nuutila P, Schaart G. 2012. Beige adipocytes are a distinct type of thermogenic fat cell in mouse and human. Cell 150: 366–376. [DOI] [PMC free article] [PubMed] [Google Scholar]
- Yan M, Gingras M-C, Dunlop EA, Nouët Y, Dupuy F, Jalali Z, Possik E, Coull BJ, Kharitidi D, Dydensborg AB. 2014. The tumor suppressor folliculin regulates AMPK-dependent metabolic transformation. J Clin Invest 124: 2640. [DOI] [PMC free article] [PubMed] [Google Scholar]
- Ye L, Kleiner S, Wu J, Sah R, Gupta RK, Banks AS, Cohen P, Khandekar MJ, Boström P, Mepani RJ. 2012. TRPV4 is a regulator of adipose oxidative metabolism, inflammation, and energy homeostasis. Cell 151: 96–110. [DOI] [PMC free article] [PubMed] [Google Scholar]
- Zhang W, Zhang X, Wang H, Guo X, Li H, Wang Y, Xu X, Tan L, Mashek MT, Zhang C. 2012. AMP-activated protein kinase α1 protects against diet-induced insulin resistance and obesity. Diabetes 61: 3114–3125.22829451 [Google Scholar]
Associated Data
This section collects any data citations, data availability statements, or supplementary materials included in this article.