

Abstract
A meta-analysis was performed to assess the diagnostic value of gastrin-17 (G-17) for the early detection of chronic atrophic gastritis (CAG).
An extensive literature search was performed, with the aim of selecting publications that reported the accuracy of G-17 in predicting CAG, in the following databases: PubMed, Science Direct, Web of Science, Chinese Biological Medicine, Chinese National Knowledge Infrastructure, Wanfang, and VIP. To assess the diagnostic value of G-17, the following statistics were estimated and described: sensitivity, specificity, diagnostic odds ratios (DOR), summary receiver operating characteristic curves, area under the curve (AUC), and 95% confidence intervals (CIs).
Thirteen studies that met the inclusion criteria were included in this meta-analysis, comprising 894 patients and 1950 controls. The pooled sensitivity and specificity of these studies were 0.48 (95% CI: 0.45–0.51) and 0.79 (95% CI: 0.77–0.81), respectively. The DOR was 5.93 (95% CI: 2.93–11.99), and the AUC was 0.82.
G-17 may have potential diagnostic value because it has good specificity and a moderate DOR and AUC for CAG. However, more studies are needed to improve the sensitivity of this diagnostic tool in the future.
INTRODUCTION
Gastric cancer (GC) is one of the most common malignancies and a leading cause of cancer-related deaths in many parts of the world.1 Early diagnosis of GC is the most effective way to reduce mortality related to this disease.2 It is, however, very difficult to make an early diagnosis for GC because it is asymptomatic or has nonspecific symptoms in its early stage. There is therefore an urgent need for noninvasive tests that can diagnose early-stage gastric carcinoma.
Chronic atrophic gastritis (CAG) is a well-established premalignant gastric condition that is usually caused by Helicobacter pylori (H pylori).3 CAG results in a loss of glandular structures and a collapse of the reticular skeleton of the stomach mucosa.4 Previous studies have shown that atrophic gastritis is an extremely important precancerous disease and that its early diagnosis is essential to stopping its progress with prompt treatment and surveillance.5,6
Recent studies have shown that decreases in the serum levels of certain biomarkers may be a valuable tool for use in screening for gastric atrophy.7–9 Serological tests for these biomarkers are noninvasive, low in cost, and convenient compared to nonserological tests, such as endoscopy and histological investigations.10 Detection of serum levels of the H pylori protein cytotoxin-associated gene A has been used to identify patients at high risk for CAG.11 Measurements of the serum levels of pepsinogen I or the ratio of pepsinogen I to pepsinogen II are also commonly used nonendoscopic tools for diagnosing CAG.12 Several recent studies have also reported that gastrin can be used as a functional marker of the state of the gastric mucosa.13 High serum levels of gastrin usually indicate a diagnosis of CAG. Gastrin-17 (G-17) is a protein that is specifically secreted from antral G cells, and it has been suggested that its serum level may reflect the severity of antral atrophy more accurately than serum total gastrin.14 However, other studies have demonstrated that the gastric serum profile is not reliable for use in the diagnosis of atrophy.14–16
A growing number of recent studies have reported on the utilization of G-17 as a diagnostic biomarker for CAG,17,18 with mixed confidence. Hosseini et al6 found that G-17 levels were significantly different between atrophy and control groups. However, Leja et al16 showed that G-17 was highly specific in a Caucasian subgroup, but not in an Asian subgroup. The objective of this meta-analysis was to evaluate the diagnostic value of G-17 detection in CAG, including an analysis of sensitivity and specificity.
METHODS
Search Strategy and Selection Criteria
A literature search was performed using the following databases: PubMed, Science Direct, Web of Science, Chinese Biological Medicine, Chinese National Knowledge Infrastructure, Wanfang, and VIP. Search key words, including “gastric cancer or gastric neoplasm or stomach neoplasm or gastrointestinal cancer or gastrointestinal neoplasm or atrophic gastritis,” “gastrin-17 or G-17,” “diagnostic,” and “sensitivity and specificity,” were used to identify appropriate research papers that were published before May, 2015. In addition, we manually searched the references that were listed in the identified publications for relevant papers. Duplicated results and irrelevant articles were removed from this study.
Two reviewers (WX and LL) independently reviewed and evaluated the full text of each publication. The selected studies included publications that reported the results of G-17 tests combined with diagnosis by histopathology (endoscopy), and included information on true positives (TP), false positives (FP), true negatives (TN), and false negatives (FN). Exclusion criteria included the following: the study did not provide sufficient data to calculate TP, FP, TN, and FN; subjects were enrolled without a diagnosis; study subjects were not human (i.e., the studies were in tissues or animals); and the publication was a review article, letter, single case report, conference summary, or memorandum.
Data Extraction Procedure and Quality Assessment
Two reviewers (WX and LL) independently evaluated and extracted data from the selected studies. Data regarding the following factors were considered: name of first author, year of publication, country of origin of the study, study population characteristics, number of patients and controls included, methods used to measure G-17, cut-off values, results of TP, FP, FN, and TN, the score of the quality assessment of diagnositic accuracy studies (QUADAS), and studies that did or did not use a blind control design. The reviewers discussed cases in which disagreement occurred.
The quality of the methods used in the selected studies was graded by 2 reviewers (LL and WX) using the Standards for Reporting Diagnostic Accuracy and Quality Assessment of Diagnositic Accuracy Studies (QUADAS) tools.19,20 Standards for Reporting Diagnostic Accuracy consists of a 25-item checklist. The QUADAS tool consists of a set of 14 items, each of which should be scored as 1 for yes, 0 for unclear, or −1 for no. Two reviewers independently assessed all studies and resolved disagreements by discussion.
Statistical Analysis
The standard methods recommended for the diagnostic accuracy of meta-analyses were used in the present study.21 Analyses were performed using 2 statistical software programs (Meta-Disc 1.4 for Windows and Stata, version 12.0). Forest plots were performed to calculate the pooled estimates of sensitivity, specificity, positive likelihood ratio (PLR), negative likelihood ratio (NLR), and diagnostic odds ratios (DOR). Threshold effect was investigated using the Spearman correlation coefficient.22 Heterogeneity among different studies was reported using the Cochran Q statistic and the index of inconsistency (I2).21
Further analyses were performed to explore the sources of heterogeneity. Stratified analyses according to the source of populations (Asian and non-Asian), the classification of control groups (without gastritis and gastritis without atrophy), assay method (radio immunoassay [RIA] and enzyme immunoassay [EIA]) and studies with or without blinding (blinded method and not mentioned) were conducted. Publication bias was assessed by the Deeks funnel plot asymmetry test.
All analyses were based on previous published studies, thus no ethical approval and patient consent are required.
RESULTS
Characteristics of Selected Studies
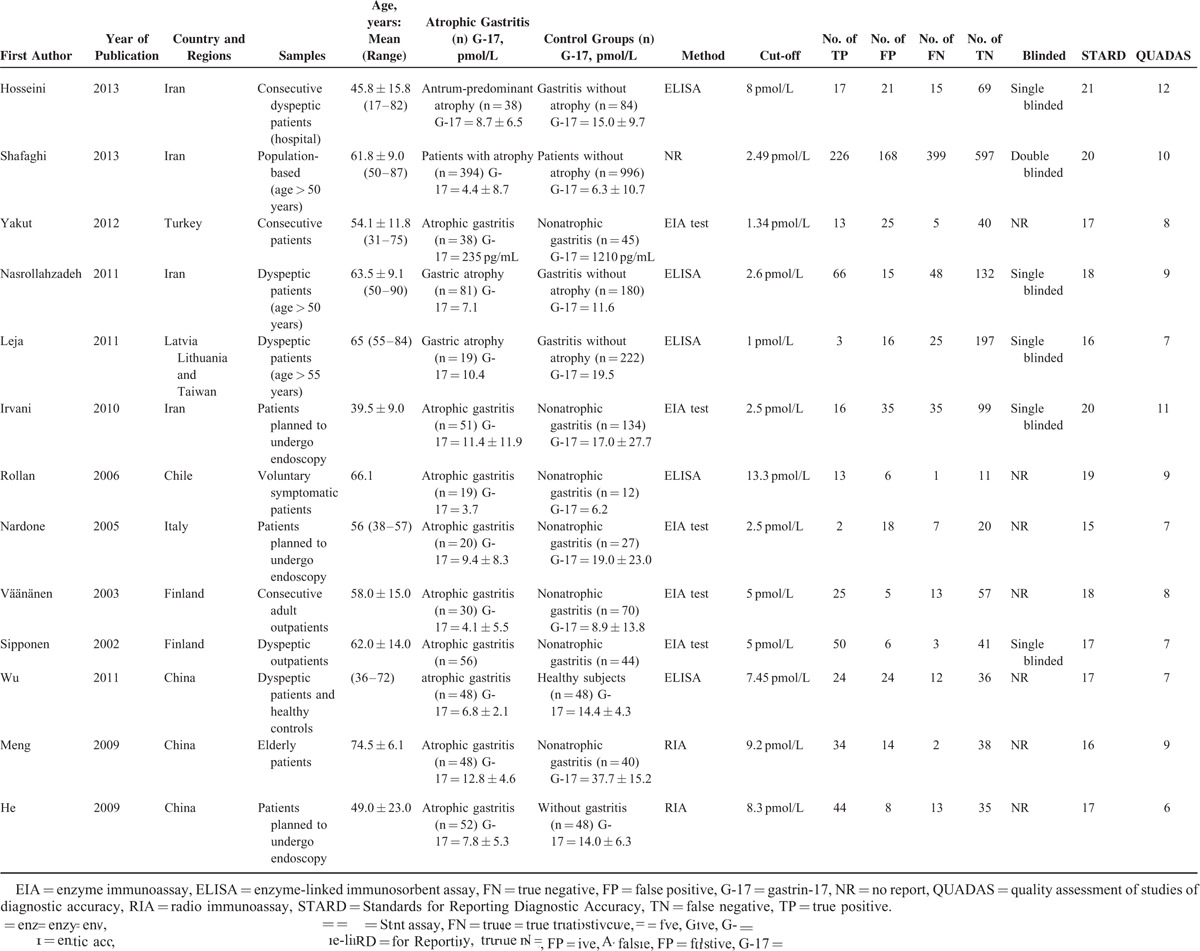
A systematic literature search yielded a total of 13 studies, including a total of 894 patients and 1950 controls, for final analysis (see in flow diagram).5,6,17,18,23–31 The characteristics of the included studies are presented (Table 1). These studies were conducted in 7 countries (Iran, Turkey, Latvia, Chile, Italy, Finland, and China) and were published between 2002 and 2013. The sample sizes ranged from 31 to 1390 participants. Eleven studies evaluated controls that had gastritis without atrophy,5,6,17,18,23–25,27,29–31 while 2 studies focused on healthy subjects. EIA26,28 was used for biomarker detection in 10 studies,5,6,17,18,23,24,27–29,31 while RIA was used in 2 studies.25,26
TABLE 1.
Baseline Characteristics of Studies Included in the Meta-Analysis
Method Quality of Included Studies
Quality assessment based on QUADAS guidelines was conducted on all 13 studies. Eight of these studies had a QUADAS score of ≥8,5,6,17,18,25,27,29,30 4 studies had a score of 7,23,24,28,31 and 1 study had a score of ≤6.26
Threshold Effect
The Spearman correction coefficient between the logit of sensitivity and that of 1-specificity of G-17 detection was computed to be 0.137 (P = 0.66).
Diagnostic Accuracy Analyses
Heterogeneity was observed among the 13 studies (Figure 1). The pooled DOR was 5.93 (95% confidence interval [CI]: 2.93–11.99), Cochran-Q was 104.70 (P = 0.00), and I2 was 88.5%. The symmetrical receiver operating characteristic curve of G-17 testing for the included studies is shown in Figure 2.
FIGURE 1.

Forest plots of DOR of G-17 detection in CAG. The solid circles and horizontal lines correspond to the study-specific OR and 95% CIs, and the size of the circle reflects the study-specific weight. The length of diamond represents the combined 95% CI and the center represents the combined OR. CAG = chronic atrophic gastritis, CI = confidence interval, DOR = diagnostic odds ratios, G-17 = gastrin-17, OR = odds ratio.
FIGURE 2.

SROC curves for G-17 detection in CAG. The solid circles represent the studies included in the meta-analysis, and the size of the circle indicates the number of samples in each study. AUC = area under the curve, CAG = chronic atrophic gastritis, G-17 = gastrin-17, SROC = summary receiver operating characteristic.
The meta-analysis shows a pooled sensitivity of G-17 for the diagnosis of CAG of 0.48 (95% CI: 0.45–0.51) and a pooled specificity of 0.79 (95% CI: 0.77–0.81) (Figures 3 and 4). In the present studies, the combined PLR is 2.54 (95% CI: 1.83–3.52) (Figure 5). In respect to NLR, the combined NLR is 0.53 (95% CI: 0.41–0.70) (Figure 6).
FIGURE 3.

Forest plots of sensitivity of G-17 detection in CAG. The solid circles and horizontal lines correspond to the study-specific OR and 95% CIs, and the size of the circle reflects the study-specific weight. The length of diamond represents the combined 95% CI and the center represents the combined OR. CAG = chronic atrophic gastritis, CI = confidence interval, G-17 = gastrin-17, OR = odds ratio.
FIGURE 4.

Forest plots of specificity of G-17 detection in CAG. The solid circles and horizontal lines correspond to the study-specific OR and 95% CIs, and the size of the circle reflects the study-specific weight. The length of diamond represents the combined 95% CI and the center represents the combined OR. CAG = chronic atrophic gastritis, CI = confidence interval, G-17 = gastrin-17, OR = odds ratio.
FIGURE 5.

Forest plots of PLR of G-17 detection in CAG. The solid circles and horizontal lines correspond to the study-specific OR and 95% CIs, and the size of the circle reflects the study-specific weight. The length of diamond represents the combined 95% CI and the centre represents the combined OR. CAG = chronic atrophic gastritis, CI = confidence interval, G-17 = gastrin-17, OR = odds ratio, PLR = positive likelihood ratio.
FIGURE 6.
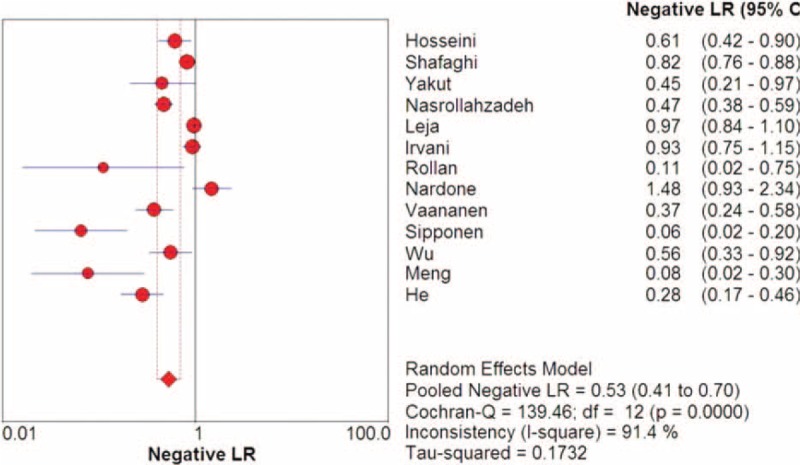
Forest plots of NLR of G-17 detection in CAG. The solid circles and horizontal lines correspond to the study-specific OR and 95% CIs, and the size of the circle reflects the study-specific weight. The length of diamond represents the combined 95% CI and the centre represents the combined OR.CAG = chronic atrophic gastritis, CI = confidence interval, G-17 = gastrin-17, NLR = negative likelihood ratio, OR = odds ratio,.
Subgroup Analysis for the 2 Types of Control Groups
In the control groups of gastritis without atrophy, the sensitivity was 0.46 (95% CI: 0.43–0.49), specificity was 0.80 (95% CI: 0.78–0.82), and area under the curve (AUC) was 0.828. The corresponding values for control groups without gastritis were 0.73 (95% CI: 0.63–0.82) for sensitivity, 0.69(95% CI: 0.59–0.78) for specificity (Table 2).
TABLE 2.
Subgroup Analysis of Serum G-17 in the Detection of CAG

Subgroup Analysis of Source Populations
SROC curve analysis of source populations from Asia produced a sensitivity of 0.45 (95% CI: 0.42–0.48), a specificity of 0.78 (95% CI: 0.76–0.80), and an AUC of 0.81. The corresponding values for the source populations from non-Asian populations were 0.66 (95% CI: 0.58–0.74) for sensitivity, 0.83 (95% CI: 079–0.86) for specificity, and 0.83 for AUC (Table 2).
Subgroup Analysis of the Assay Method
In the RIA subgroup, the sensitivity was 0.84 (95% CI: 0.75–0.91), and the specificity was 0.77 (95% CI: 0.67–0.85). The corresponding values for the EIA subgroup were 0.58 (95% CI: 0.53–0.63) for sensitivity, 0.80(95% CI: 0.78–0.83) for specificity, and 0.80 for AUC (Table 2).
As indicated by Deeks test, no significant publication bias was found among studies that evaluated diagnostic values for G-17 in early detection tests for CAG (Figure 7).
FIGURE 7.
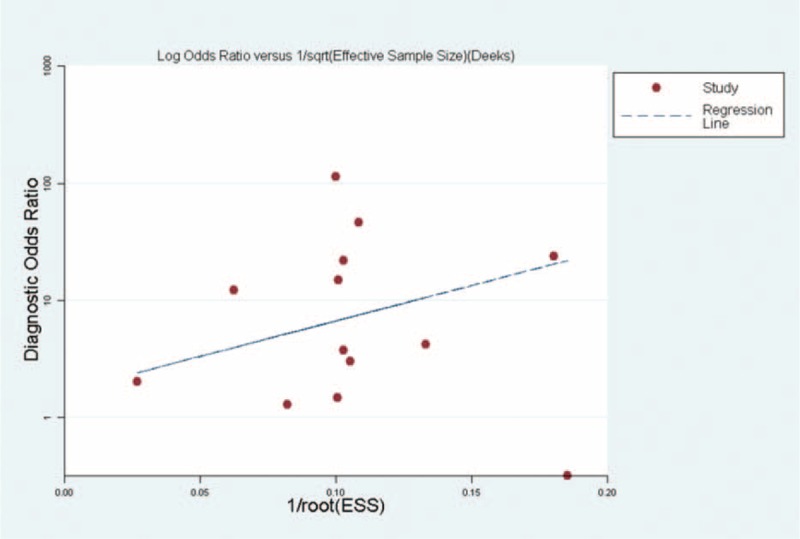
Assessment of potential publication bias in the detection of chronic atrophic gastritis (CAG). The solid circles represent individual studies. Horizontal lines correspond to the regression line.
DISCUSSION
In the present meta-analysis, we found that G-17 in serum, used as a test for the early detection of CAG, yielded an overall sensitivity of 0.48 and an overall specificity of 0.73. These values indicate that while G-17 detection may not qualify as a screening test, it may be useful for the confirmation of CAG. The DOR measure combines the strengths of sensitivity and specificity, is independent of prevalence indicators, and has the advantage of being an accurate single indicator.32 A DOR value of 10.31 indicates that G-17 may be a useful biomarker for CAG patient diagnosis. SROC was used because it is a common method for summarizing overall test performance, and AUC was calculated to evaluate the accuracy of the selected indicator. To assure a high level of accuracy, the AUC should be approximately 0.97 or greater. An AUC of 0.93 to 0.96 was determined to be very good; 0.75 to 0.92 was considered to be good, while a value less than 0.75 might be reasonable.33 The AUC of G-17 was 0.82. Furthermore, the PLR was 3.86 and the NLR was 0.46. G-17 may therefore provide diagnostic value because it has good specificity and considerable moderate DOR and AUC for CAG.
Heterogeneity is a potential problem when interpreting the results of meta-analysis.34 Heterogeneity can be caused by many factors, which one of the primary causes of heterogeneity is the threshold effect. We used the Spearman correlation coefficient to analyze the threshold effect across the 13 studies in this meta-analysis. The Spearman coefficient of correlation between G-17 and CAG was 0.14 (P = 0.66), indicating that there is no heterogeneity from threshold effects.
Reduced heterogeneity was observed in control groups that included gastritis patients without atrophy and samples from healthy subjects, which indicating that study design substantially affects diagnostic accuracy and may be a source of heterogeneity. The latest diagnostic guidelines have concluded that diagnostic testing should compare index test results of patients with an established diagnosis of the target condition with results in healthy controls or controls with another diagnosis.22 In the present meta-analysis, we noted that studies with control groups that included only healthy subjects displayed abnormally high sensitivity compared to those with control groups that included gastritis patients without atrophy. Our results may indicate that diagnostic accuracy may be over- or underestimated in G-17 detection when only healthy controls are used.35 Screening programs should therefore be careful when selecting controls for studies assessing diagnostic value.
Another important factor that can influence the diagnostic value of G-17 testing is the assay methods. In the present meta-analysis, the heterogeneity among studies of different assay methods was assessed by subgroup analysis, which indicated that studies that used RIA to measure G-17 reported higher accuracy than those that used EIA. The majority of recent studies have used one of these immunoassays to determine the level of G-17 in serum. A major concern is that techniques based on immunoreactivity may lack specificity, especially when complex biological fluids or tissue extracts are being evaluated.36 However, the 2 immunoreactivity-based methods reported in this meta-analysis have both high specificity and high accuracy. RIA studies had a higher sensitivity than EIA studies.
Subgroup analysis of study samples revealed that studies conducted using source populations from non-Asian countries (Turkey, Latvia, Chile, Italy, Finland, and Lithuania) reported higher levels of sensitivity, specificity, and AUC than studies conducted using source populations from Asian countries (Iran and China). A possible reason for this phenomenon is that few Asian countries have implemented a national screening program for GC, and with the exception of Japan and Korea, most Asian countries have no national guidelines or recommendations for GC screening.37
Another important factor that influenced the diagnostic value of G-17 detection was the quality index of the selected studies. Our methodology checklist covered several variables, including type of participants, selection criteria, selection method, and blinding method.38 This meta-analysis found that studies using blind methods had higher specificity and AUC. These findings therefore indicate that robust study design and methodology are important for the evaluation of diagnostic value tests.39
The present meta-analysis had some limitations. First, G-17 is a recently designed novel marker for CAG diagnosis that is in the early stages of development, and few studies have assessed its validity. Therefore, few studies were included in this meta-analysis. Second, many of the selected studies did not use blind methods in their validity analysis, their analysis do not distinguish between corpus atrophy and antral atrophy, G-17 levels at fasting and postprandial state has not been considered. This meta-analysis revealed that the low-quality study design was more likely to yield over-estimated diagnostic accuracy. Third, different methodologies in different studies were an important limitation in this meta-analysis. And last, although we found no publication bias with a Deeks funnel plot, potential publication bias may still exist due to the relatively small number of selected publications. For example, studies with small sample sizes showing positive results might be more likely to be published than those reporting unfavorable results.40 Therefore, future studies will be supposed to increase the effectiveness of blinding, expand the object of study quantity, more attention must be attached to the methodological design, the mechanisms associated with corpus atrophy and antral atrophy are discussed separately. More importantly, the differences in G-17 levels at fasting and postprandial state also need much attention.
CONCLUSION
In conclusion, our study suggests that G-17 has potential diagnostic value in that it displays good specificity and considerable moderate DOR and AUC for the diagnosis of CAG. Larger-scale studies are needed to more comprehensively evaluate and confirm this conclusion. In addition, further investigation into the design and evaluation of additional biomarkers with improved sensitivity and specificity is suggested.
Footnotes
Abbreviations: AUC = area under the curve, CAG = chronic atrophic gastritis, CI = confidence intervals, DOR = diagnostic odds ratios, EIA = enzyme immunoassay, FN = false negatives, FP = false positives, G-17 = gastrin-17, GC = gastric cancer, NLR = negative likelihood ratio, QUADAS = quality assessment of diagnositic accuracy studies, RIA = radio immunoassay, TN = true negatives, TP = true positives.
XW and LL contributed equally to this work.
The authors have no funding and conflicts of interest to disclose.
REFERENCES
- 1.Siegel R, Naishadham D, Jemal A. Cancer statistics, 2013. CA: Cancer J Clin 2013; 6:11–30. [DOI] [PubMed] [Google Scholar]
- 2.De Martel C, Forman D, Plummer M. Gastric cancer: epidemiology and risk factors. Gastroenterol Clin North Am 2013; 42:219–240. [DOI] [PubMed] [Google Scholar]
- 3.Weck MN, Brenner H. Prevalence of chronic atrophic gastritis in different parts of the world. Cancer Epidemiol Biomarkers Prevent 2006; 15:1083–1094. [DOI] [PubMed] [Google Scholar]
- 4.Kuipers EJ, Klinkenberg-Knol EC, Vandenbroucke-Grauls CM, et al. Role of Helicobacter pylori in the pathogenesis of atrophic gastritis. Scand J Gastroenterol Suppl 1996; 223:28–34. [PubMed] [Google Scholar]
- 5.Rollan A, Ferreccio C, Gederlini A, et al. Non-invasive diagnosis of gastric mucosal atrophy in an asymptomatic population with high prevalence of gastric cancer. World J Gastroenterol 2006; 12:71–72. [DOI] [PMC free article] [PubMed] [Google Scholar]
- 6.Hosseini M, Amoueian S, Attaranzadeh A, et al. Serum gastrin 17, pepsinogen I and pepsinogen II in atrophic gastritis patients living in North-East of Iran. J Res Med Sci 2013; 18:225. [PMC free article] [PubMed] [Google Scholar]
- 7.McNicholl AG, Forné M, Barrio J, et al. Accuracy of GastroPanel for the diagnosis of atrophic gastritis. Eur J Gastroenterol Hepatol 2014; 26:941–948. [DOI] [PMC free article] [PubMed] [Google Scholar]
- 8.Boda T, Ito M, Yoshihara M, et al. Advanced method for evaluation of gastric cancer risk by serum markers: determination of true low-risk subjects for gastric neoplasm. Helicobacter 2014; 19:1–8. [DOI] [PubMed] [Google Scholar]
- 9.Bornschein J, Selgrad M, Wex T, et al. Serological assessment of gastric mucosal atrophy in gastric cancer. BMC Gastroenterol 2012; 12:10. [DOI] [PMC free article] [PubMed] [Google Scholar]
- 10.Miki K. Gastric cancer screening using the serum pepsinogen test method. Gastric Cancer 2006; 9:245–253. [DOI] [PubMed] [Google Scholar]
- 11.Conteduca V, Sansonno D, Lauletta G, et al. H. pylori infection and gastric cancer: state of the art (Review). Int J Oncol 2013; 42:5–18. [DOI] [PubMed] [Google Scholar]
- 12.Dinis-Ribeiro M, Yamaki G, Miki K, et al. Meta-analysis on the validity of pepsinogen test for gastric carcinoma, dysplasia or chronic atrophic gastritis screening. J Med Screen 2004; 11:141–147. [DOI] [PubMed] [Google Scholar]
- 13.Kikuchi R, Abe Y, Iijima K, et al. Low serum levels of pepsinogen and gastrin 17 are predictive of extensive gastric atrophy with high-risk of early gastric cancer. Tohoku J Exp Med 2011; 223:35–44. [DOI] [PubMed] [Google Scholar]
- 14.Germaná B, Mario F, Cavallaro LG, et al. Clinical usefulness of serum pepsinogens I and II, gastrin-17 and anti-Helicobacter pylori antibodies in the management of dyspeptic patients in primary care. Dig Liver Dis 2005; 37:501–508. [DOI] [PubMed] [Google Scholar]
- 15.Peitz U, Wex T, Vieth M, et al. Correlation of serum pepsinogens and gastrin-17 with atrophic gastritis in gastroesophageal reflux patients: a matched-pairs study. J Gastroenterol Hepatol 2011; 26:82–89. [DOI] [PubMed] [Google Scholar]
- 16.Leja M, Kupcinskas L, Funka K, et al. The validity of a biomarker method for indirect detection of gastric mucosal atrophy versus standard histopathology. Digest Dis Sci 2009; 54:2377–2384. [DOI] [PubMed] [Google Scholar]
- 17.Väänänen H, Vauhkonen M, Helske T, et al. Non-endoscopic diagnosis of atrophic gastritis with a blood test. Correlation between gastric histology and serum levels of gastrin-17 and pepsinogen I: a multicentre study. Eur J Gastroenterol Hepatol 2003; 15:885–891. [DOI] [PubMed] [Google Scholar]
- 18.Nasrollahzadeh D, Aghcheli K, Sotoudeh M, et al. Accuracy and cut-off values of pepsinogens I, II and gastrin 17 for diagnosis of gastric fundic atrophy: influence of gastritis. PloS One 2011; 6:e26957. [DOI] [PMC free article] [PubMed] [Google Scholar]
- 19.Bossuyt PM, Reitsma JB, Bruns DE, et al. Towards complete and accurate reporting of studies of diagnostic accuracy. BMJ 2003; 326:41–44. [DOI] [PMC free article] [PubMed] [Google Scholar]
- 20.Whiting P, Rutjes AW, Reitsma JB, et al. Sources of variation and bias in studies of diagnostic accuracy: a systematic review. Ann Intern Med 2004; 140:189–202. [DOI] [PubMed] [Google Scholar]
- 21.Deville WL, Buntinx F, Bouter LM, et al. Conducting systematic reviews of diagnostic studies: didactic guidelines. BMC Med Res Methodol 2002; 2:9–17. [DOI] [PMC free article] [PubMed] [Google Scholar]
- 22.Lijmer JG, Mol BW, Heisterkamp S, et al. Empirical evidence of design-related bias in studies of diagnostic tests. JAMA 1999; 282:1061–6. [DOI] [PubMed] [Google Scholar]
- 23.Sipponen P, Ranta P, Helske T, et al. Atrophic gastritis serum levels of amidated gastrin-17 and pepsinogen i in atrophic gastritis: an observational case-control study. Scand J Gastroenterol 2002; 37:785–791. [PubMed] [Google Scholar]
- 24.Nardone G, Rocco A, Staibano S, et al. Diagnostic accuracy of the serum profile of gastric mucosa in relation to histological and morphometric diagnosis of atrophy. Aliment Pharmacol Ther 2005; 22:1139–1146. [DOI] [PubMed] [Google Scholar]
- 25.Meng YX, Yu AL, Chen L, et al. The analysis of gastrin, T-cells and Helicobacter pylori in screening chronic atrophic gastritis in elderly patients. ACTA Universitat Med Nanjing (Nat Sci) 2009; 5:732–735. [Google Scholar]
- 26.He YS, Li N, Liu SD. Referenced value of serum pepsinogen and gastrin-17 in screening chronic atrophic gastritis. Mode Digest Interven 2009; 1:17–20. [Google Scholar]
- 27.Irvani S, Hashemi MR, Moghadam KG, et al. Accuracy of serum pepsinogens I and II, gastrin-17 and anti-helicobacter pylori antibodies in histological diagnoses of atrophic gastritis. Miner Gastroenterol Dietol 2010; 56:13–17. [PubMed] [Google Scholar]
- 28.Wu JM, Zhang Li. The diagnosis value of serum pepsinogen, gastrin-17 and IgG anti-Helicobacter pylori antibody in patients with atrophic gastritis. Lab Med 2011; 6:375–378. [Google Scholar]
- 29.Yakut M, Örmeci N, Erdal H, et al. The association between precancerous gastric lesions and serum pepsinogens, serum gastrin, vascular endothelial growth factor, serum interleukin-1 Beta, serum toll-like receptor-4 levels and Helicobacter pylori Cag A status. Clin Res Hepatol Gastroenterol 2013; 37:302–311. [DOI] [PubMed] [Google Scholar]
- 30.Shafaghi A, Mansour-Ghanaei F, Joukar F, et al. Serum gastrin and the pepsinogen I/II ratio as markers for diagnosis of premalignant gastric lesions. APJCP 2012; 14:3931–3936. [DOI] [PubMed] [Google Scholar]
- 31.Leja M, Kupcinskas L, Funka K, et al. Value of gastrin-17 in detecting antral atrophy. Adv Med Sci 2011; 56:145–150. [DOI] [PubMed] [Google Scholar]
- 32.Glas AS, Lijmer JG, Prins MH, et al. The diagnostic odds ratio: a single indicator of test performance. J Clin Epidemiol 2003; 56:1129–1135. [DOI] [PubMed] [Google Scholar]
- 33.Jones CM, Athanasiou T. Summary receiver operating characteristic curve analysis techniques in the evaluation of diagnostic tests. Ann Thorac Surg 2005; 79:16. [DOI] [PubMed] [Google Scholar]
- 34.Zeng Z, Wang J, Zhao L, et al. Potential role of microRNA-21 in the diagnosis of gastric cancer: a meta-analysis. PLOs One 2013; 9:e73278. [DOI] [PMC free article] [PubMed] [Google Scholar]
- 35.Whiting PF, Rutjes AW, Westwood ME, et al. QUADAS-2: A revised tool for the quality assessment of diagnostic accuracy studies. Ann Intern Med 2011; 155:529–537. [DOI] [PubMed] [Google Scholar]
- 36.Westcott JY, Chang S, Balazy M, et al. Analysis of 6-Keto PGF1a, 5-hete and LTC4 in rat lung: comparison of GC/MS, RIA, and EIA. Prostaglandins 1986; 32:857–873. [DOI] [PubMed] [Google Scholar]
- 37.Leung WK, Wu MS, Kakugawa Y, et al. Screening for gastric cancer in Asia: current evidence and practice. Lancet Oncol 2008; 9:279–287. [DOI] [PubMed] [Google Scholar]
- 38.Anne WS, Johannes BR, Marcello DN, et al. Evidence of bias and variation in diagnostic accuracy studies. CMAJ 2006; 4:469–476. [DOI] [PMC free article] [PubMed] [Google Scholar]
- 39.Brian HW, Muireann Q. The assessment of the quality of reporting of meta-analyses in diagnostic research: a systematic review. BMC Med Res Methodol 2011; 11:163–174. [DOI] [PMC free article] [PubMed] [Google Scholar]
- 40.Bipat S, Glas AS, Slors FJ, et al. Rectal cancer: local staging and assessment of lymph node involvement with endoluminal US, CT, and MR imaging: a meta-analysis. Radiology 2004; 232:773–783. [DOI] [PubMed] [Google Scholar]