

Abstract
When Staphylococcus aureus undergoes cytokinesis, it builds a septum generating two hemispherical daughters whose cell walls are only connected via a narrow peripheral ring. We found that resolution of this ring occurred within milliseconds (“popping”), without detectable changes in cell volume. The likelihood of popping depended on cell wall stress, and the separating cells split open asymmetrically leaving the daughters connected by a hinge. An elastostatic model of the wall indicated high circumferential stress in the peripheral ring before popping. Finally, we observed small perforations in the peripheral ring that are likely initial points of mechanical failure. Thus, the ultrafast daughter cell separation in S. aureus appears to be driven by accumulation of stress in the peripheral ring, and exhibits hallmarks of mechanical crack propagation.
Most bacteria propagate by binary fission, a process that is highly coordinated and tightly controlled to pass on genetic material equally to the two daughter cells and to regulate cell size and shape. Much of our knowledge of bacterial cell division comes from rod-shaped bacteria, which double their cell length prior to cytokinesis (1, 2); relatively less is known about cell division in bacteria with other shapes. Staphylococcus aureus, a model system for round bacteria, is a Gram-positive pathogen well recognized for its virulence and antibiotic resistance (3, 4). To divide, S. aureus builds a septum, generating two hemispherical daughter cells (5, 6). After construction, the septal wall exists as two flat, parallel plates, and the walls of the two daughter cells are connected only through a narrow peripheral ring (7) (Fig. 1A). Presumably, resolution of this peripheral wall ring leads to daughter cell separation, which is accompanied by a shape conversion of the daughter cells from hemispheres to spheres. This shape change has previously been assumed to occur through expansion of the septum to twice its original surface area, which would double the cell volume (5, 8). It remains unclear how exactly the peripheral ring is resolved to allow the daughter cells to separate, particularly given that the S. aureus cell wall is quite thick (20–30 nm) (9).
Figure 1. Daughter cell separation in S. aureus occurs within milliseconds with characteristics of mechanical crack propagation.

(A) A schematic diagram of the cell wall prior to daughter cell separation. (B) Snapshots of S. aureus strain Newman “popping” (inset) and histogram of daughter cell separation duration captured by phase contrast microscopy at 1000 frames/s (n=16). (C) Distribution of cumulative counts of popping events plotted over the 2-min oscillatory period for 200 mM osmotic shocks. Red line denotes the concentration of sorbitol in the medium, and dashed line denotes average popping counts assuming a uniform distribution (n=400). (D) 3D SIM images of fixed Newman cells labeled with fluorescent WGA (green), which marks the outer wall and followed by 0 or 10 min of growth in the absence of WGA. Cell surfaces and septa were stained with NHS-Alexa-568 (red). (E) Time-lapse epifluorescence images of Newman cells labeled with WGA (green) before (0 min) and after (3 min) popping. Corresponding phase-contrast (grey), membrane staining with FM 4-64 (red), and overlay of WGA and FM signals are also displayed. Two types of old wall geometry after popping were observed: hinged (left, ~80%) and non-hinged (right, ~20%). (F) Correlative light and scanning electron microscopy on Newman cells labeled with WGA followed by 10-min chase showing the two types of WGA labeling patterns as in (E). Scale bars: 1 μm.
Previous video microscopy-based observations of S. aureus cell division have described daughter cell separation as a dramatic “popping” event with no detectable intermediate stages (10, 11). To address the time scale and mechanism of the popping, we used phase contrast microscopy with a temporal resolution of one millisecond. At this frame rate, we occasionally observed intermediate stages of popping, while most separations occurred within one or two frames (i.e. <2 ms, or 1/106 of the cell cycle) (Fig. 1B, Movie S1). This rapid separation of the daughter cells with drastic shape change contrasts sharply with the gradual morphological changes commonly associated with cell division in other bacteria (12), suggesting that daughter cell separation in S. aureus must not be solely dependent on enzyme-mediated cell wall remodeling. Rather, the millisecond daughter cell separation suggests involvement of mechanical forces (13). One possibility is that the peripheral ring connecting the two daughter cells is under substantial mechanical stress prior to separation, such that if a random point on this ring were to fail, a crack would propagate around the periphery, thereby separating the daughter cells but leaving them connected by a hinge point roughly opposite the position of the initial point of material failure. The observed rate of daughter-cell separation (~1 μm/ms) is well within the range of crack propagation speeds for soft biological materials (14, 15).
An essential feature of mechanical crack propagation is its dependence on stress in the material (16, 17). The primary source of stress in the bacterial cell wall is turgor pressure (18). Indeed, removing turgor pressure in S. aureus by disrupting the cytoplasmic membrane resulted in an average decrease in cell volume of >20% (Fig. S1, Movie S2), indicating that the cell wall is normally under significant mechanical stress. If cell wall stress and consequent mechanical failure are contributing factors to the ultrafast cell separation, then altering turgor pressure should influence the likelihood of separation. To test this hypothesis, we exposed an unsynchronized, growing population of cells to oscillatory changes in medium osmolarity over a range of 100–500 mM in order to modulate turgor pressure and cell wall stress, and recorded the time of popping with respect to the phase of the oscillatory cycle for hundreds of individual popping events. We observed a large dose-dependent enrichment of popping events during the intervals when medium osmolarity was being lowered (downshift), which corresponds to an increase in turgor pressure and cell wall stress, and a depletion of popping events during the intervals when medium osmolarity was being raised (upshift) (Figs. 1C, S2). Thus, an externally induced increase in cell wall stress promotes popping while a decrease in wall stress delays popping, confirming the involvement of cell wall stress in determining the likelihood of popping.
A further prediction of the stress-driven crack propagation model where failure is initiated at one random point along the periphery is that after splitting, when stress has been released, the two daughter cells will remain connected at a hinge point opposite the initial site of failure. To probe the relative orientation of the two daughter cells after popping, we tracked the fate of the outer wall (Fig. 1A) relative to the septal wall after cell separation using fluorescent wheat germ agglutinin (WGA) and three-dimensional structured illumination microscopy (3D SIM). WGA binds to N-acetylglucosamine residues in the cell wall (19) and does not penetrate into the septum due to its size, and can therefore be used to selectively label the S. aureus outer wall (20). In nearly all of the daughter cell pairs observed (39/40), the two sections of the previous outer wall were still partially connected after cell separation, and in all cases (40/40) they appeared to have rotated around a hinge (Fig. 1D 10 min, Movie S3). In addition, we followed WGA-labeled live cells with epifluorescence microscopy and observed two WGA labeling patterns after popping: the hinged pattern as observed with 3D SIM (Fig. 1E left) and a non-hinged pattern (Fig. 1E right) that resembles the labeling pattern reported previously (20). By correlating epifluorescence microscopy to scanning electron microscopy (SEM), we realized that the non-hinged pattern corresponds to cells with their hinge points oriented at the top or bottom surface of the cells relative to the coverslip (Fig. 1F). Thus, daughter cell separation in S. aureus is achieved by mechanical crack propagation that initiates at some point around the peripheral ring connecting the two daughter cells and rapidly propagates circumferentially, resulting in a hinge-like rotation.
Given that popping occurs so quickly, we questioned whether cell volume and surface area change during this process. It has been suggested that cell volume doubles at the moment of cell separation as a result of the septum expanding to cover one-half of the new spherical cell (8, 21), which would require significant water influx over a very short time frame. To address this question, we tracked growth of individual S. aureus cells using FM 4-64 and estimated cell volume and surface area from the two-dimensional cell outlines by assuming a prolate cell shape (Fig. 2A). Overlaying the 2D cell outlines from different stages in the cell cycle (Fig. 2B inset) revealed that a growing S. aureus cell increases both its volume and surface area throughout the cell cycle accompanied by an overall increase in the cell aspect ratio after a small initial decrease (Fig. 2B). This small initial decrease corresponded to a phase in which the two daughter cells gradually (within minutes) became more round and more separated after popping. Following single cells and their progeny, we observed a continuous increase in cell volume for each microcolony over several generations (Fig. 2C), consistent with the continuous exponential volume increase that has been described for E. coli and other bacteria (22). With respect to this continuous growth, the volume change upon popping is negligible on average (Fig. 2D). Consistent with this, using 3D deconvolution fluorescence microscopy with a S. aureus strain expressing cytoplasmic GFP, we observed only minimal changes in cell volume and GFP intensity (Fig. S3) following cell separation. Finally, we estimated changes in cell surface area from 2D cell outlines by assuming a prolate cell shape, which revealed a modest net decrease in surface area upon popping (Figs. 2E, S4), consistent with a geometric conversion from hemi-ellipsoidal to ellipsoidal shape, given constant volume. A decrease in surface area during popping indicates that the cell wall must have been under tensile stress prior to popping, in line with the hypothesis that cell wall stress contributes to daughter cell separation.
Figure 2. Cell volume increases continuously throughout the cell cycle.

(A) Time-lapse images of S. aureus cells stained with FM 4-64 (left) and outlined by fitting with ellipses (right). (B) Average aspect ratio of S. aureus cells throughout the cell cycle (from immediately after previous popping to ready-to-pop) and overlay of the cell outlines (inset) from a typical cell at different points of the cell cycle colored from blue (early) to red (late). Error bars denote standard errors (n=27). Red bars on top indicate the time fraction into the cell cycle when septation starts (left, 0.35 ± 0.03 SEM) and completes (right, 0.77 ± 0.02 SEM), respectively (n=26). (C) Representative traces of cell volume as a function of time following a microcolony starting from a single cell; solid blue traces indicate cell volumes of individual cells before popping and the dashed black line denotes the total cell volume of all the cells present at a given time. Cell volume and surface area were estimated from the 2D cell outlines by fitting to ellipses and assuming prolate cell shapes (i.e., that each cell was rotationally symmetric around the long axis). (D, E) Distribution of relative changes in volume (D) and surface area (E) during popping, after correcting for baseline growth rate. Black solid line represents kernel density estimate of the distribution and red dashed line denotes the average (2% ± 10% SD for volume, −11% ± 6.5% SD for surface area, n=69). (F) (top) 3D SIM images and corresponding extracted data (see also Fig. S5); (bottom) fraction of old surface before (0.71 ± 0.01 SD, n=15) and after (0.73 ± 0.03 SD, n=36) popping. Cells were modeled as ellipsoids and the contribution of the old, WGA-labeled wall to the daughter cells’ total surface area was measured by fitting a plane to the old/new boundary (Fig. S5A). Scale bars: 1 μm.
We next questioned whether the septum expands to become one-half of the new daughter’s surface (8, 21) given that the total surface area decreases upon popping. To determine the relative contributions of the previous outer wall and septum to the surface of the new daughter, we used WGA pulse-chase labeling and 3D SIM as described above. We found that ~73% of the new daughter’s surface was represented by the old wall regardless of cell size (or stage in the cell cycle, Fig. S5), similar to the ratio prior to cell separation (Fig. 2F), indicating that the septum constitutes only ~1/4 of the new daughter’s surface and does not expand noticeably in surface area upon popping, contrary to the doubling of septal surface area assumed previously (8). Additionally, the finding that the previous outer wall makes up ~3/4 of the new daughter’s cell wall (as opposed to half) suggests that there must be new wall synthesis in the outer wall as well as at the septum to sustain the continuous surface expansion required for cell size homeostasis generation after generation.
Because our data suggest that accumulation of stress in the cell wall plays an important role in the ultrafast daughter cell separation, we sought to model the stress distribution in the cell wall prior to popping using a continuum elastostatic approach. Based on previous cryo-EM data (7) and constraints determined by our experimental measurements on cell volume and surface area, we built a 3D finite element model of a “ready-to-pop” S. aureus cell wall as a prolate ellipsoidal shell with two separated septal plates that are connected with a peripheral ring (Fig. S6). We assumed that the peripheral ring does not grow as much as the rest of the cell once septation begins because it is not in direct contact with the cytoplasmic membrane where new wall material is incorporated (see Supplementary Note 1, Fig. S7). After inflating the modeled cell wall with a uniform turgor pressure in both compartments, we calculated the von Mises stress (a criterion for material failure) for the entire surface. Indeed, the von Mises stress at the peripheral ring was found to be higher than elsewhere in the outer wall (Fig. 3A–B, Movie S6). The high von Mises stress in the peripheral ring was mostly due to the high circumferential stress (Fig. 3B, Supplementary Note 2, Fig. S8) resulting from differential growth of the peripheral ring compared to the rest of the cell wall. The axial stress, which results mainly from turgor pressure (Fig. S9), is actually lower in the peripheral ring than elsewhere (Fig. 3B). Modeling a series of intermediate stages throughout the growth and division cycle including the growth of the septum resulted in an increase in the overall cell aspect ratio during growth (Movie S6), similar to our experimental observations (Fig. 2B).
Figure 3. High stress in the peripheral ring prepares the cell for popping.

(A) Von Mises stress distribution in the “ready-to-pop” S. aureus cell wall (state 3 in Fig. S6) modeled as a linear elastic material (see Supplementary Materials for details of model construction). Color represents the relative magnitude of stress. The stress at the peripheral ring (red arrow), where the cell wall splits open during popping, is higher than elsewhere in the outer wall. (B) Enlarged views of a cut-through slice of the cell in (A) shows high von Mises stress at the peripheral ring (red arrow) as well as the stress distribution in the circumferential and axial directions respectively.
Finally, we examined the cell surface closely with high resolution SEM to search for potential features of mechanical failure or fracture, and we noticed structures in a subpopulation of cells that appeared to be perforation-like holes and cracks along the peripheral ring. Similar structures have been observed with atomic force microscopy on hydrated live cells (23). To determine whether the appearance of these structures was cell-cycle dependent, we correlated SEM with fluorescence microscopy on FM 4-64-stained cells. The holes and cracks were observed mostly on cells at later stages in the cell cycle with completed septa (Fig. 4A–D). Specifically, 98% (n=54) of the cells with visible holes had completed septa, while only 49% (n=108) of the cells with completed septa had holes, suggesting that the holes are formed after the septum is completed. Enrichment of WGA binding at the peripheral ring region was also observed when holes were present (Fig. S10), suggesting that these holes are true structural changes permitting access of large proteins through the wall that are excluded at earlier stages. These perforations are likely points of mechanical failure that could initiate a propagating crack. Although the axial stress necessary for circumferential crack propagation is relatively low at the peripheral ring, the presence of perforations will lead to locally high stresses at the tips of the cracks (24) that could be sufficient to drive propagation. Consistent with this hypothesis, the distribution of the perforation lengths observed by SEM featured a cutoff length such that most perforations were <40 nm in size, which may correspond to the critical length above which cracks propagate (Fig. S11A).
Figure 4. Correlative SEM reveals cell-cycle dependent early signs of mechanical fracture.
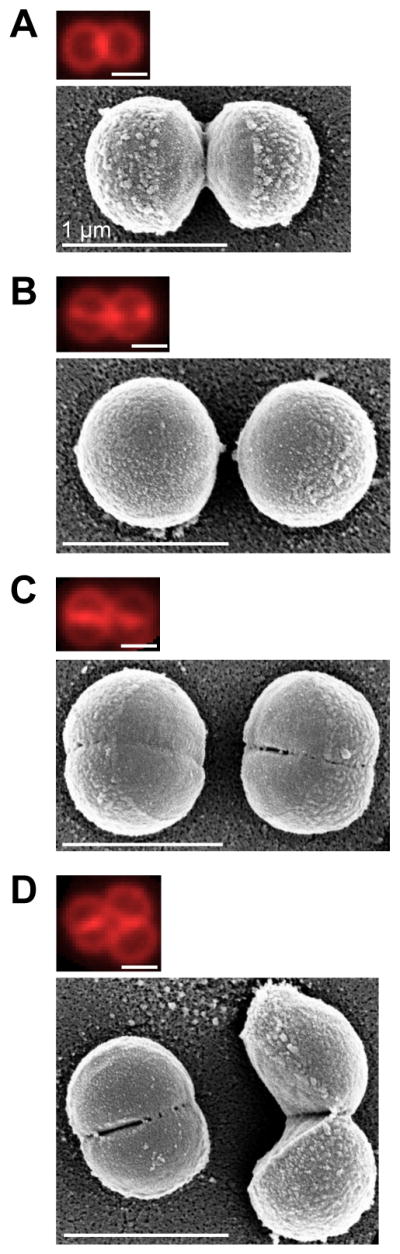
(A–D) Representative correlative fluorescence (top) and SEM images (bottom) of S. aureus Newman cells stained with FM 4-64, showing the cell surface features at different stages of the cell cycle. 98% (n=54) of the cells with visible holes (blind analysis, see Methods) had completed septa, while only 49% (n=108) of the cells with completed septa had holes.
One candidate for creating these perforations is the enzymatic activity of cell wall hydrolases including Atl. Atl is the major autolysin in S. aureus and has been shown to localize at the peripheral ring region prior to daughter cell separation (25, 26). In addition, atl null mutant cells form large clusters, indicating the involvement of this hydrolase in daughter cell separation (27). However, we found that the Δatl mutant still forms perforations at the peripheral ring and pops with a similar millisecond timescale as the wildtype (Fig. S12) but remains associated longer after popping giving rise to the characteristic clustering phenotype, where individual cells in the large clusters are nearly normal sizes and shapes. It remains possible that other cell wall hydrolases are responsible for generating the perforations we observe. However, another interesting possibility is that the perforations themselves have a mechanical origin. Given that the peripheral ring is under high circumferential stress and that the distribution of spacings between the perforations is distinctly peaked indicating some periodicity to their locations (Fig. S11B), it is plausible that perforations could form due to periodic thinning and necking of the peripheral ring under tension (Supplementary Note 3), a phenomenon of plastic instability observed for expanding ductile rings (28, 29).
To summarize, we have described a new model for the S. aureus cell cycle (Fig. S14) where cell growth happens continuously throughout the cycle and the final resolution of the peripheral ring connecting the two daughter cells happens within a few milliseconds with characteristics of mechanical crack propagation. It appears that this crack propagation is initiated by the perforations formed in the peripheral ring, which may result from a combination of mechanical stress and hydrolase activities, and is driven by axial wall stress originating from turgor pressure to propagate around the peripheral ring and complete daughter cell separation. The previous outer wall of the mother cell is still partially connected immediately after cell separation, giving rise to the hinge-like off-center attachment between daughter cells. This off-center attachment has been noted before (11, 30) and could explain the irregular cluster shape of Staphylococcus despite the fact that successive divisions occur in alternating perpendicular planes (11, 31, 32). The mechanical crack propagation-driven model for S. aureus daughter cell separation described here demonstrates how a biological system with appropriate geometrical design can use mechanical forces to achieve large-scale morphological changes.
Supplementary Material
Acknowledgments
We thank P. A. Levin for strain Newman; A. Cheung for RN6390Δspa; W. M. Nauseef for plasmid pCM29; J. Bose and K. W. Bayles for UAMS-1 and UAMS-1 Δatl; J. Mulholland and L. Joubert in CSIF at Stanford for technical assistance with 3D SIM (funded by NCRR award number 1S10OD01227601) and SEM; S. Lou and L. Harris for help with the blind SEM analysis; J. Shaevitz, D. Fisher, L. Harris and the anonymous reviewers for helpful comments on the manuscript. X. Z. was supported by a Stanford Interdisciplinary Graduate Fellowship; D. K. H. was supported by the Stanford Cell and Molecular Biology Training Grant T32-GM007276; E. R. R. was supported by a Distinguished Postdoctoral Fellowship from the Simbios NIH Center for Biomedical Computation (U54 GM072970) and a Fogarty Global Health Equity Scholars Fellowship; E. F. K. was supported by the James S. McDonnell Foundation Postdoctoral Fellowship Award in Studying Complex Systems; T. K. L. was supported by a Siebel Scholars Graduate Fellowship and an NIH Biotechnology Training Grant; K. C. H. was funded by an NIH Director’s New Innovator Award (DP2OD006466); and J. A. T. was funded by HHMI and the NIAID (R01-AI36929).
Footnotes
References (32–35)
References and notes
- 1.Wu LJ, Errington J. Nucleoid occlusion and bacterial cell division. Nat Rev Microbiol. 2012;10:8–12. doi: 10.1038/nrmicro2671. [DOI] [PubMed] [Google Scholar]
- 2.Typas A, Banzhaf M, Gross CA, Vollmer W. From the regulation of peptidoglycan synthesis to bacterial growth and morphology. Nat Rev Microbiol. 2012;10:123–136. doi: 10.1038/nrmicro2677. [DOI] [PMC free article] [PubMed] [Google Scholar]
- 3.Foster TJ. Immune evasion by staphylococci. Nat Rev Microbiol. 2005;3:948–958. doi: 10.1038/nrmicro1289. [DOI] [PubMed] [Google Scholar]
- 4.de Lencastre H, Oliveira D, Tomasz A. Antibiotic resistant Staphylococcus aureus: a paradigm of adaptive power. Curr Opin Microbiol. 2007;10:428–435. doi: 10.1016/j.mib.2007.08.003. [DOI] [PMC free article] [PubMed] [Google Scholar]
- 5.Pinho MG, Kjos M, Veening JW. How to get (a)round: mechanisms controlling growth and division of coccoid bacteria. Nat Rev Microbiol. 2013;11:601–614. doi: 10.1038/nrmicro3088. [DOI] [PubMed] [Google Scholar]
- 6.Turner RD, Vollmer W, Foster SJ. Different walls for rods and balls: the diversity of peptidoglycan. Mol Microbiol. 2014;91:862–874. doi: 10.1111/mmi.12513. [DOI] [PMC free article] [PubMed] [Google Scholar]
- 7.Matias VR, Beveridge TJ. Cryo-electron microscopy of cell division in Staphylococcus aureus reveals a mid-zone between nascent cross walls. Mol Microbiol. 2007;64:195–206. doi: 10.1111/j.1365-2958.2007.05634.x. [DOI] [PubMed] [Google Scholar]
- 8.Seligman SJ, Pincus MR. A model for the three-dimensional structure of peptidoglycan in staphylococci. J Theor Biol. 1987;124:275–292. doi: 10.1016/s0022-5193(87)80116-9. [DOI] [PubMed] [Google Scholar]
- 9.Matias VR, Beveridge TJ. Native cell wall organization shown by cryo-electron microscopy confirms the existence of a periplasmic space in Staphylococcus aureus. J Bacteriol. 2006;188:1011–1021. doi: 10.1128/JB.188.3.1011-1021.2006. [DOI] [PMC free article] [PubMed] [Google Scholar]
- 10.Previc EP. Biochemical determination of bacterial morphology and the geometry of cell division. J Theor Biol. 1970;27:471–497. doi: 10.1016/s0022-5193(70)80010-8. [DOI] [PubMed] [Google Scholar]
- 11.Tzagoloff H, Novick R. Geometry of cell division in Staphylococcus aureus. J Bacteriol. 1977;129:343–350. doi: 10.1128/jb.129.1.343-350.1977. [DOI] [PMC free article] [PubMed] [Google Scholar]
- 12.Egan AJ, Vollmer W. The physiology of bacterial cell division. Ann N Y Acad Sci. 2013;1277:8–28. doi: 10.1111/j.1749-6632.2012.06818.x. [DOI] [PubMed] [Google Scholar]
- 13.Skotheim JM, Mahadevan L. Physical limits and design principles for plant and fungal movements. Science. 2005;308:1308–1310. doi: 10.1126/science.1107976. [DOI] [PubMed] [Google Scholar]
- 14.Baumberger T, Caroli C, Martina D. Solvent control of crack dynamics in a reversible hydrogel. Nat Mater. 2006;5:552–555. doi: 10.1038/nmat1666. [DOI] [PubMed] [Google Scholar]
- 15.Baumberger T, Ronsin O. From thermally activated to viscosity controlled fracture of biopolymer hydrogels. J Chem Phys. 2009;130:061102. doi: 10.1063/1.3078267. [DOI] [PubMed] [Google Scholar]
- 16.Griffith AA. The Phenomena of Rupture and Flow in Solids. Philosophical Transactions of the Royal Society of London Series A, Containing Papers of a Mathematical or Physical Character. 1921;221:163–198. [Google Scholar]
- 17.Dill EH. Continuum Mechanics: Elasticity, Plasticity, Viscoelasticity. CRC Press; Boca Raton, FL: 2007. pp. 239–251. [Google Scholar]
- 18.Rojas E, Theriot JA, Huang KC. Response of Escherichia coli growth rate to osmotic shock. Proc Natl Acad Sci U S A. 2014;111:7807–7812. doi: 10.1073/pnas.1402591111. [DOI] [PMC free article] [PubMed] [Google Scholar]
- 19.Wagner M. Interaction of wheat-germ agglutinin with streptococci and streptococcal cell wall polymers. Immunobiology. 1979;156:57–64. [PubMed] [Google Scholar]
- 20.Pinho MG, Errington J. Dispersed mode of Staphylococcus aureus cell wall synthesis in the absence of the division machinery. Mol Microbiol. 2003;50:871–881. doi: 10.1046/j.1365-2958.2003.03719.x. [DOI] [PubMed] [Google Scholar]
- 21.Turner RD, et al. Peptidoglycan architecture can specify division planes in Staphylococcus aureus. Nat Commun. 2010;1:26. doi: 10.1038/ncomms1025. [DOI] [PubMed] [Google Scholar]
- 22.Godin M, et al. Using buoyant mass to measure the growth of single cells. Nat Methods. 2010;7:387–390. doi: 10.1038/nmeth.1452. [DOI] [PMC free article] [PubMed] [Google Scholar]
- 23.Touhami A, Jericho MH, Beveridge TJ. Atomic force microscopy of cell growth and division in Staphylococcus aureus. J Bacteriol. 2004;186:3286–3295. doi: 10.1128/JB.186.11.3286-3295.2004. [DOI] [PMC free article] [PubMed] [Google Scholar]
- 24.Schijve J. Fatigue of Structures and Materials. 2. Springer; 2009. [Google Scholar]
- 25.Yamada S, et al. An autolysin ring associated with cell separation of Staphylococcus aureus. J Bacteriol. 1996;178:1565–1571. doi: 10.1128/jb.178.6.1565-1571.1996. [DOI] [PMC free article] [PubMed] [Google Scholar]
- 26.Baba T, Schneewind O. Targeting of muralytic enzymes to the cell division site of Gram-positive bacteria: repeat domains direct autolysin to the equatorial surface ring of Staphylococcus aureus. EMBO J. 1998;17:4639–4646. doi: 10.1093/emboj/17.16.4639. [DOI] [PMC free article] [PubMed] [Google Scholar]
- 27.Sugai M, et al. Identification of endo-beta-N-acetylglucosaminidase and N-acetylmuramyl-L-alanine amidase as cluster-dispersing enzymes in Staphylococcus aureus. J Bacteriol. 1995;177:1491–1496. doi: 10.1128/jb.177.6.1491-1496.1995. [DOI] [PMC free article] [PubMed] [Google Scholar]
- 28.Walsh JM. Plastic Instability and Particulation in Stretching Metal Jets. J Appl Phys. 1984;56:1997–2006. [Google Scholar]
- 29.Zhou F, Molinari JF, Ramesh KT. An elastic-visco-plastic analysis of ductile expanding ring. International Journal of Impact Engineering. 2006;33:880–891. [Google Scholar]
- 30.Amako K, Umeda A. Scanning electron microscopy of Staphylococcus. J Ultrastruct Res. 1977;58:34–40. doi: 10.1016/s0022-5320(77)80005-1. [DOI] [PubMed] [Google Scholar]
- 31.Koyama T, Yamada M, Matsuhashi M. Formation of regular packets of Staphylococcus aureus cells. J Bacteriol. 1977;129:1518–1523. doi: 10.1128/jb.129.3.1518-1523.1977. [DOI] [PMC free article] [PubMed] [Google Scholar]
- 32.Wecke J, Lahav M, Ginsburg I, Kwa E, Giesbrecht P. Inhibition of wall autolysis of staphylococci by sodium polyanethole sulfonate “liquoid”. Arch Microbiol. 1986;144:110–115. doi: 10.1007/BF00414719. [DOI] [PubMed] [Google Scholar]
Associated Data
This section collects any data citations, data availability statements, or supplementary materials included in this article.