Abstract
It is generally accepted that viral particles in source water are likely to be found as aggregates attached to other particles. For this reason, it is important to investigate the disinfection efficacy of chlorine on aggregated viruses. A method to produce adenovirus particle aggregation was developed for this study. Negative stain electron microscopy was used to measure aggregation before and after addition of virus particles to surface water at different pH and specific conductance levels. The impact of aggregation on the efficacy of chlorine disinfection was also examined. Disinfection experiments with human adenovirus 2 (HAdV2) in source water were conducted using 0.2 mg/L free chlorine at 5 °C. Aggregation of HAdV2 in source water (≥3 aggregated particles) remained higher at higher specific conductance and pH levels. However, aggregation was highly variable, with the percentage of particles present in aggregates ranging from 43 to 71 %. Upon addition into source water, the aggregation percentage dropped dramatically. On average, chlorination CT values (chlorine concentration in mg/L × time in min) for 3-log10 inactivation of aggregated HAdV2 were up to three times higher than those for dispersed HAdV2, indicating that aggregation reduced the disinfection rate. This information can be used by water utilities and regulators to guide decision making regarding disinfection of viruses in water.
Keywords: Adenovirus, Aggregation, Water, Chlorine disinfection
Introduction
Disinfection is critical for the reduction of infectious viruses in source water because viruses are less efficiently removed by coagulation and filtration during drinking water treatment. It is generally accepted that viral particles in source water are less likely to be present in a dispersed state than as aggregates that are attached to other particles or host cell debris (Templeton et al. 2008; Moshe and Gorovits 2012). For this reason, it is important to investigate the disinfection efficacy of chlorine on aggregated viruses, as some researchers have found that CT values (disinfectant concentration in mg/L × time in min) increased for cell-associated viruses compared to dispersed viruses under the same conditions (Thurston-Enriquez et al. 2003; Sobsey et al. 1991).
Aggregation of viral particles has been studied for decades, but the phenomenon of aggregation is complex and dependent on factors such as pH, ionic strength and composition, viral charge, capsid structure, viral concentration, and temperature. For many viruses, aggregation is favorable only if the pH is near or below their isoelectric point (Floyd and Sharp 1977, 1979; Galdiero 1979; Langlet et al. 2008; Wong et al. 2012; Mattle and Kohn 2012). When pH is near the isoelectric point of a particular virus, aggregation can also be favored by lowering the ionic strength of the solution, but certain ions are more effective than others, and there is no single approach that is effective for all virus types (Galdiero 1979; Wong et al. 2012; Floyd and Sharp 1977).
Because chlorine CT values are pH dependent, it is important to conduct chlorine disinfection experiments at or near the natural pH of the water. Therefore, inducing aggregation by lowering the pH of the viral suspension near or below the isoelectric point is counterproductive to conducting chlorine disinfection experiments. The pH required to keep the viruses aggregated would be too low to generate useful data for real-world water samples. Alternatively, raising the pH to the level of source waters would likely cause the viruses to disaggregate. Previous research indicates that the concentrations of ions in natural waters are not sufficient to induce viral aggregation (Wong et al. 2012; Floyd and Sharp 1978; Gutierrez et al. 2010). However, inducing aggregation by altering the ionic composition of source waters may be only partially effective, since this method has only been demonstrated to be effective at low pH levels.
Because the pH and ionic composition of most source waters is not extreme enough to induce viral aggregation, cell-associated virus preparations represent a reliable approach to creating aggregated viruses, as the viruses are attached to and aggregated around cell debris (Sobsey et al. 1991; Thurston-Enriquez et al. 2003). However, cell-associated virus preparations can be problematic for chlorine disinfection experiments. The high concentration of organic matter presents a high chlorine demand, and can quickly reduce the free chlorine residual available for disinfection. If the chlorine decay is not monitored throughout the disinfection experiment, the chlorine efficacy will be underestimated.
The first objective of this study was to produce an aggregated human adenovirus 2 (HAdV2) viral suspension with low chlorine demand in order to investigate the aggregation behavior of this model waterborne virus in surface water. HadV2 was chosen because its susceptibility to chlorine is well understood (T.L. Cromeans et al. 2010; Kahler et al. 2010) and is often found in water sources (Van Heerden et al. 2003; Albinana-Gimenez et al. 2009). HAdV2 aggregation was quantified using negative stain electron microscopy (NSEM). Percent aggregation of a portion of the viral suspension was evaluated before and after introduction into source water at various pH and specific conductance levels (a measure of ionic strength) in order to determine the impact of these water quality parameters on aggregation. The second objective of this study was to carry out chlorine disinfection experiments to compare CT values for disinfection of aggregated and dispersed HAdV2 in source water.
Materials and Methods
Test Water and Glassware Preparation
Chlorine demand-free (CDF) reagent grade water was prepared according to Standard Method 4500-Cl C (APHA 2005). Partially treated surface water was obtained from Washington Aqueduct in Washington, D.C. after being subjected to pre-sedimentation, coagulation, flocculation, sedimentation, and filtration. Source water was collected from the water treatment plant just prior to chemical disinfection. Specific conductance, which is a measure of ionic strength, was brought to 30, 300, or 1000 μS by adding deionized water or 10X PBS. The pH was adjusted to 7 or 8 with 1 M HCl or 1 M NaOH. These pH and specific conductance values are in the normal range for surface and ground water.
Demand-free glassware was prepared by soaking in ≥5 mg/L free chlorine overnight. The glassware was rinsed 5 times with CDF water, covered with clean foil, and baked at 200 °C for 2 h. All glassware and water were pre-chilled at 5 °C before use.
Virus Preparation and Infectivity Assays
HAdV2 (strain 6) was propagated in A549 cells. A549 cells were maintained in Eagle’s Minimum Essential Medium containing 10 % fetal bovine serum, 100 U/mL penicillin, 100 μg/mL streptomycin, 2 mM glutamine, 10 mM HEPES, and 0.1 mM MEM non-essential amino acids. Cell-associated virus (CAV) was prepared for aggregation testing and disinfection experiments by infecting A549 cell monolayers at ~1.0 multiplicity of infection (T.L. Cromeans et al. 2010). Flasks were incubated until the monolayer showed ≥90 % cytopathic effect with minimal cell lysis. The culture medium was removed and 10 mL CDF deionized water was added to the flask. The CAV preparation was frozen at −70 °C. The day before use, the CAV was thawed and precipitated at 4 °C overnight by the addition of 8 % polyethylene glycol 8000 and 0.3 M NaCl. The solution was centrifuged at 10,000 × g and the pellet was resuspended in 10 mL CDF water. This resulted in a minimally processed aggregated HAdV2 preparation with low chlorine demand. For disinfection experiments, the resuspended pellet was split and half was further purified by extracting with an equal volume of chloroform by shaking for 2 min. After centrifugation at 10,000 × g, the upper aqueous layer was collected. This purified CAV (pCAV) was used as the dispersed virus inoculum for disinfection experiments. Viral titers were determined by plaque assay as previously described (T.L. Cromeans et al. 2010). Briefly, confluent A549 cell monolayers were inoculated with tenfold dilutions of virus or experimental samples. Following a 5-day incubation, HAdV2 plaques were visualized with a 2 % neutral red agar overlay.
Aggregation in Source Water
The extent of HAdV2 aggregation was evaluated before and after introduction into source water. Aggregated CAV preparations were inoculated into the water, which did not have any disinfectant residual, and no stirring took place. The water was maintained at 5 °C until examination by negative stain electron microscopy (NSEM).
Disinfection Experiments
Disinfection experiments were conducted in duplicate at 5 °C in a recirculating water bath inside a biological safety cabinet. A multi-place stir plate placed under the water bath allowed for continual mixing during an experiment. Experiments with dispersed and aggregated virus preparations were conducted on the same day in order to directly compare disinfection rates between the two conditions.
Disinfection experiments were performed at a target level of 0.15–0.25 mg/L free chlorine. A free chlorine stock solution was prepared by diluting 5.65–6 % sodium hypochlorite in CDF water and added to the test water before each experiment. The starting concentration of the water was adjusted above the target concentration to offset the initial chlorine demand of the inoculum. Free chlorine was measured by the DPD method using a Hach DR/850 colorimeter (Hach, Loveland, CO).
For each experimental condition, four 50-mL Erlenmeyer flasks were used, each containing 40 mL source water. Two flasks served as the experimental replicates, and one flask each was used to monitor disinfectant residual and viral titer throughout the experiment. At time zero, <1 mL of the aggregated CAV or pCAV at 108–109 PFU/mL was inoculated into each flask. At the designated time points, a 5-mL sample was removed and the disinfectant residual was quenched with 50 mg/L sodium thiosulfate.
Free chlorine residual was measured immediately before an experiment, immediately after virus inoculation, at the midpoint, and at the end of an experiment, with additional measurements as time allowed. These values were used to determine the disinfectant decay rate, k’, for each experiment. Prior to virus inoculation into the virus control flask, 50 mg/L sodium thiosulfate was added to quench the disinfectant residual. This flask was sampled immediately after virus inoculation and at the end of the experiment to ensure that virus infectivity was stable in the source water. A portion of the control sample and the final time point of one experimental replicate were analyzed by NSEM. All samples were held in PBS containing 1 % serum at 4 °C until assay. Storage of the samples in PBS/serum effectively dispersed the viral aggregates, which allowed for the quantification assay to assess the viability of each viral particle in the aggregate instead of the aggregate as a whole. This also allowed for direct comparison between viral titers for the dispersed and aggregated disinfection experiments.
Negative Stain Electron Microscopy (NSEM)
Two microliters of virus suspension were absorbed onto 1 % alcian blue pretreated formvar–carbon-coated grids overnight before staining. Grids with adsorbed virus were negatively stained with 5 % ammonium molybdate–1 % trehalose and viewed with a Tecnai BioTwin transmission electron microscope (FEI Company Hillsboro, OR). Images were digitally captured with a 2 K × 2 K CCD camera (AMT INC, Danvers, MA). Counts were made of particles adsorbed within two to four grid squares near the center mark of each grid, similar to the procedure described in Cromeans et al. 2008 (T. L. Cromeans et al. 2008). A viral aggregate was defined as ≥3 adjoining viral particles. To evaluate the aggregation state of particles in source water, five to eight images were analyzed for each condition. To evaluate the aggregation state of particles before and after disinfection experiments, five to ten images were counted for each sample.
Kinetic Modeling and CT Calculations
Viral inactivation was determined by calculating the survival ratio (N/N0; infectious viruses at time t divided by infectious viruses at time zero) for each experimental sample. The efficiency factor Hom (EFH) model was used to calculate predicted survival ratios based on experimental conditions, including disinfectant decay over time using a first-order kinetic equation (Haas and Joffe 1994). Samples were included in the EFH modeling and CT calculations only if the plaque assay counts averaged ≥ 10 PFU/plate. Inactivation curves were created using Microsoft Excel to compare observed versus predicted inactivation values. CT values were calculated for 2-, 3-, and 4-log10 inactivation for each virus and condition through application of the EFH model.
Results
Aggregation in Source Water
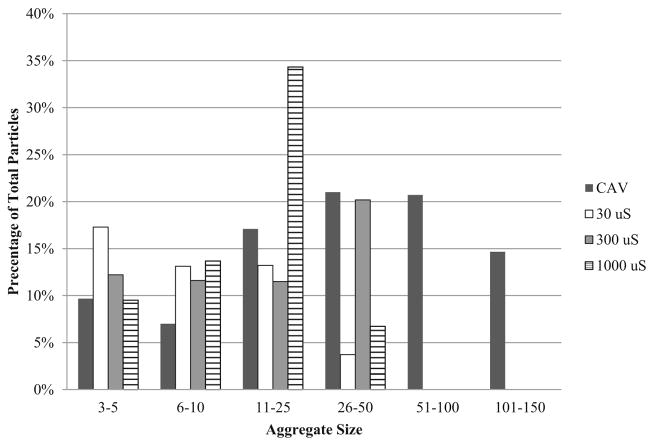
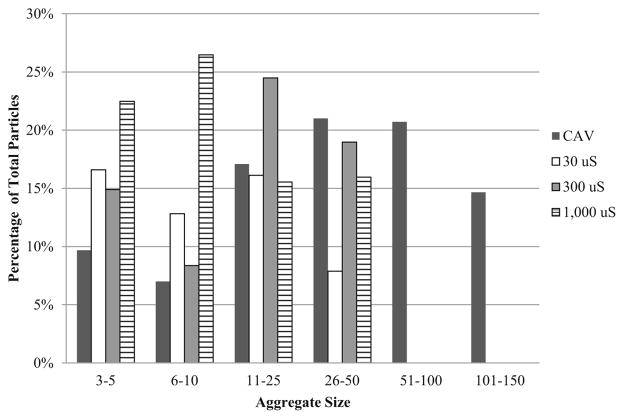
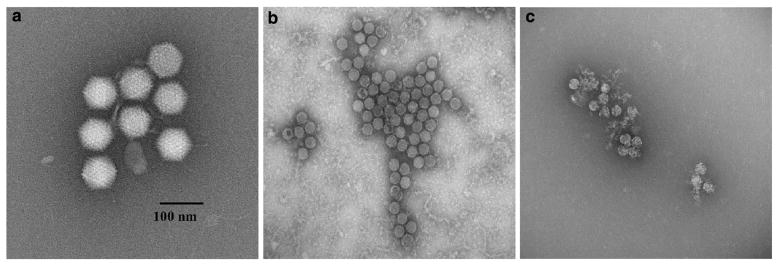
The water quality characteristics of the source water are presented in Table 1. The extent of HAdV2 aggregation was evaluated before and after introduction into pH 7 and 8 source water at specific conductance levels of 30, 300, and 1000 μS/cm. The results of duplicate trials are shown in Table 2. NSEM analysis showed that the CAV preparations were 89 and 90 % aggregated, but dilution into the source water caused dispersion of a majority of the aggregates and percent aggregation dropped to as low as 45 %. Percent aggregation was higher at pH 8 than pH 7 and was greater with increased ionic strength. Although total percent aggregation decreased upon dilution into water, there was still a greater percentage of larger aggregates (>5 particles) than small aggregates (3–5 particles). Aggregate size distributions are shown in Figs. 1 and 2, which illustrates that the CAV preparations comprised primarily large aggregates; however, when diluted into source water the aggregates skewed toward the smaller sizes. Figure 3(a–c) shows NSEM images of representative HAdV2 virions, aggregate size in a CAV preparation, and virion morphology after chlorine disinfection.
Table 1.
Water quality characteristics of the source water
| Parameter | Measurement |
|---|---|
| pH | 7.1 |
| Turbidity (NTU) | 0.17 |
| Specific conductance (μS/cm at 25 °C) | 370 |
| Total hardness (mg/L as CaCO3) | 140 |
| Alkalinity (mg/L as CaCO3) | 82 |
| Total organic carbon (TOC, mg/L as C) | 1.9 |
Table 2.
Aggregation of HAdV2 CAVs in source water at 5 °C
| Number of viral particles counted | pH 7
|
pH 8
|
||||
|---|---|---|---|---|---|---|
| 30 μS | 300 μS | 1000 μS | 30 μS | 300 μS | 1000 μS | |
| Total particles | 1340 | 1415 | 689 | 1091 | 713 | 657 |
| Singlet and doublet particles (%) | 727 (54) | 776 (55) | 268 (39) | 514 (47) | 254 (36) | 163 (25) |
| Aggregated particles (%) | 613 (46) | 639 (45) | 421 (61) | 577 (53) | 459 (64) | 494 (75) |
Fig. 1.
Size distribution of undiluted HAdV2 cell-associated virus preparation (CAV) and CAV diluted at pH 7 with varying ionic concentration as a proportion of the total number of particles counted
Fig. 2.
Size distribution of undiluted HAdV2 cell-associated virus preparation (CAV) and CAV diluted at pH 8 with varying ionic concentration as a proportion of the total number of particles counted
Fig. 3.
NSEM images of representative HAdV2 virions (a), aggregate size in a CAV preparation (b), and virion morphology after chlorine disinfection (c)
Chlorine Disinfection
Percent aggregation of HAdV2 during chlorine disinfection experiments is presented in Table 3. The percent aggregation of the CAV preparation for each experiment was independent of pH and ionic strength of the source water, as it was measured before introduction into the water, but because a separate CAV preparation was used for each experiment, these data are included in the table. The percent aggregation dropped substantially in the source water during disinfection experiments, both in the experimental flasks containing free chlorine and the control flasks that were stirred during experiments but did not contain free chlorine. The NSEM image in Fig. 3c shows the capsid damage to chlorine-exposed HAdV2 virions at the end of an experiment.
Table 3.
Aggregation of HAdV2 for disinfection experiments
| 30 μS
|
300 μS
|
1000 μS
|
||||
|---|---|---|---|---|---|---|
| pH 7 | pH 8 | pH 7 | pH 8 | pH 7 | pH 8 | |
| Number of particles counted | ||||||
| CAV before addition in water | 3049 | 4250 | 3144 | 3619 | 4067 | 7207 |
| Post-chlorine disinfection flask | 100 | 115 | 52 | 182 | 353 | 71 |
| Control flask | 265 | 156 | 145 | 372 | 346 | 287 |
| Percent aggregation | ||||||
| CAV before addition in water | 66 % | 56 % | 59 % | 65 % | 62 % | 85 % |
| Post-chlorine disinfection flask | 3 % | 13 % | 23 % | 18 % | 24 % | 44 % |
| Control flask | 9 % | 29 % | 11 % | 20 % | 44 % | 32 % |
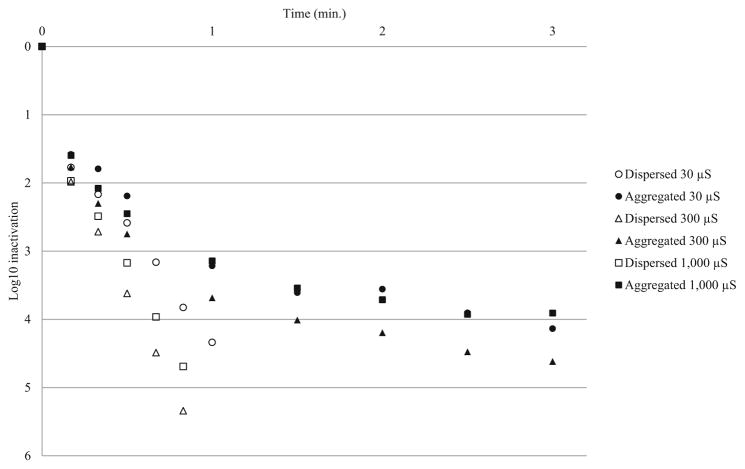
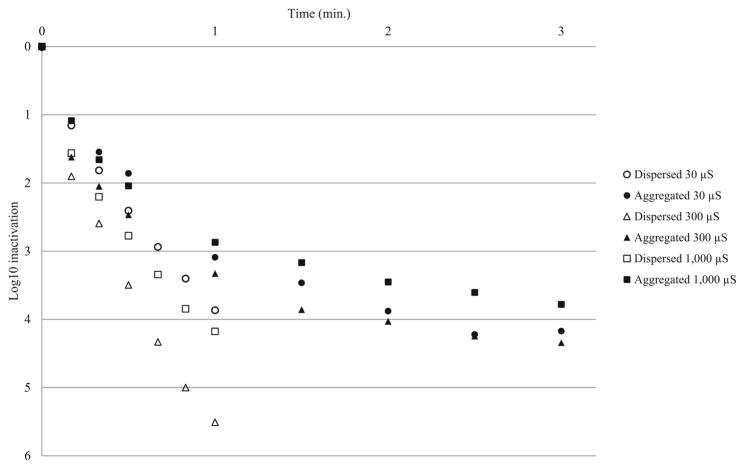
CT values for disinfection experiments are presented in Table 4. CT values for 3-log10 inactivation of aggregated HAdV2 were 1.5–2.7 times higher than those for dispersed HAdV2. Four-log CT values were 2–4.9 times higher for aggregated HAdV2, indicating that aggregation reduced the disinfection efficacy of free chlorine. There were no substantial differences in CT values between pH 7 and pH 8 source water, and trends were not observed for ionic strength. Additionally, there were no indications that higher percent aggregation resulted in larger CT value differences between aggregated and dispersed virus. Inactivation curves for pH 7 and 8 experiments are presented in Figs. 4 and 5, respectively. Because of the more pronounced second-order inactivation kinetics for aggregated virus, the difference in inactivation rates between aggregated and dispersed virus became more pronounced over time.
Table 4.
CT values for free chlorine disinfection of HAdV2 at pH 7 and 8
| Ionic strength (μS) | pH | Dispersed (D) or Aggregated (A) | 2-log10 CT | 3-log10 CT | 4-log10 CT |
|---|---|---|---|---|---|
| 30 | 7 | D | 0.07 | 0.15 | 0.24 |
| A | 0.09 | 0.26 | 0.64 | ||
| 8 | D | 0.10 | 0.18 | 0.27 | |
| A | 0.13 | 0.27 | 0.54 | ||
| 300 | 7 | D | 0.06 | 0.10 | 0.16 |
| A | 0.06 | 0.17 | 0.40 | ||
| 8 | D | 0.06 | 0.11 | 0.17 | |
| A | 0.09 | 0.22 | 0.52 | ||
| 1000 | 7 | D | 0.05 | 0.09 | 0.15 |
| A | 0.09 | 0.24 | 0.73 | ||
| 8 | D | 0.08 | 0.15 | 0.24 | |
| A | 0.13 | 0.29 | ND |
Fig. 4.
Chlorine disinfection of aggregated and dispersed HAdV2 at pH 7
Fig. 5.
Chlorine disinfection of aggregated and dispersed HAdV2 at pH 8
Discussion
The results of this study show that percent aggregation of HAdV2 remained higher at pH 8 than pH 7, although the sample size was small and the difference was not substantial. Recent studies have shown that HAdV2 aggregates more readily at or near its isoelectric point of 3.5–4 (Galdiero 1979; Wong et al. 2012). This is thought to be due to the repulsive force between negatively charged viruses lessening as their charge becomes less negative and the ionic double layer shrinking as pH decreases toward their isolectric point (Langlet et al. 2008; Wong et al. 2012). Our results seem to contradict this trend of increased aggregation at low pH levels, but comparison between this study and previous research is difficult. The aggregation for this study was facilitated by the physical attachment of virions to cell debris and not a pH-dependent mechanism. Additionally, it is unclear whether this trend should hold true for neutral pH levels, as it is considerably more difficult to induce and maintain aggregation at these levels.
Our data indicate that the percent aggregation of HAdV2 remained higher with increasing the ionic strength of the source water. Multiple researchers have found that decreased ionic strength facilitated aggregation of non-enveloped viruses (Floyd and Sharp 1977; Galdiero 1979; Wong et al. 2012), but this only occurred at pH levels at or near the isoelectric point of the viruses. Recent research suggests that this trend may not hold true at higher pH levels. Wong et al. found that at pH 4, HAdV2 aggregates were larger at 1 mM NaCl than 100 mM NaCl. However, at pH 7 and 10, aggregates were larger at the higher ionic strength (Wong et al. 2012).
The 3- and 4-log10 CT values for aggregated HAdV2 were 1.5–2.7 times higher and 2–4.9 times higher, respectively, than for dispersed HAdV2, demonstrating that aggregation resulted in reduced disinfection efficacy of free chlorine. This is similar to what has been reported for poliovirus (Thurston-Enriquez et al. 2003), but much lower than the ratios reported in previous studies of Hepatitis A virus (HAV) and feline calicivirus (FCV). Sobsey, Fuji, and Hall (Sobsey et al. 1991) reported a 14-fold difference between cell-associated virus and dispersed HAV at pH 8. In a separate study, the 2-log10 CT value at pH 7 for cell-associated FCV was found to be 31 times higher than for the dispersed virus (Thurston-Enriquez et al. 2003). Several factors make it difficult to directly compare differences between aggregated and dispersed CT values between these studies, including different viruses studied, differences in CAV preparation methods, differences in disinfectant decay in each study, and uncertainty regarding the extent of virus aggregation achieved in each study.
There were several limitations associated with this study. While this study demonstrated that viral aggregation resulted in reduced disinfection efficacy by chlorine, relatively few conditions were evaluated and naturally occurring aggregates in source water may vary from those produced for this study. For this reason, the CT values reported here may not be applicable to all viral aggregates and various water types. Additionally, NSEM has two major limitations: analysis of a small sample volume and image capture in two dimensions instead of three. Because NSEM images were captured on a two-dimensional scale, the actual size of aggregates may have be underestimated. Despite this drawback, electron microscopy remains the gold standard for morphologic qualitative and quantitative characterization of virus particles (Monroe and Brandt 1970; Sharp 1949, 1965). USEPA recommends chlorination CT values of 4, 6, and 8 for 2-, 3-, and 4-log10 reduction, respectively, of viruses during drinking water treatment, and this includes a factor of safety of three (USEPA 1991). Based on results from this study, these recommendations appear to be sufficient for HAdV2, even when aggregated, but may not be sufficient for all viruses. Previous research demonstrated that Coxsackievirus B5 (CVB5) required CT values of 8 and 10 for 3- and 4-log inactivation in reagent grade water (T.L. Cromeans et al. 2010). Given the aggregation effects on chlorine disinfection reported in this study, the CT values for 3- and 4-log inactivation of aggregated CVB5 could be upwards of 16 and 30, which would exceed the USEPA recommendations. As water utilities implement disinfection strategies for viruses, these types of data can be used to inform the decisions regarding which CT values to target. The results of this study can be used by water utilities and regulators to guide decision making regarding disinfection of aggregated viruses in source water.
Acknowledgments
The authors thank Bonnie Mull (CDC) for assistance with disinfection experiments, and Washington Aqueduct staff for providing source water. Funding for this project was provided in part by the Water Research Foundation (Project #3134, Contaminant Candidate List Viruses: Evaluation of Disinfection Efficacy). The use of trade names and names of commercial sources is for identification only and does not imply endorsement by the Centers for Disease Control and Prevention or the U.S. Department of Health and Human Services. The findings and conclusions in this presentation are those of the authors and do not necessarily represent those of the Centers for Disease Control and Prevention.
References
- Albinana-Gimenez N, Miagostovich MP, Calgua B, Huguet JM, Matia L, Girones R. Analysis of adenoviruses and polyomaviruses quantified by qPCR as indicators of water quality in source and drinking water treatment plants. Water Research. 2009;43:2011–2019. doi: 10.1016/j.watres.2009.01.025. [DOI] [PubMed] [Google Scholar]
- APHA. Standard methods for the examination of water and wastewater. 21. Washington, DC: American Public Health Association; 2005. [Google Scholar]
- Cromeans TL, Kahler AM, Hill VR. Inactivation of adenoviruses, enteroviruses, and murine norovirus in water by free chlorine and monochloramine. Applied and Environmental Microbiology. 2010;76(4):1028–1033. doi: 10.1128/AEM.01342-09. [DOI] [PMC free article] [PubMed] [Google Scholar]
- Cromeans TL, Lu X, Erdman DD, Humphrey CD, Hill VR. Development of plaque assays for adenoviruses 40 and 41. Journal of Virological Methods. 2008;151(1):140–145. doi: 10.1016/j.jviromet.2008.03.007. [DOI] [PubMed] [Google Scholar]
- Floyd R, Sharp DG. Aggregation of poliovirus and reovirus by dilution in water. Applied and Environment Microbiology. 1977;33(1):159–167. doi: 10.1128/aem.33.1.159-167.1977. [DOI] [PMC free article] [PubMed] [Google Scholar]
- Floyd R, Sharp DG. Viral aggregation: effects of salts on the aggregation of poliovirus and reovirus at low pH. Applied and Environment Microbiology. 1978;35(6):1084–1094. doi: 10.1128/aem.35.6.1084-1094.1978. [DOI] [PMC free article] [PubMed] [Google Scholar]
- Floyd R, Sharp DG. Viral aggregation: buffer effects in the aggregation of poliovirus and reovirus at low and high pH. Applied and Environmental Microbiology. 1979;38(3):395–401. doi: 10.1128/aem.38.3.395-401.1979. [DOI] [PMC free article] [PubMed] [Google Scholar]
- Galdiero F. Adenovirus aggregation and preservation in extracellular environment. Archives of Virology. 1979;59:99–105. doi: 10.1007/BF01317899. [DOI] [PubMed] [Google Scholar]
- Gutierrez L, Mylon SE, Nash B, Nguyen TH. Deposition and aggregation kinetics of rotavirus in divalent cation solutions. Environmental Science and Technology. 2010;44:4552–4557. doi: 10.1021/es100120k. [DOI] [PubMed] [Google Scholar]
- Haas CN, Joffe J. Disinfection under dynamic conditions - modification of Hom model for decay. [Article] Environmental Science and Technology. 1994;28(7):1367–1369. doi: 10.1021/es00056a028. [DOI] [PubMed] [Google Scholar]
- Kahler AM, Cromeans TL, Roberts JM, Hill VR. Effects of source water quality on chlorine inactivation of adenovirus, coxsackievirus, echovirus, and murine norovirus. Applied and Environmental Microbiology. 2010;76(15):5159–5164. doi: 10.1128/AEM.00869-10. [DOI] [PMC free article] [PubMed] [Google Scholar]
- Langlet J, Gaboriaud F, Duval JFL, Gantzer C. Aggregation and surface properties of F-specific RNA phages: implication for membrane filtration processes. Water Research. 2008;42:2769–2777. doi: 10.1016/j.watres.2008.02.007. [DOI] [PubMed] [Google Scholar]
- Mattle MJ, Kohn T. Inactivation and tailing during UV254 disinfection of viruses: Contributions of viral aggregation, light shielding within viral aggregates, and recombination. Environmental Science and Technology. 2012;46(18):10022–10030. doi: 10.1021/es302058v. [DOI] [PubMed] [Google Scholar]
- Monroe JH, Brandt PM. Rapid semiquantitative method for screening large numbers of virus samples by negative stain electron microscopy. Applied Microbiology. 1970;20:259–262. doi: 10.1128/am.20.2.259-262.1970. [DOI] [PMC free article] [PubMed] [Google Scholar]
- Moshe A, Gorovits R. Virus-induced aggregates in infected cells. [Review] Viruses-Basel. 2012;4(10):2218–2232. doi: 10.3390/v4102218. [DOI] [PMC free article] [PubMed] [Google Scholar]
- Sharp DG. Enumeration of virus particles by electron micrography. Proceedings Society Experimental Biology Medicine. 1949;70:54–59. doi: 10.3181/00379727-70-16822. [DOI] [PubMed] [Google Scholar]
- Sharp DG. Quantitative use of the electron microscope in virus research. Laboratory Investigation. 1965;14:93–125. [PubMed] [Google Scholar]
- Sobsey MD, Fuji T, Hall RM. Inactivation of cell-associated and dispersed hepatitis A virus in water. Journal of the American Water Works Association. 1991;83(11):64–67. [Google Scholar]
- Templeton MR, Andrews RC, Hofmann R. Particle-associated viruses in water: impacts on disinfection processes. Critical Reviews in Environmental Science and Technology. 2008;38:137–164. [Google Scholar]
- Thurston-Enriquez JA, Haas CN, Jacangelo J, Gerba CP. Chlorine inactivation of adenovirus type 40 and feline calicivirus. Applied and Environmental Microbiology. 2003;69(7):3979–3985. doi: 10.1128/AEM.69.7.3979-3985.2003. [DOI] [PMC free article] [PubMed] [Google Scholar]
- USEPA. Guidance Manual for Compliance With the Filtration and Disinfection Requirements for Public Water Systems Using Surface Water Sources. Washington, DC: USEPA Office of Drinking Water; 1991. [Google Scholar]
- Van Heerden J, Ehlers MM, Van Zyl WB, Grabow WO. Incidence of adenoviruses in raw and treated water. Water Research. 2003;37(15):3704–3708. doi: 10.1016/S0043-1354(03)00245-8. [DOI] [PubMed] [Google Scholar]
- Wong K, Mukherjee B, Kahler AM, Zepp R, Molina M. Influence of inorganic ions on aggregation and adsorption behaviors of human andenovirus. Environmental Science and Technology. 2012;46:11145–11153. doi: 10.1021/es3028764. [DOI] [PubMed] [Google Scholar]


