

SUMMARY
Some present-day humans derive up to ~5% [1] of their ancestry from archaic Denisovans, an even larger proportion than the ~2% from Neanderthals [2]. We developed methods that can disambiguate the locations of segments of Denisovan and Neanderthal ancestry in present-day humans, and applied them to 257 high coverage genomes from 120 diverse populations among which were 20 individual Oceanians with high Denisovan ancestry [3]. In Oceanians, the average size of Denisovan fragments is larger than Neanderthal fragments, implying a more recent average date of Denisovan admixture in the history of these populations (P=0.00004). We document more Denisovan ancestry in South Asia than is expected based on existing models of history, reflecting a previously undocumented mixture related to archaic humans (P=0.0013). Denisovan ancestry just like Neanderthal ancestry has been deleterious on a modern human genetic background, as reflected by its depletion near genes. Finally, the reduction of both archaic ancestries is especially pronounced on chromosome X and near genes more highly expressed in testes than other tissues (P=1.2×10⁻⁷ to 3.2×10⁻⁷ for Denisovan and 2.2×10⁻³ to 2.9×10⁻³ for Neanderthal ancestry even after controlling for differences in level of selective constraint across gene classes). This suggests that reduced male fertility may be a general feature of mixtures of human populations diverged by >500,000 years.
Graphical Abstract
RESULTS AND DISCUSSION
The date of Denisovan admixture into the ancestors of Oceanians
In order to detect segments of archaic ancestry in modern humans, it is important to know the size scale of these ancestry segments, which in turn reflects the number of generations during which recombination has the chance to break up these segments and thus the date of admixture. The date of Neanderthal admixture has been estimated [3–5] but there has been no study that has estimated the date of Denisovan admixture.
To estimate the date of Denisovan admixture, we exploited the fact that sites at which Denisovans carry a derived allele not seen in both the Altai Neanderthal and a large panel of sub-Saharan Africans are highly likely to derive from Denisovan introgression [6]. We similarly identify sites likely to derive from Neanderthal introgression. Within each class, we fit an exponential function to the decay of linkage disequilibrium with genetic distance. The inverse of the decay constant translates to the average date of gene flow in generations (Supplemental Experimental Procedures, section S1). In Oceanians, the rate of decay at sites informative of Denisovan ancestry is estimated to be slower than the rate at sites informative of Neanderthal ancestry (P=0.00004 for the null hypothesis of the two dates being equal, based on a two-sided test using Block Jackknife) (Figure 1). We caution that the nominal date estimate of 1000±8 generations ago for Denisovan admixture and 1121±16 generations ago for Neanderthal admixture are likely to be biased. One source of bias arises from the fact that errors in the genetic map can produce systematic underestimates of dates inferred based on linkage disequilibrium; however, as both types of ancestry have been decaying in the same population, this will bias the inference of Denisovan and Neanderthal admixture dates in exactly the same way, and hence will not contribute to an artifactual inference of one date being more recent than the other. A second source of bias can arise due to extreme demographic events since admixture [4]. We carried out coalescent simulations to explore this possibility and found that a slower linkage disequilibrium decay provides unambiguous evidence of more recent admixture, even taking into account biases arising due to plausible differences in the demographic history of Denisovans and Neanderthals (Supplemental Experimental Procedures, section S1.1, Table S1). Further, we verified that the observation of a more recent date of Denisovan admixture is unchanged when we fit a two-pulse model of admixture (we obtained nominal date estimates of 986 and 21808 generations for Denisovan admixture and 1197 and 90262 generations for Neanderthal admixture). To obtain a rough estimate of the date of Denisovan admixture—cognizant of the fact that for Oceanians we do not have the information needed to fully correct for uncertainty in the genetic map—we calibrated to previous estimates of the date of Neanderthal admixture, under the simplifying assumption that the date of Neanderthal admixture in the history of New Guineans is the same as the 50,000–60,000 years ago estimated for a radiocarbon dated Upper Paleolithic Siberian [3]. Rescaling by 1000/1121, we estimate 44,000–54,000 years ago for Denisovan admixture.
Figure 1. More recent date of Denisovan than Neanderthal admixture.

Average linkage disequilibrium (Lewontin’s D) as a function of distance in Oceanians for SNPs informative of Neanderthal (red) and Denisovan (blue) ancestry. The Denisova decay is slower implying a more recent date.
Denisovan and Neanderthal introgression maps
To study the impact of the Denisovan and Neanderthal admixture events simultaneously, we developed methods that allow us to distinguish these two sources of archaic ancestry. We applied these methods to the Simons Genome Diversity Project (SGDP) dataset: 257 high quality genomes from 120 non-African populations, including 20 Oceanian individuals from populations known to have high Denisovan admixture [7] (Supplemental Experimental Procedures, section S2.1).
For each individual, we inferred archaic ancestry segments across the autosomes (chromosomes 1–22) and chromosome X (our method did not allow us to test for archaic ancestry on chromosome Y because the archaic genomes are from females). Figure 2A plots the estimates of the proportion of confidently inferred Denisovan ancestry on a map, while Table 1 tabulates the results for six population pools (Table S2 tabulates the results for each population). Denisovan ancestry in Oceanians is greater than in other non-Africans [1] (Table 1). Both Neanderthal and Denisovan ancestry are greater in eastern non-Africans than in West Eurasians [6, 8–11] (Supplemental Experimental Procedures, section S2.5; Table S3). We replicate previous findings of substantial Denisovan ancestry New Guineans and Australians, as well as in populations that harbor admixtures of New Guinean ancestry [12]. However, we were surprised to detect a peak of Denisovan ancestry estimates in South Asians, both in the Himalayan region and in South and Central India (Figure 2A). The highest estimate is in Sherpas (0.10%) who have a Denisovan point estimate about a tenth of that seen in Papuans (1.12%) (Table S3). While this is notable in light of the likely Denisovan origin of the EPAS1 allele that confers high-altitude adaptation in Tibetans [13] [14], EPAS1 is not sufficient to explain the observation as Sherpas have the highest point estimate even without chromosome 2 on which EPAS1 resides. To determine if the peak of Denisovan ancestry in South Asia is significant, we tested if the Denisovan ancestry proportion in diverse mainland Eurasians can be explained by differential proportions of non-West Eurasian ancestry (as it is already known that there is more Denisovan ancestry in East Eurasians than in West Eurasians [6]). For each Eurasian population X, we computed an allele frequency correlation statistic that that is proportional to eastern non-African ancestry (Figure 2B; Supplemental Experimental Procedures, section S2.6). We regressed the proportion of confidently inferred Denisovan ancestry against this statistic. While the proportion of Denisovan ancestry in these populations is correlated with non-West Eurasian ancestry (ρPearson=0.832, Block Jackknife P=3.6×10⁻¹⁰ for the correlation coefficient being nonzero), South Asian groups as a whole have significantly more Denisovan ancestry than expected (Block Jackknife Z-score for residuals = 3.2, P=0.0013 by a two-sided test for the null hypothesis that the Denisovan ancestry estimate in South Asians is predicted by their proportion of non-West Eurasian ancestry, Figure 2B; Supplemental Experimental Procedures, section S2.6). The signal remains significant (Z=3.1) when we remove from the analysis five populations that have ancestry very different from the majority of South Asians (Tibetan, Sherpa, Hazara, Kusunda and Onge); however, the signals are non-significant for Central Asians (Z=1.2) and Native Americans (Z=0.1). Taken together, the evidence of Denisovan admixture in modern humans could in theory be explained by a single Denisovan introgression into modern humans, followed by dilution to different extents in Oceanians, South Asians, and East Asians by people with less Denisovan ancestry. If dilution does not these patterns, however, a minimum of three distinct Denisovan introgressions into the ancestors of modern humans must have occurred.
Figure 2. Variation in Denisovan ancestry proportion.

(A) Proportion of the genome inferred to be Denisovan in ancestry in diverse non-Africans. The color scale is not linear to allow saturation of the high Denisova proportions in Oceania (bright red) and better visualization of the peak of Denisova proportion in South Asia. (B) Proportion of the genome confidently inferred to be Denisovan in ancestry in mainland Eurasians plotted against the rate of allele sharing of each samples with non-West Eurasians as measured by an f4-statistic. The Denisovan ancestry estimates in South Asians are systematically above expectation (fitted trend line) (P=0.0013). See also Table S3.
Table 1.
Genome-wide estimates of archaic ancestry
| Population | Individuals | Neanderthal ancestry (%) | Denisovan ancestry (%) | ||
|---|---|---|---|---|---|
| Autosomes | X | Autosomes | X | ||
| America | 29 | 1.37±0.11 | 0.26±0.18 | 0.05±0.01 | 0.00±0.00 |
| Central Asia | 27 | 1.40±0.12 | 0.23±0.18 | 0.05±0.01 | 0.00±0.00 |
| East Asia | 50 | 1.39±0.11 | 0.32±0.28 | 0.06±0.02 | 0.00±0.01 |
| Oceania | 26 | 1.54±0.12 | 0.42±0.36 | 0.85±0.43 | 0.18±0.17 |
| South Asia | 48 | 1.19±0.11 | 0.40±0.26 | 0.06±0.03 | 0.01±0.03 |
| West Eurasia | 77 | 1.06±0.12 | 0.18±0.19 | 0.02±0.01 | 0.00±0.00 |
Note: We estimated the probability of Neanderthal and Denisovan ancestry for each phased genome in each population. We report the mean and standard deviation of the proportion of confidently inferred archaic alleles (marginal probability > 50%) across diploid individuals within each population. The highest point estimate of Neanderthal ancestry is in Oceania, and while this estimate is significantly higher than that in West Eurasia (Z=3.9) consistent with previous reports [8, 9] it is not higher than that in East Asia (Z=0.7).
Tiling path of Denisovan and Neanderthal ancestry inferred from modern genomes
The union of detected Denisovan haplotypes spans 257 Mb in Oceanians (Supplemental Experimental Procedures, section S2.7). The union of Neanderthal haplotypes spans 673 Mb over all non-Africans, which is smaller than the 1.1 Gb found in 1000 Genomes Phase 1 data [15], likely due to the fact that the total number of non-Africans genomes analyzed here is smaller. The positions of archaic ancestry are correlated across populations, with the strongest correlations at large spatial scales among the Neanderthal maps and weaker correlations between the Neanderthal and Denisovan maps (Figure 3B).
Figure 3. Fine-scale maps of Denisovan and Neanderthal introgression.

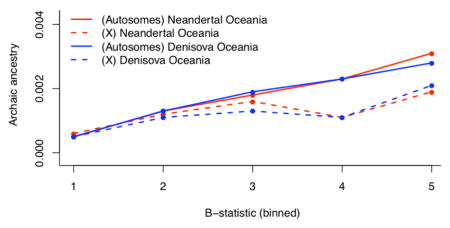
(A) Non-overlapping 100 kb windows that have non-zero inferred archaic ancestry in each of six populations (Denisova blue, Neanderthal red). In the innermost rings we plot deserts (windows >10 Mb). (B) Correlation of confidently inferred archaic ancestry (Neanderthal ancestry in six non-African populations as well as Denisovan ancestry in Oceanians) across populations in non-overlapping windows of size 100 kb, 1 Mb and 10 Mb. (C) We plot the median of the proportion of Denisovan and Neanderthal ancestry within quintiles of a B-statistic measuring intensity of linked selection (low B indicates the regions most affected by linked selection). See also Tables S6.
Regions with elevated proportions of archaic ancestry
We scanned all maps for windows with elevated proportions of archaic ancestry (average marginal probability ≥0.30 over a 100 kb window based on a published threshold [4]; Supplemental Experimental Procedures, section S3; Tables S4). We identified 238 windows with elevated Neanderthal ancestry in a pool of all non-Africans, and 48 with elevated Denisovan ancestry in Oceanians. Regions with elevated archaic ancestry may represent loci where archaic alleles have experienced positive selection, but a formal test is challenging due to the fact that archaic alleles, on average, do not evolve neutrally [15–18]. We also tested for sets of genes that have among the 5% highest archaic ancestry (hypergeometric test implemented in FUNC [19]; we report P<0.05 after multiple testing correction; Supplemental Experimental Procedures, section S4). Genes involved in keratin filament formation related to skin and hair are enriched for Neanderthal ancestry generalizing the results of previous analyses that were limited to Europeans and East Asians [15, 16]. Genes involved in phospholipid transporter activity related to fat metabolism, and trace-amine receptor activity related to detecting subtle scents, are significantly enriched for Denisovan ancestry (Table S5).
Deserts of archaic ancestry
Some of the most striking features of the introgression maps are the archaic ancestry deserts: windows longer than 10Mb at which the archaic ancestry proportion is <1/1000 (Figure 3A; Supplemental Experimental Procedures, section S5). We identified 18 Neanderthal ancestry deserts in a pool of all non-African individuals, and 63 Denisovan deserts in Oceanians. Four windows (1:99–112 Mb, 3:78–90 Mb, 7:108–128 Mb, and 13:49–61 Mb) are both Neanderthal and Denisovan ancestry deserts. The desert on chromosome 7 contains the FOXP2 gene that has been hypothesized to have a role in enabling modern human speech and language [20] and that has been identified as a desert in previous maps in Europeans and East Asians. Our finding that this region is also a desert of Denisovan ancestry strengthens the evidence that the modern human version of this gene may be critical for modern human biology [15, 16].
Archaic ancestry is reduced in the genomic regions most constrained by selection
We tested the relationship between archaic ancestry and regions of strong linked selection as measured by a B-statistic [21]. Neanderthal ancestry decreases in proximity to functional elements in all populations (ρSpearman=0.25–0.29; Figure 3C, Supplemental Experimental Procedures, section S5.1; Table S6), as does Denisovan ancestry in Oceanians (ρSpearman=0.26, Table S6), likely reflecting greater selection against Neanderthal ancestry in low B-statistic regions [15–18]. Power to detect archaic ancestry is elevated close to regions of linked selection due to a reduction in the rates of incomplete lineage sorting caused by the lower effective population size in these regions [15] so these results are not artifacts of reduced power. Thus, similar processes appear to have worked to remove Neanderthal and Denisovan ancestry near genes.
Archaic-modern admixture was likely associated with reduced male fertility
Our study provides new evidence in support of the hypothesis that reduced male fertility may be a common feature of admixture human populations diverged by at least a half million years, a hypothesis that was previously suggested based on genetic patterns associated with the hybridization between Neanderthals and modern humans [15, 22]. We show that qualitatively similar signals are associated with Denisovan admixture.
One line of evidence for reduced fertility in male hybrids is that the proportion of archaic ancestry in modern humans is significantly reduced on chromosome X compared to the autosomes. This is suggestive of reduced male fertility as loci contributing to this phenotype are concentrated on chromosome X in hybrids of other species [23]. We confirm an extreme reduction of Neanderthal ancestry on chromosome X (16–34% of the autosomes depending on the population) [15], and find a quantitatively similar reduction of Denisovan ancestry (21% of the autosomes in Oceanians) (Table 1).
The second line of evidence in support of the hypothesis of reduced fertility in hybrids is that there is a reduction of archaic ancestry in genes that are disproportionately expressed in testes, a known characteristic of male hybrid fertility [23]. To test for this signal in our data, we analyzed a set of genes having a significantly higher expression level in testes than any of 15 others tissues in an RNA sequencing dataset [24]. We detect a statistically significant depletion of Denisovan (P=1.21×10⁻⁷ in Oceanians) as well as Neanderthal (P =2.1×10⁻³ in Oceanians) ancestry in these genes relative to the genes in the other tissues (Table S7; Supplemental Experimental Procedures, section S6). We considered the possibility that these observations could be explained by stronger linked selection at testes-expressed genes than at random places in the genome. However, when we correlate this pattern to B-statistics (which are sensitive to linked selection [21]), we find that the gene sets that are disproportionally expressed in liver, heart and skeletal muscle have even lower average B-statistics than the genes most expressed in testes, and yet do not show a depletion in archaic ancestry (Table S7). We also considered the possibility that the B-statistic might not fully capture the degree of selective constraint at the genes disproportionately expressed in testes. However, when we use logistic regression to control for measures of selective constraint, we find that the significant reduction is observed not only when we control for B-statistic at each gene (P=4.4×10⁻⁷ for Denisovans; P=2.8 × 10⁻³ for Neanderthal). It is also observed when we control for a direct estimate of the degree of selective constraint: the genetic diversity observed empirically at each gene in sub-Saharan Africans (P=3.2×10⁻⁷ for Denisovans; P=2.9×10⁻³ for Neanderthal, Supplemental Experimental Procedures section S6).
Conclusion
It has been suggested that the empirically observed reduction in Neanderthal ancestry in Europeans and East Asians near functionally important regions could be explained by a greater load of weakly deleterious alleles in Neanderthals due to the smaller population size of Neanderthals since separation, followed by purging of deleterious Neanderthal alleles in the mixed population [17, 18]. Since we have shown that similar patterns are associated with the Denisovan introgression event, it seems plleausib that similar evolutionary forces operated to remove Denisovan ancestry segments. However, the model of a greater load of deleterious mutations in archaic humans cannot explain the observed reduction of both Neanderthal and Denisovan ancestry near genes that are disproportionately expressed in testes, suggesting that male hybrid sterility may have been associated with both introgressions. An important direction for future research is to understand the relative importance of purging of slightly deleterious alleles, and reduced fertility in hybrid males, in changing the content of genomes in the aftermath of the interbreeding that occurred between modern and archaic humans.
EXPERIMENTAL PROCEDURES
Inferring segments of archaic ancestry
To determine the positions of archaic ancestry segments, we applied a machine learning algorithm known as a Conditional Random Field (CRF) [25]. The input data consists of the spatial distribution across the genome of derived alleles at sites informative about archaic ancestry (including the Neanderthal and Denisova-informative sites). The CRF searches for runs of such alleles over the size scale expected for archaic introgression. The method we use is changed in important ways compared to the CRF previously implemented to solve the simpler problem of detecting Neanderthal ancestry (Supplemental Experimental Procedures, section S2.4) [15]. Not only do we use different classes of SNPs, but we also do not exploit the haplotype-based information used by the previously reported CRF, as we found that it leads to a bias in the inferred proportions of Denisovan ancestry in mainland Eurasians that have proportions of Denisovan ancestry of ~1/1000. This bias arises due to the previously described CRF being optimized for archaic admixture proportions of ~1/100; we found that this led erroneously to similar inferences of Denisovan ancestry in Han and French [6].
Assessing the accuracy of archaic segment inference
Discriminating between Neanderthal and Denisovan ancestral components in populations that have both, such as Oceanians, is challenging because Neanderthals and Denisovans are more similar to each other on average than either is to modern humans [1, 6]. To assess the accuracy of our inferences (Supplemental Experimental Procedures, section S2.3; Figure S1), we devised a statistical procedure that uses previous genome-wide estimates of archaic ancestry to estimate the probability that the CRF infers Denisovan (or Neanderthal) ancestry when the true ancestry is Neanderthal, Denisovan or modern human. For example, the inferred proportion of Neanderthal ancestry in African hunter-gatherers who likely have negligible amounts allows us to estimate the rate of misclassification of modern human ancestry as Neanderthal. Similarly, the inferred proportion of Denisovan ancestry in West Eurasians who have negligible amounts allows us to estimate the rate of misclassification of non-Denisovan ancestry as Denisovan. This procedure enables us to estimate the false discovery rate (FDR) for an ancestry (the probability that segments assigned to a given ancestry are misclassified (Supplemental Experimental Procedures, section S2.3, Figure S1)). In Oceanians, at a threshold of 0.50 on the CRF probabilities, the FDR is 3% for Denisovan ancestry and 15% for Neanderthal ancestry. Our procedure also enables us to estimate the fraction of true archaic ancestry that we detect. We detect 24% of true Denisovan and 72% of true Neanderthal segments. The relatively low power to detect true Denisovan segments is likely to reflect the fact that the Siberian Denisovan genome that we use for detecting these segments is known to be deeply divergent from the Denisovan population that introgressed into the ancestors of Oceanians (much more divergent than the Altai Neanderthal genome is from the introgressing Neanderthal population) [6].
Supplementary Material
Acknowledgments
The raw data analyzed for 277 of the samples analyzed here are available through the EBI European Nucleotide Archive under accession numbers PRJEB9586 and ERP010710. A version of the genotype data we analyzed that is small enough to download by ftp is available at http://reich.hms.harvard.edu/pub/datasets/sgdp/. The remaining 23 samples are only available to researchers who provide a signed letter affirming that they will abide by specific restrictions for using the samples, and can be accessed by writing to D.R. D.R. was supported by NIH grant GM100233, by NSF HO BCS-1032255, and is a Howard Hughes Medical Institute investigator. S.S was supported in part by NIH grant K99 GM111744.
Footnotes
AUTHOR CONTRIBUTIONS
S.S. and S.M. performed analyses. N.P. and D.R. supervised the study. S.S. and D.R. wrote the manuscript.
Supplemental information includes Supplemental Experimental Procedures, one supplementary figure and six supplementary tables.
Publisher's Disclaimer: This is a PDF file of an unedited manuscript that has been accepted for publication. As a service to our customers we are providing this early version of the manuscript. The manuscript will undergo copyediting, typesetting, and review of the resulting proof before it is published in its final citable form. Please note that during the production process errors may be discovered which could affect the content, and all legal disclaimers that apply to the journal pertain.
References
- 1.Reich D, et al. Genetic history of an archaic hominin group from Denisova Cave in Siberia. Nature. 2010;468(7327):1053–60. doi: 10.1038/nature09710. [DOI] [PMC free article] [PubMed] [Google Scholar]
- 2.Green RE, et al. A draft sequence of the Neandertal genome. Science. 2010;328(5979):710–22. doi: 10.1126/science.1188021. [DOI] [PMC free article] [PubMed] [Google Scholar]
- 3.Fu Q, et al. Genome sequence of a 45,000-year-old modern human from western Siberia. Nature. 2014;514(7523) doi: 10.1038/nature13810. [DOI] [PMC free article] [PubMed] [Google Scholar]
- 4.Sankararaman S, et al. The date of interbreeding between Neandertals and modern humans. PLoS genetics. 2012;8(10) doi: 10.1371/journal.pgen.1002947. [DOI] [PMC free article] [PubMed] [Google Scholar]
- 5.Seguin-Orlando A, et al. Paleogenomics. Genomic structure in Europeans dating back at least 36,200 years. Science. 2014;346(6213):1113–8. doi: 10.1126/science.aaa0114. [DOI] [PubMed] [Google Scholar]
- 6.Prufer K, et al. The complete genome sequence of a Neanderthal from the Altai Mountains. Nature. 2014;505(7481):43–9. doi: 10.1038/nature12886. [DOI] [PMC free article] [PubMed] [Google Scholar]
- 7.Mallick S, et al. The landscape of human genome diversity. 2015 in review. [Google Scholar]
- 8.Wall JD, et al. Higher levels of neanderthal ancestry in East aSians than in Europeans. Genetics. 2013;194(1):199–209. doi: 10.1534/genetics.112.148213. [DOI] [PMC free article] [PubMed] [Google Scholar]
- 9.Meyer M, et al. A high-coverage genome sequence from an archaic Denisovan individual. Science. 2012;338(6104):222–6. doi: 10.1126/science.1224344. [DOI] [PMC free article] [PubMed] [Google Scholar]
- 10.Vernot B, Akey JM. Complex history of admixture between modern humans and Neandertals. Am J Hum Genet. 2015;96(3):448–53. doi: 10.1016/j.ajhg.2015.01.006. [DOI] [PMC free article] [PubMed] [Google Scholar]
- 11.Skoglund P, Jakobsson M. Archaic human ancestry in East Asia. Proc Natl Acad Sci U S A. 2011;108(45):18301–6. doi: 10.1073/pnas.1108181108. [DOI] [PMC free article] [PubMed] [Google Scholar]
- 12.Reich D, et al. Denisova admixture and the first modern human dispersals into Southeast Asia and Oceania. American journal of human genetics. 2011;89(4):516–28. doi: 10.1016/j.ajhg.2011.09.005. [DOI] [PMC free article] [PubMed] [Google Scholar]
- 13.Huerta-Sanchez E, et al. Altitude adaptation in Tibetans caused by introgression of Denisovan-like DNA. Nature. 2014;512(7513):194–7. doi: 10.1038/nature13408. [DOI] [PMC free article] [PubMed] [Google Scholar]
- 14.Jeong C, et al. Admixture facilitates genetic adaptations to high altitude in Tibet. Nat Commun. 2014;5:3281. doi: 10.1038/ncomms4281. [DOI] [PMC free article] [PubMed] [Google Scholar]
- 15.Sankararaman S, et al. The genomic landscape of Neanderthal ancestry in present-day humans. Nature. 2014;507(7492):354–7. doi: 10.1038/nature12961. [DOI] [PMC free article] [PubMed] [Google Scholar]
- 16.Vernot B, Akey JM. Resurrecting surviving Neandertal lineages from modern human genomes. Science. 2014;343(6174):1017–21. doi: 10.1126/science.1245938. [DOI] [PubMed] [Google Scholar]
- 17.Juric I, Aeschbacher S, Coop G. The Strength of Selection Against Neanderthal Introgression. BioRxiv. 2015 doi: 10.1371/journal.pgen.1006340. [DOI] [PMC free article] [PubMed] [Google Scholar]
- 18.Harris K, Nielsen R. The Genetic Cost of Neanderthal Introgression. BioRxiv. 2015 doi: 10.1534/genetics.116.186890. [DOI] [PMC free article] [PubMed] [Google Scholar]
- 19.Prufer K, et al. FUNC: a package for detecting significant associations between gene sets and ontological annotations. BMC Bioinformatics. 2007;8:41. doi: 10.1186/1471-2105-8-41. [DOI] [PMC free article] [PubMed] [Google Scholar]
- 20.Lai CS, et al. A forkhead-domain gene is mutated in a severe speech and language disorder. Nature. 2001;413(6855):519–23. doi: 10.1038/35097076. [DOI] [PubMed] [Google Scholar]
- 21.McVicker G, et al. Widespread genomic signatures of natural selection in hominid evolution. PLoS genetics. 2009;5(5):e1000471. doi: 10.1371/journal.pgen.1000471. [DOI] [PMC free article] [PubMed] [Google Scholar]
- 22.Currat M, Excoffier L. Strong reproductive isolation between humans and Neanderthals inferred from observed patterns of introgression. Proceedings of the National Academy of Sciences of the United States of America. 2011;108(37):15129–34. doi: 10.1073/pnas.1107450108. [DOI] [PMC free article] [PubMed] [Google Scholar]
- 23.Presgraves DC. Sex chromosomes and speciation in Drosophila. Trends Genet. 2008;24(7):336–43. doi: 10.1016/j.tig.2008.04.007. [DOI] [PMC free article] [PubMed] [Google Scholar]
- 24.Derrien T, et al. The GENCODE v7 catalog of human long noncoding RNAs: analysis of their gene structure, evolution, and expression. Genome research. 2012;22(9):1775–89. doi: 10.1101/gr.132159.111. [DOI] [PMC free article] [PubMed] [Google Scholar]
- 25.Lafferty J, McCallum A, Pereira F. Conditional Random Fields: Probabilistic Models for Segmenting and Labeling Sequence Data. Proc 18th IntConf MachLearn. 2001:282–289. [Google Scholar]
Associated Data
This section collects any data citations, data availability statements, or supplementary materials included in this article.