

Abstract
Background
There is insufficient data concerning sarcopenia prevalence in South America. The aim of this study was to estimate sarcopenia prevalence and its clinical subgroups in a Southern Brazilian city.
Methods
A cross‐sectional population‐based study was performed among community‐dwelling elderly aged 60 years or over. Subjects were evaluated according to the European Working Group on Sarcopenia in Older People established criteria. Muscle mass was estimated by calf circumference (CC). Cut‐off CC points were defined by a subsample's dual X‐ray absorptiometry estimation of the appendicular skeletal muscle mass index (ASMI), which was subsequently compared with the values of a young adult population from the same city. Muscle strength was measured by manual dynamometry. Muscle performance was assessed through the 4 m gait speed test.
Results
The three diagnostic tests were performed in 1291 subjects. CC of ≤34 cm (males) and ≤33 cm (females) were defined as indicatives of low ASMI. The overall sarcopenia prevalence was 13.9% (CI95% 12.0; 15.8%). Its frequency was significantly higher among elderly with low schooling, without a partner, with low socioeconomic status, smokers, inactive, and with low body mass index. A higher prevalence of pre‐sarcopenia was found in the youngest elderly; a higher prevalence of the clinical stages of the syndrome was found in older age groups.
Conclusions
Approximately one in ten elderly aged 60–69 years was in the preclinical stage of the disease. This is the age group in which public policies should focus to establish early diagnosis and prevent clinical progression of the syndrome.
Keywords: Sarcopenia, Prevalence, Elderly, Calf circumference, Muscle mass
Introduction
Sarcopenia was defined by Rosenberg1 in 1989 as a ‘loss of lean mass related to age’. Since then, it has been shown that muscle mass and muscle functionality do not show a clear linear relationship. Therefore, the loss of muscle functionality (e.g. strength, and physical performance) as well as mass should be included in the definition of sarcopenia. Indeed, in 2010, the European Working Group on Sarcopenia in Older People (EWGSOP) proposed the following new definition for this disease: a syndrome characterized by the progressive and generalized loss of skeletal muscle mass associated with loss of strength and/or function.2
The prevalence of this syndrome differs around the world. However, the lack of consensus diagnostic criteria makes it difficult to compare different studies to determine the true prevalence of sarcopenia in these various populations. Since the EWGSOP consensus was established, studies have become more comparable, allowing researchers to create a ‘global map’ of sarcopenia, which has revealed prevalences ranging from 5 to 33% in the various regions evaluated.3, 4, 5, 6, 7, 8, 9
Despite the great progress in research in this field, data on sarcopenia in Latin America are scarce. Of the two population‐based studies that have been published,4, 5 only one was conducted in South America4 and was based on data from 2006 that did not include classification of the preclinical phase of the disease (pre‐sarcopenia). Considering the pace with which the population is ageing, newer data and more prevalence studies are needed. Therefore, the present study aims to describe the occurrence of the different phases of sarcopenia among the elderly in a medium‐sized city in southern Latin America, as well as to identify the population groups that are most likely to experience this outcome.
Materials and methods
The proposed study was a cross‐sectional population survey. The survey was carried out in Pelotas, a southern Brazilian city with approximately 330 000 inhabitants.10
Data collection was carried out by a research consortium11 known as COMO VAI? (Masters Consortium for Valuation of Elderly Care – Consórcio de Mestrado Orientado para a Valorização da Atenção ao Idoso). To ensure a random and representative study population, the sampling process was performed in two stages. First, according to the methods used by the latest estimate of the Brazilian Institute of Geography and Statistics (Instituto Brasileiro de Geografia e Estatística – IBGE), from 2010,12 the population of Pelotas was divided into census tracts of approximately 300 households each and ordered according to the mean income of each inhabitant. The participants were then randomly selected, resulting in 133 selected tracts. The second phase consisted of randomly selecting approximately 30 households in each tract. Based on a prior estimate of the same census, which found 0.43 elderly people/household, we expected to find at least 12 elderly people per tract, resulting in a total sample of approximately 1700 elderly people. This number was considered to be adequate for the studied outcome, given that sarcopenia has an expected prevalence of approximately 10% (with a margin of error of two percentage points) and factoring in a 20% increase for losses and refusals, a sample of at least 1100 individuals would be required.
The inclusion criteria for the research consortium were non‐institutionalized elderly people aged 60 years or more who were inhabitants of the urban area of Pelotas. The specific exclusion criterion for the present study was physical or mental incapacity to perform the requested tests. These tests required physical and motor integrity in at least one hand to perform a grip strength test; having an intact right leg with which to measure calf circumference (CC) and the ability to perform a walking test without external aids (the use of crutches, canes, or similar devices was allowed).
Individuals were interviewed in their own homes between January and August 2014. During that time, a questionnaire for socio‐economic, behavioural and nutritional factors was performed. The tests and measurements (gait speed, handgrip strength, CC and knee height) were also performed at this time.
The prevalence of sarcopenia in the main study population was then determined using a combination of the three methods described in the succeeding sections, according to the criteria established by EWGSOP.2 Figure 1 shows a step‐by‐step flowchart of the study.
Figure 1.
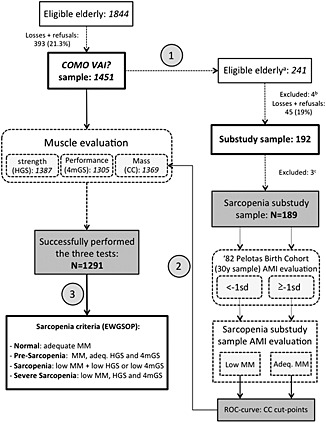
Study flowchart. Step 1: body composition substudy sample chosen through deterministic sampling of the Masters Consortium for Valuation of Elderly Care (COMO VAI?) study sample. Step 2: calf circumference cut‐off points applied to the COMO VAI? study sample. Step 3: sarcopenia prevalence in the COMO VAI? study determined by previously established EWGSOP criteria. (A) Elderly born in the months of March or September, (B) one death, three hospitalizations, and (C) two subjects with missing data concerning calf circumference, one subject with an anatomical abnormality in the calf. ASMI, appendicular skeletal muscle mass index; SD, standard deviation; MM, muscle mass; Adeq., adequate; ROC, receiving operator characteristic; CC, calf circumference; HGS, handgrip strength; 4mGS, 4 m gait speed; EWGSOP, European Working Group on Sarcopenia in Older People.
Operational definition of sarcopenia
According to the adopted criteria (established by consensus by EWGSOP2), the outcome ‘sarcopenia’ was subdivided into pre‐sarcopenia (isolated loss of muscle mass), sarcopenia (loss of muscle mass with loss of muscle strength or performance) and severe sarcopenia (loss of muscle mass, strength and performance). Individuals who did not meet these criteria were considered normal for the outcome studied.
To establish the diagnosis of sarcopenia, CC, handgrip strength and gait speed were measured in the elderly subjects as described in the succeeding paragraphs.
Calf circumference
Two measurements of the circumference of each calf were alternately performed with an inextensible tape measure (Cerscorf, Brazil) by trained and standardized interviewers. The subject was instructed to stand with their legs in an uncontracted position approximately 20 cm apart. The measurement was taken at the point of greatest horizontal circumference, as recommended by Lohman.13 The mean of the two measurements of the right calf was used for analytical purposes.
EWGSOP recommends that the loss of lean mass be determined using reference values derived from a portion of young adults from the same population studied.2 For this purpose, a substudy was conducted concurrently with the main study using a deterministic subsample of the elderly subjects (born in March and September). These subjects were invited to the Dr. Amílcar Gigante Epidemiologic Research Centre for dual‐energy X‐ray absorptiometry (DXA) examination to estimate their appendicular skeletal muscle mass index (ASMI) – defined as the total appendicular skeletal muscle mass/orthostatic height2 (kg/m2).
For each sex, mean values, and cut‐off points corresponding to −1 SD of the ASMI of the young adult population from the same area were obtained from a previous cohort study of births. More details from this study can be found in the cohort profile published in 2006.14 The ASMI means (and SD) of the young adults obtained by DXA in a follow‐up study conducted in 2012 (when they were 30 years old) were 8.76 (0.99) and 6.44 (0.82) kg/m2 for the men and women, respectively. In this way, the cut‐off points of 7.77 and 5.62 kg/m2 (−1 SD) were determined for the men and women, respectively. These cut‐off points were compared with the ASMI of the elderly subjects that participated in the substudy, thereby defining loss of muscle mass relative to the young people. Based on the CC measures of the elderly subjects in the substudy, cut‐off points for CC were defined for both genders and later applied to the total population of the main study.
Muscle strength
Muscle strength was measured using a digital hand dynamometer (Jamar Digital Plus + Hand Dynamometer; Simmons Preston, Canada), according to the methodology recommended by Roberts.15 Each individual sat in a chair with armrests, without rings, watches, or other objects on their hands or wrists. The upper limb to be evaluated was placed alongside the body with the elbow at a 90° angle; the contralateral limb was relaxed on the thigh. During the exam, interviewers were instructed to provide verbal motivational stimulus to determine the maximum strength of the individuals for each measurement. Three measurements were determined for each hand in an alternating manner, and the maximum strength was defined as the greatest of the six measurements. The cut‐off points for loss of handgrip strength were less than 30 kg for men and less than 20 kg for women.16
Muscle performance
A 4 m gait speed test was applied to evaluate muscular performance. The subject was instructed to walk as fast as possible without running through a predetermined 4 m straight path with no obstacles; the time to complete the course was measured. The test was applied twice, with an interval of approximately 30 s between applications. To determine the loss of muscle performance, the lowest of the two measurements was considered, using the previously established cut‐off point of less than 0.8 m/s.16
Other anthropometric measures
Body weight was measured using a digital scale (Tanita UM‐080, Tanita, Tokyo, Japan). Estimated height, for use in the main study, was determined based on knee height measured with portable paediatric wooden stadiometers, according to the methodology and prediction equations suggested by Chumlea.17 Standing height, which was used to calculate the ASMI in the substudy, was measured by a standardized researcher using a fixed stadiometer (CMS Weighting Equipment; London, UK).
Body mass index (BMI) was calculated as weight/estimated height of the knee2 (kg/m2). Individuals were categorized as either underweight (BMI < 22 kg/m2) or not underweight according to the cut‐off points established by Lipschitz for the elderly.18
Socio‐economic and health‐related aspects
A questionnaire was given to the study participants to obtain information regarding the following variables: schooling (in years), marital status, heart disease, and diabetes mellitus (DM) (self‐reported). Gender and skin colour were observed and recorded by the interviewers.
Socio‐economic status was determined according to criteria of the Brazilian Association of Research Companies (Associação Brasileira de Empresas de Pesquisa – ABEP),19 which considers the possession of certain consumer goods, the head of the household's schooling, and the presence of a maid. According to this scale, individuals in category A are considered the wealthiest and category E the least wealthy.
Physical activity level was assessed using the domains of leisure and displacement in the International Physical Activity Questionnaire.20 Both domains were added, and, according to guidelines, the time spent on intense activities was multiplied by two. Individuals who reported less than 150 min of physical activity per week were considered inactive.21
Statistical analysis
The characteristics of the elderly respondents and participants in the substudy were described as percentages, means or SD values. Pearson's Chi‐square test was used to study the associations between categorical variables, and where applicable, the test for linear trends was used. A receiving operator characteristic curve was also constructed to predict low ASMI in the elderly based on CC measures, and sensitivity and specificity were calculated. The cut‐off points for the CC measurement were determined by analysing the point of maximum sensitivity and specificity (MSE)22 for each gender, defined by the formula (1‐sensitivity)2 + (1‐specificity)2.
All analyses were performed using the statistical software program Stata version 12.1 (StataCorp, College Station, TX, USA), considering the effect of the study design. The significance limits were set at p < 0.05.
Ethical aspects
Both projects—the COMO VAI? Consortium and the substudy on body composition—were approved by the Research Ethics Committee of the School of Medicine of Federal University of Pelotas (Universidade Federal de Pelotas – UFPel, Pelotas, Brazil). The participation of the individuals in the study was voluntary, and informed consent was obtained from all participants.
Results
Based on our sampling methods, 1844 eligible elderly subjects were identified in the city of Pelotas, of which 1491 were interviewed. Of these subjects, 1291 (86.6%) were able to perform the three exams established for the diagnosis of sarcopenia. Among the 1491 elderly subjects in the main study, 241 were selected by deterministic sampling to participate in the substudy on body composition. One hundred and eighty‐nine elderly subjects constituted the final sample in the sarcopenia substudy. Figure 1 shows the flow of study participants.
Table 1 shows a comparative analysis of the participants in the main study (N = 1451) and the substudy (N = 189). The groups were similar for all variables evaluated. The majority of individuals from both groups were white, with up to 8 years of schooling, of intermediate economic success, non‐smokers, inactive, and had no history of heart disease or DM. With respect to the criteria related to the main outcome, the majority of subjects performed adequately on the walking, handgrip strength, and CC tests.
Table 1.
Masters Consortium for Valuation of Elderly Care study and body composition substudy participants' characteristics
| Variable | COMO VAI? study N (%) | Body composition substudy N (%) | P |
|---|---|---|---|
| Sex | — | — | 0.736 |
| Male | 537 (37.0) | 90 (38.0) | — |
| Female | 914 (63.0) | 147 (62.0) | — |
| Skin colour | — | — | 0.393 |
| Caucasian | 1211 (83.7) | 156 (81.3) | — |
| Non‐Caucasian | 236 (16.3) | 36 (18.7) | — |
| Years of study | — | — | 0.981 |
| None | 196 (13.7) | 27 (14.2) | — |
| <8 years | 782 (54.4) | 103 (53.9) | — |
| ≥8 years | 459 (31.9) | 61 (31.9) | — |
| Marital status | — | — | 0.761 |
| With companion | 763 (52.7) | 99 (51.6) | — |
| Without companion | 684 (47.3) | 93 (48.4) | — |
| Economic status | — | — | 0.233 |
| A/B | 483 (35.2) | 71 (38.8) | — |
| C | 720 (52.5) | 97 (53.0) | — |
| D/E | 169 (12.3) | 15 (8.2) | — |
| Smoking | — | — | 0.907 |
| Never smoked | 781 (54.0) | 101 (52.6) | — |
| Previous smoker | 483 (33.4) | 65 (33.9) | — |
| Current smoker | 182 (12.6) | 26 (13.5) | — |
| Heart diseases | — | — | 0.818 |
| No | 981 (67.8) | 128 (67.0) | — |
| Yes | 465 (32.2) | 63 (33.0) | — |
| DM | — | — | 0.060 |
| No | 1107 (76.5) | 135 (70.3) | — |
| Yes | 340 (23.5) | 57 (29.7) | — |
| Physical Inactivity | — | — | 0.305 |
| No | 548 (39.9) | 67 (36.0) | — |
| Yes | 824 (60.1) | 119 (64.0) | — |
| Low BMI | — | — | 0.573 |
| No | 126 (9.2) | 15 (8.0) | — |
| Yes | 1238 (90.8) | 173 (92.0) | — |
| 4 m gait speed test | — | — | 0.950 |
| Adequate | 994 (76.2) | 139 (76.0) | — |
| Slow | 311 (23.8) | 44 (24.0) | — |
| Handgrip strength | — | — | 0.909 |
| Adequate | 914 (65.9) | 126 (66.3) | — |
| Low | 473 (34.1) | 64 (33.7) | — |
| Calf circumference | — | — | 0.901 |
| Adequate | 825 (60.3) | 113 (59.8) | — |
| Low | 544 (39.7) | 76 (40.2) | — |
BMI: body mass index; DM: diabetes mellitus
Appendicular skeletal muscle mass index values equal to or less than −1 SD of the young population (7.76 kg/m2 for men and 5.62 kg/m2 for women) were considered low. Figure 2 and Table 2 show all possible CC cut‐off points for identifying low ASMI. The mean (and SD) values for the men and women in the substudy were 8.1 kg/m2 (0.81 kg/m2) and 6.6 kg/m2 (0.7 kg/m2) for ASMI and 35.8 cm (3.15 cm) and 35.8 cm (3.45 cm) for CC, respectively. The cut‐off points to determine low ASMI based on CC were set at ≤ 34 cm for men and ≤ 33 cm for women. These values were then applied to the main study population, categorizing individuals as ‘adequate muscle mass’ or ‘loss of muscle mass’.
Figure 2.
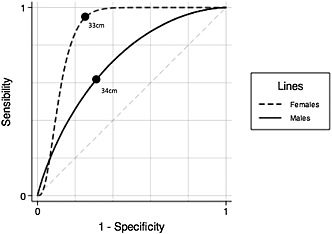
Sex‐stratified receiving operator characteristic curves for appendicular skeletal muscle mass index/calf circumference. Area under the curves: 0.91 (females), 0.76 (males) (N = 189; Pelotas, Brazil; 2014).
Table 2.
Sex‐stratified calf circumference cut‐off points, according to the appendicular skeletal muscle mass index
| CC (cm) | Sensibility (%) | Specificity (%) | MSE (%) |
|---|---|---|---|
| Males | |||
| 31 | 17 | 98 | 69 |
| 32 | 30 | 96 | 49 |
| 33 | 43 | 90 | 33 |
| 34 | 61 | 76 | 21 |
| 35 | 70 | 61 | 24 |
| 36 | 83 | 53 | 25 |
| 37 | 87 | 39 | 39 |
| Females | |||
| 30 | 43 | 95 | 33 |
| 31 | 43 | 93 | 33 |
| 32 | 71 | 87 | 10 |
| 33 | 100 | 76 | 6 |
| 34 | 100 | 70 | 9 |
| 35 | 100 | 59 | 17 |
| 36 | 100 | 40 | 36 |
CC: calf circumference; MSE: maximum sensibility and specificity
The mean (and SD) values of maximum handgrip strength (N = 1387) and CC (N = 1369) in the COMO VAI? study for the men and women were 36.5 kg (9.82 kg) and 21.8 kg (6.55 kg) and 36.1 cm (3.36 cm) and 35.7 cm (3.82 cm), respectively. Combined with the results of the muscular performance assessment, subjects were categorized as normal, pre‐sarcopenic, sarcopenic, or severe sarcopenic.
The overall prevalence of sarcopenia, including sarcopenic and severe sarcopenic subjects, was 13.9% (CI95% 12.0; 15.8%). Figure 3 shows a detailed description of the prevalence of subtypes by gender. The difference between genders reached the significance threshold (p = 0.046).
Figure 3.
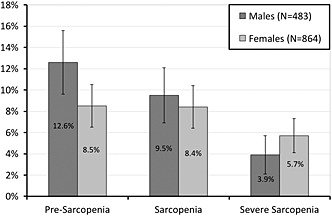
Sarcopenia prevalence in the elderly (60 years or more) of Pelotas, stratified by sex and clinical stages (Pelotas, Brazil; 2014).
Table 3 shows the prevalence of sarcopenia by age group. In the 60 to 69 year age range, there was a higher prevalence of individuals in the preclinical phase of the syndrome, with an increase in the prevalence of sarcopenia and severe sarcopenia among older individuals (p < 0.001).
Table 3.
Age‐stratified sarcopenia prevalence (%) (N=1288)
| Status | 60–69 y | 70–79 y | ≥80 y | Total |
|---|---|---|---|---|
| Normal (N = 979) | 79.8 | 76.9 | 57.1 | 76.0 |
| Pre‐sarcopenia (N = 130) | 11.7 | 8.4 | 7.4 | 10.1 |
| Sarcopenia (N = 114) | 6.7 | 9.6 | 16.2 | 8.8 |
| Severe sarcopenia (N = 65) | 1.8 | 5.1 | 19.3 | 5.1 |
| N (100%) | 712 | 415 | 161 | 1288 |
y, years.
P < 0.001 (χ2, accounting for the design effect).
Table 4 shows the frequency of sarcopenia with respect to the other exposure variables evaluated. There were no significant differences between the different outcome subgroups based on skin colour, presence of heart disease, or DM. However, all other factors analysed did show significant differences, including living without a partner, belonging to a lower economic class, being sedentary, currently or previously smoking, and having low body weight were positively correlated with sarcopenia. Subjects with 0 years of formal study had the highest prevalence of sarcopenia and the most severe classification of the syndrome.
Table 4.
Sarcopenia prevalence according to different variables
| Variable | Total (100%) | Pre‐sarcopenia (%) | Sarcopenia (%) | Severe sarcopenia (%) | P |
|---|---|---|---|---|---|
| Skin colour | — | — | — | — | 0.437 |
| Caucasian | 1082 | 104 (9.6) | 95 (8.8) | 53 (4.8) | — |
| Non‐Caucasian | 207 | 26 (12.6) | 19 (9.2) | 13 (6.3) | — |
| Years of study | — | — | — | — | 0.015* |
| None | 156 | 15 (9.6) | 20 (12.8) | 12 (7.7) | — |
| <8 years | 697 | 65 (9.3) | 61 (8.8) | 41 (5.9) | — |
| ≥8 years | 427 | 49 (11.5) | 32 (7.5) | 11 (2.6) | — |
| Marital status | — | — | — | — | <0.001 |
| With companion | 707 | 69 (9.8) | 53 (7.5) | 20 (2.8) | — |
| Without companion | 582 | 61 (10.5) | 61 (10.5) | 45 (7.7) | — |
| Economic status | — | — | — | — | 0.001* |
| A/B | 429 | 57 (13.3) | 29 (6.8) | 19 (4.4) | — |
| C | 648 | 52 (8.0) | 61 (9.4) | 27 (4.2) | — |
| D/E | 149 | 18 (12.1) | 21 (14.1) | 16 (10.7) | — |
| Smoking | — | — | — | — | 0.043* |
| Never smoked | 692 | 53 (7.7) | 59 (8.5) | 41 (5.9) | — |
| Previous smoker | 429 | 45 (10.5) | 34 (7.9) | 16 (3.7) | — |
| Current smoker | 168 | 32 (19.1) | 21 (12.5) | 8 (4.8) | — |
| Heart diseases | — | — | — | — | 0.129 |
| No | 901 | 97 (10.8) | 88 (9.8) | 42 (4.7) | — |
| Yes | 389 | 33 (8.5) | 26 (6.7) | 23 (5.9) | — |
| DM | — | — | — | — | 0.180 |
| No | 996 | 109 (10.9) | 91 (9.1) | 50 (5.0) | — |
| Yes | 295 | 21 (7.1) | 23 (7.8) | 15 (5.1) | — |
| Physical inactivity | — | — | — | — | <0.001 |
| No | 534 | 74 (13.9) | 39 (7.3) | 13 (2.4) | — |
| Yes | 725 | 51 (7.0) | 73 (10.1) | 50 (6.9) | — |
| Low BMI | — | — | — | — | <0.001 |
| No | 1169 | 96 (8.2) | 69 (5.9) | 40 (3.4) | — |
| Yes | 114 | 34 (29.8) | 44 (38.6) | 25 (21.9) | — |
linear trend test
BMI: body bass index; DM: diabetes mellitus
Discussion
The overall prevalence of sarcopenia found in Pelotas, a medium‐sized city in southern Brazil, was 13.9%. The geographical location of Pelotas makes it representative of South American ethnic heterogeneity, as it is located in a zone marked by the strong presence of German and Italian immigrants as well as the so‐called ‘people from the Pampas Gaúchos’, who are of primarily Uruguayan and Argentine descent. This population diversity allows for the extrapolation of these results to the rest of South America.
The proportion of sarcopenic elderly people in the present study was consistent with our expected results, given that previous studies using similar methodologies and conducted in other locations around the world have reported similar values (ranging from 5.2 to 14.4%).3, 7, 8, 9 Two notable exceptions, perhaps due to differences in methodology, population characteristics or age groups (≥70 and ≥80 years, respectively), were studies performed in Arango‐Lopera5 (prevalence of 33.3% in Mexico City) and Landi6 (29.1% in a rural area in Italy).
Individuals who did not perform all three tests but who underwent the CC measurement and either the walking test or muscle strength assessment—thus confirming the diagnosis of sarcopenia (severe or not)—were considered in a subanalysis. Considering this, the total number of subjects evaluated was 1369 and the number of sarcopenic subjects was 199 (14.5%). This parallel analysis, although it does not follow the guidelines of EWGSOP, demonstrates that the values obtained for the prevalence of sarcopenia using the three test criterion may be underestimated.
In the present study, sarcopenia was categorized according to the three groups suggested by EWGSOP (pre‐sarcopenia, sarcopenia, and severe sarcopenia). In an epidemiological context, such divisions are critical as they permit the identification of a syndrome while still in the preclinical phase, when it is susceptible to intervention prior to the associated systemic repercussions. However, in the same consensus article, EWGSOP also suggests an algorithm for sarcopenia detection in clinical practice that prevents the diagnosis of the pre‐sarcopenic phase. According to the algorithm, if the muscle strength and performance are adequate, the patient is identified as non‐sarcopenic and a muscle mass assessment is not recommended. Although this practice is valid in an outpatient context to spare the patient from expensive tests during the preclinical phase, it is not recommended for population studies. In terms of public health, the preclinical phase is the best time for intervention and represents a target for public policies. Based on the findings in the present study, this preclinical phase of the disease is most prevalent in the age range from 60 to 69 years, making this the primary target population for screening and intervention strategies.
A Brazilian study published in 2013 showed an overall prevalence of 15.4% for sarcopenia in the city of São Paulo, using data collected in 2006.4 São Paulo is a megalopolis of 11.3 million inhabitants, whereas Pelotas is a city of 330 000 inhabitants. Application of the algorithm recommended by EWGSOP in the cited study did not permit for the differentiation of individuals from different sarcopenia subgroups, particularly the preclinical stage, which hampers the comparability between studies. Nevertheless, their findings and our own do complement one another, helping to define the prevalence of sarcopenia in Brazil.
The associations we observed for the evaluated factors add to our knowledge of factors associated with the sarcopenic syndrome. The weak association with gender could perhaps be ignored. However, in the present study, we observed a consistent worsening of sarcopenia with age and a greater prevalence in elderly people with little or no schooling, low economic status, and lacking a partner, as well as in individuals who were smokers and physically inactive. Other studies that attempted to assess the frequency of exposure variables relative to sarcopenia failed to show as many significant associations.4, 8 This discrepancy may be due to the larger sample size in the present study, allowing us more statistical power with which to demonstrate such associations, as well as the relatively low prevalence of the studied outcome in the population. The latter phenomenon tends to increase the number of individuals required to observe significant differences between subgroups.
In the present study, unlike that of Lin et al. in 2013,8 heart disease and DM were not significantly associated with sarcopenia. These findings may have been influenced by the data collection method, which was self‐reported and subject to survival bias. Further studies on this issue will be needed to define the relationship between these diseases and sarcopenia.
If we adopted the EWGSOP recommendation of a cut‐off value of −2 SD below the young local population for low ASMI, none of the substudy participants would exhibit low muscle mass. Considering the prevalence of sarcopenia in other populations and that the data obtained here comes from a developing country, this hypothesis does not appear plausible. A more likely explanation for the relatively small difference between the ASMI values for the young and old people in this population is that, despite residing in the same geographical location, the two age groups represent two very different lifestyles. In other words, the lifestyle of these elderly people when they were young may have been quite different from the lifestyle of current young people from the same city, despite the fact that the populations were representative and the ASMI measures were obtained using the same equipment. This hypothesis would predict a cohort effect that could explain questionable values for calculating muscle mass loss associated with age among these groups. Indeed, previous studies are consistent with this hypothesis. For example, Goodman23 and Coin24 also showed a smaller than the expected difference between the young and elderly populations they evaluated, and they considered the adoption of the −1 SD criterion for loss of lean mass. In this way, we justify using a −1 SD cut‐off value relative to the reference young population to determine low ASMI in the elderly, in contrast to the EWGSOP recommendation.
Concerning the loss of muscle mass associated with age, the cut‐off values established for CC in the present study are noteworthy. In a study conducted with French elderly women aged 70 years or more, Lauretani16 defined 31 cm as the cut‐off point for loss of muscle mass for both genders. The adoption of different cut‐off points for CC for different populations has been previously considered and evaluated25 and has even been suggested by EWGSOP.2 In the present study, this analysis was performed again considering gender differences and including a population of individuals aged 60 years or older, which in our view is more suitable for establishing cut‐off points for the studied population. We believe that the adoption of a 34 cm cut‐off point for men and a 33 cm cut‐off point for women to identify the loss of lean mass better reflects reality, considering the mean CC of the studied population. Nevertheless, we suggest the adoption of specific values using studies in similar populations.
As positive aspects of the present study, we highlight the quality of the sampling method, which was random and representative of the population. We also collected body composition data using DXA in a young reference population, which was used to establish the cut‐off points for elderly individuals in the same demographic context. The sample size was also large enough to perform studies on the prevalence of sarcopenia and associated factors. Finally, it may be possible to extrapolate our findings to other medium‐ and small‐sized cities, which represent the vast majority of cities in Brazil and Latin America—thereby filling an important gap in our current knowledge about the prevalence of sarcopenia in this region.
We also note some potential biases. The first is the somewhat controversial use of the −1 SD cut‐off point for the loss of appendicular lean mass, as detailed earlier. Another factor relates to the design of the study, which, being cross‐sectional, only allowed us to establish association hypotheses and not causal relationships between the associated factors, in order to avoid reverse causality. Survival bias should also be considered, as relatively fewer severely affected individuals may have been found because of deaths related to the syndrome. In addition, bedridden or debilitated individuals could not participate in the present study because of the exclusion criteria we adopted. Therefore, the estimated prevalence is likely underestimated, as the diagnostic criteria adopted do not permit assessing sarcopenia in these individuals. Finally, the impracticality of using more precise measurement methods, such as DXA, for the entire study population must also be considered. Unfortunately, as this was a population study in a middle‐income country with budgetary limitations, we were limited to a low‐cost method—CC measurement—to determine muscle mass in elderly subjects. Although this method is not an ideal anthropometric measurement technique, it is simple to perform, and it can be suitable for large‐scale population studies when combined with other ‘gold standard’ methods, as in our substudy.
In conclusion, we believe that the estimated prevalence of sarcopenia in this population helps fill an important gap in the ‘global map’ of sarcopenia. We have overcome significant obstacles inherent to large‐scale population studies and identified important correlations in this population. Population subgroups at high risk for the syndrome were identified, highlighting the fact that this disease is common in both genders. Approximately 1 in 10 elderly people in the ages between 60 years and 69 years are in the preclinical phase of sarcopenia, which should influence public policies to treat the elderly before the clinical phase sets in.
Conflict of interest
None declared.
Acknowledgements
The authors would like to thank Dr Iná da Silva dos Santos and Dr Carla Helena Augustin Schwanke for their collaboration in the paper revision; the research granting agencies CAPES (Coordenação de Aperfeiçoamento de Pessoal de Nível Superior) and FAPERGS (Fundação de Amparo à Pesquisa do Estado do Rio Grande do Sul), who partially funded this study; and, finally, all the colleagues who collaborated on the COMO VAI? study. The authors certify that they have complied with the ethical guidelines for authorship and publishing in the Journal of Cachexia, Sarcopenia and Muscle 2010, 1:7–8 (von Haeling S, Morley J. E., Coats A. J., and Anker S. D.). This study was approved by the appropriate ethics comitee (Faculdade de Medicina da Universidade Federal de Pelotas, Pelotas, Brazil) and has therefore been performed in accordance with the ethical standards laid down in the 1964 Declaration of Helsinki and its later amendments.
Barbosa‐Silva, T. G. , Bielemann, R. M. , Gonzalez, M. C. , and Menezes, A. M. B. (2016) Prevalence of sarcopenia among community‐dwelling elderly of a medium‐sized South American city: results of the COMO VAI? study. Journal of Cachexia, Sarcopenia and Muscle, 7: 136–143. doi: 10.1007/jcsm.12049.
References
- 1. Rosenberg IH. Summary comments. Am J Clin Nutr 1989; 50: 1231–1233. [Google Scholar]
- 2. Cruz‐Jentoft AJ, Baeyens JP, Bauer JM, Boirie Y, Cederholm T, Landi F, et al. Sarcopenia: European consensus on definition and diagnosis: report of the European Working Group on Sarcopenia in Older People. Age Ageing 2010; 39: 412–423. [DOI] [PMC free article] [PubMed] [Google Scholar]
- 3. van Abellan Kan G, Cesari M, Gillette‐Guyonnet S, Dupuy C, Nourhashemi F, Schott AM, et al. Sarcopenia and cognitive impairment in elderly women: results from the EPIDOS cohort. Age Ageing 2013; 42: 196–202. [DOI] [PubMed] [Google Scholar]
- 4. Alexandre Tda S, Duarte YA, Santos JL, Wong R, Lebrao ML. Prevalence and associated factors of sarcopenia among elderly in Brazil: findings from the SABE study. J Nutr Health Aging 2014; 18: 284–290. [DOI] [PubMed] [Google Scholar]
- 5. Arango‐Lopera VE, Arroyo P, Gutierrez‐Robledo LM, Perez‐Zepeda MU. Prevalence of sarcopenia in Mexico City. Eur Geriatr Med 2012; 3: 157–160. [Google Scholar]
- 6. ILandi F, Liperoti R, Russo A, Giovannini S, Tosato M, Barillaro C, et al. Association of anorexia with sarcopenia in a community‐dwelling elderly population: results from the ilSIRENTE study. Eur J Nutr 2013; 52: 1261–1268. [DOI] [PubMed] [Google Scholar]
- 7. ILee WJ, Liu LK, Peng LN, Lin MH, Chen LK. Comparisons of sarcopenia defined by IWGS and EWGSOP criteria among older people: results from the I‐Lan longitudinal aging study. J Am Med Dir Assoc 2013; 14: 528 e1–7. [DOI] [PubMed] [Google Scholar]
- 8. Lin CC, Lin WY, Meng NH, Li CI, Liu CS, Lin CH, et al. Sarcopenia prevalence and associated factors in an elderly Taiwanese metropolitan population. J Am Geriatr Soc 2013; 61: 459–462. [DOI] [PubMed] [Google Scholar]
- 9. Patel HP, Syddall HE, Jameson K, Robinson S, Denison H, Roberts HC, et al. Prevalence of sarcopenia in community‐dwelling older people in the UK using the European Working Group on Sarcopenia in Older People (EWGSOP) definition: findings from the Hertfordshire Cohort Study (HCS). Age Ageing 2013; 42: 378–384. [DOI] [PMC free article] [PubMed] [Google Scholar]
- 10. Instituto Brasileiro de Geografia e Estatística (IBGE) . Dados referentes ao município de Pelotas. 2014. http://cidades.ibge.gov.br/painel/painel.php?codmun=431440. Accessed Nov. 1st, 2014.
- 11. Barros AJD, Menezes AMB, Santos IS, Assunção MCF, Gigante D, Fassa AG, et al. O Mestrado do Programa de Pós‐Graduação em epidemiologia da UFPel baseado em consórcio de pesquisa: Uma experiência inovadora. Rev Bras Epidemiol 2008; 11: 133–144. [Google Scholar]
- 12. Instituto Brasileiro de Geografia e Estatística (IBGE) . Censo 2010. 2010. http://www.censo2010.ibge.gov.br. Accessed July 2nd, 2013.
- 13. ILohman TG, Roche AF, Martorell R. Anthropometric Standardization Reference Manual, 1st ed. USA: Human Kinetics Books; 1988. [Google Scholar]
- 14. Victora CG, Barros FC. Cohort profile: the 1982 Pelotas (Brazil) birth cohort study. Int J Epidemiol 2006; 35: 237–242. [DOI] [PubMed] [Google Scholar]
- 15. Roberts HC, Denison HJ, Martin HJ, Patel HP, Syddall H, Cooper C, et al. A review of the measurement of grip strength in clinical and epidemiological studies: towards a standardised approach. Age Ageing 2011; 40: 423–429. [DOI] [PubMed] [Google Scholar]
- 16. Lauretani F, Russo CR, Bandinelli S, Bartali B, Cavazzini C, Di Iorio A, et al. Age‐associated changes in skeletal muscles and their effect on mobility: an operational diagnosis of sarcopenia. J Appl Physiol 2003; 95: 1851–1860. [DOI] [PubMed] [Google Scholar]
- 17. Chumlea WC, Guo S. Equations for predicting stature in white and black elderly individuals. J Gerontol 1992; 47: M197–203. [DOI] [PubMed] [Google Scholar]
- 18. Lipschitz DA. Screening for nutritional status in the elderly. Prim Care 1994; 21: 55–67. [PubMed] [Google Scholar]
- 19. Associação Brasileira de Empresas de Pesquisa (ABEP) . Alterações na aplicação do Critério Brasil, válidas a partir de 2013: 2013. http://www.abep.org/novo/Content.aspx?ContentID=835. Accessed Sep. 5th, 2013. [Google Scholar]
- 20. Craig CL, Marshall AL, Sjostrom M, Bauman AE, Booth ML, Ainsworth BE, et al. International physical activity questionnaire: 12‐country reliability and validity. Med Sci Sports Exerc 2003; 35: 1381–1395. [DOI] [PubMed] [Google Scholar]
- 21. Buchner DM, Bishop J, Brown DR, Fulton JE, Galuska DA, Gilchrist J, et al. 2008 physical activity guidelines for Americans. 2008. www.health.gov/paguidelines. Accessed Nov. 2nd, 2014.
- 22. Akobeng AK. Understanding diagnostic tests 1: sensitivity, specificity and predictive values. Acta Paediatr 2007; 96: 338–341. [DOI] [PubMed] [Google Scholar]
- 23. Goodman MJ, Ghate SR, Mavros P, Sen S, Marcus RL, Joy E, et al. Development of a practical screening tool to predict low muscle mass using NHANES 1999–2004. J Cachexia Sarcopenia Muscle 2013; 4: 187–197. [DOI] [PMC free article] [PubMed] [Google Scholar]
- 24. Coin A, Sarti S, Ruggiero E, Giannini S, Pedrazzoni M, Minisola S, et al. Prevalence of sarcopenia based on different diagnostic criteria using DEXA and appendicular skeletal muscle mass reference values in an Italian population aged 20 to 80. J Am Med Dir Assoc 2013; 14: 507–512. [DOI] [PubMed] [Google Scholar]
- 25. Kawakami R, Murakami H, Sanada K, Tanaka N, Sawada SS, Tabata I, et al. Calf circumference as a surrogate marker of muscle mass for diagnosing sarcopenia in Japanese men and women. Geriatr Gerontol Int 2014;doi:10.1111/ggi.12377. [DOI] [PubMed] [Google Scholar]