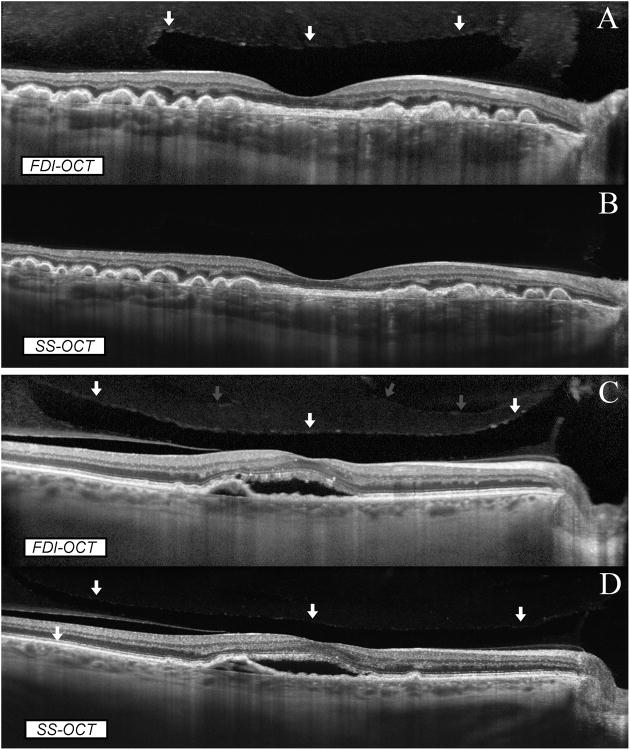
Figure 2.
Comparison between FDI SD-OCT and SS-OCT in full-depth visualization of posterior ocular structures. In an eye with dry AMD (A, B), both imaging modalities showed the full thickness of the retina and choroid. However, the premacular bursa was detected only on SD-OCT imaging (A; the arrows indicate the anterior border of the bursa) whilst it was not imaged by the SS-OCT (B). In an eye with wet AMD (C, D), both imaging modalities showed the full thickness of the retina and choroid. The anterior border of the premacular bursa was clearly seen on SD-OCT imaging (C, white arrows) whilst it was only barely seen on SS-OCT imaging (D, white arrows). In addition, SD-OCT imaging showed a more anterior vitreoschisis (C, grey arrows) that was missed on SS-OCT imaging (D).

