

Abstract
Background
Sarcopenia is a risk‐factor for all‐cause mortality among older adults, but it is unknown if sarcopenia predisposes older adults to specific causes of death. Further, it is unknown if the prognostic role of sarcopenia differs between males and females, and obese and non‐obese individuals.
Methods
A population‐based cohort study among 4425 older adults from the Third National Health and Nutrition Survey (1988–1994). Muscle mass was quantified using bioimpedance analysis, and muscle function was quantified using gait speed. Multivariable‐adjusted Cox regression analysis examined the relationship between sarcopenia and mortality outcomes.
Results
The mean age of study participants was 70.1 years. The prevalence of sarcopenia was 36.5%. Sarcopenia associated with an increased risk of all‐cause mortality [hazard ratio (HR): 1.29 (95% confidence interval (95% CI): 1.13–1.47); P < 0.001] among males and females. Sarcopenia associated with an increased risk of cardiovascular‐specific mortality among females [HR: 1.61 (95% CI: 1.22–2.12); P = 0.001], but not among males [HR: 1.07 (95% CI: 0.81–1.40; P = .643); P interaction = 0.079]. Sarcopenia was not associated with cancer‐specific mortality among males and females [HR: 1.07 (95% CI: 0.78–1.89); P = 0.672]. Sarcopenia associated with an increased risk of mortality from other causes (i.e. non‐cardiovascular and non‐cancer) among males and females [HR: 1.32 (95% CI: 1.07–1.62); P = 0.008]. Obesity, defined using body mass index (P interaction = 0.817) or waist circumference (P interaction = 0.219) did not modify the relationship between sarcopenia and all‐cause mortality.
Conclusions
Sarcopenia is a prevalent syndrome that is associated with premature mortality among community‐dwelling older adults. The prognostic value of sarcopenia may vary by cause‐specific mortality and differ between males and females.
Keywords: Skeletal muscle, Body composition, Gait speed, Obesity, Population based, Cohort study
Introduction
One of the most important changes related to ageing is the loss of muscle mass and muscle strength. Older adults lose approximately 1% of muscle mass and 3% of muscle strength each year.1 Sarcopenia is recognized as a geriatric syndrome characterized by critically low levels of muscle mass and muscle strength or muscle performance that predisposes individuals to adverse health outcomes.2, 3 This contemporary definition of sarcopenia evolved from a singular focus on muscle mass to a collective focus on muscle mass and muscle function,2, 3 given emerging evidence that muscle strength and muscle performance may contribute to health,4, 5, 6 independent of muscle mass.
Several studies have examined the relationship between low muscle mass and mortality among older adults.7, 8, 9, 10, 11, 12, 13 However, few studies have operationalized the definition of sarcopenia to include low muscle strength or muscle performance, in addition to low muscle mass.14, 15, 16 Studies conducted to date have used regression‐based anthropometric methods to estimate muscle mass,14, 15, 16 which may be vulnerable to error and have been discouraged from use in the assessment of sarcopenia.2 Many studies investigating the relationship between sarcopenia and mortality have examined all‐cause mortality. It is unknown if sarcopenia predisposes older adults to specific causes of death. It is also unknown if the relationship between sarcopenia and mortality differs between population subgroups, such as males and females,17 and obese and non‐obese individuals.18, 19 These subgroups may have important differences in muscle mass and muscle function, which may influence the risk of developing sarcopenia and subsequent risk of mortality.20
This study sought to determine if sarcopenia, defined using objective measures of muscle mass and muscle function, predicts all‐cause, cardiovascular‐specific, cancer‐specific, and other causes of premature mortality among a population‐based sample of 4425 older adults aged ≥60 years with a median of 14.4 years of follow‐up. We further aimed to determine if the relationship between sarcopenia and mortality varied between subgroups including males and females, and obese and non‐obese individuals.
Methods
Study population and design
The Third National Health and Nutrition Examination Survey, 1988–1994 (NHANES III) was a stratified multistage study conducted by the National Center for Health Statistics—Centers for Disease Control and Prevention, to provide health information on a nationally‐representative sample of U.S. civilians.21 The NHANES III sample does not include persons residing in nursing homes, members of the armed forces, institutionalized persons, or US nationals living abroad. Participants provided written informed consent prior to completing any study‐related activities. Participants in this analysis included adults of age ≥60 years with the requisite study measures necessary to define sarcopenia, as described below.
Definition of sarcopenia
Sarcopenia was operationalized using gait speed as a measure of muscle function and bioimpedance analysis (BIA) as a measure of muscle mass.2, 3
Gait speed was assessed using a 4 m walk. Participants completed two walks, and the faster of the two trials were used in this analysis. Gait speed was calculated as the quotient of 4 m and time (in seconds) required for the walk and expressed as metres per second (m/s). Participants with a gait speed ≤0.8 m/s were considered to have a slow gait. Gait speed ≤0.8 m/s is associated with adverse health outcomes,22 and is recommended to identify sarcopenia.2
BIA was assessed using a bioresistance body composition analyser (Valhalla 1990B, Valhalla Medical, San Diego, California).23 Whole‐body BIA measurements were obtained between the right wrist and ankle while lying in the supine position.23, 24 All subjects were fasted for a minimum of 6 h. Muscle mass was calculated using a validated equation, where skeletal muscle mass (in kilogrammes) equals: [(height2 / BIA resistance × 0.401) + (gender × 3.825) + (age × −0.071)] + 5.102, where height is reported in centimetres; BIA resistance is reported in ohms; gender is equal to 1 for men and 0 for women; and age is reported in years.25 This equation is correlated with muscle mass quantified using magnetic resonance imaging (r = 0.93).25 The skeletal muscle index (SMI) is the absolute muscle mass (kg) indexed for height2 (in metres).23 Men with an SMI <10.76 kg/m2 and women with an SMI <6.75 kg/m2 were defined to have low muscle mass. These SMI thresholds are associated with an increased risk of disability,23 and are recommended to identify sarcopenia.2
Participants with slow gait speed (≤0.8 m/s) and low muscle mass (SMI <10.76 kg/m2 for men and <6.75 kg/m2 for women) were classified as having sarcopenia.2 All other participants were classified as not having sarcopenia.
Mortality outcome
Vital status and cause of death were identified using the National Death Index (NDI) database through 31 December 2006. Participants were linked to the NDI database using probabilistic matching that included 12 identifiers such as Social Security number, sex, and date of birth.26 The National Center for Health Statistics found that 96.1% of deceased participants and 99.4% of living participants were correctly classified using the probabilistic matching algorithm.27 Cause of death was categorized using the International Classification of Diseases 10th edition (ICD‐10).28 Cardiovascular‐specific mortality was categorized using ICD‐10 codes I00–I078. Cancer‐specific mortality was categorized using ICD‐10 codes C00–C97. Mortality from other causes included deaths not classified as cardiovascular‐specific or cancer‐specific. The National Center for Health Statistics removed select subject characteristics in the file to prevent re‐identification of study participants. The publically released survival data are nearly identical to the restricted‐use NHANES III mortality‐linked file.29
Covariates
Demographic information including date of birth, sex, race, and education were self‐reported using a standardized questionnaire.30 Height (metres), body mass (kilogrammes), and waist circumference (centimetres) were measured by study technicians. Body mass index (BMI) was calculated as body mass divided by the square of height (kg/m2). Behavioural and clinical information including smoking status, hospitalization in the prior year, and self‐rated health were self‐reported using a standardized questionnaire.30 The healthy eating index was calculated from 24 h food recalls to form a score than ranges from 0 to 100 to quantify aspects of a healthy diet.31 Bouts of walking in the past week were self‐reported and included any bout that was estimated to be ≥1 mile in duration, and of moderate or vigorous intensity. The presence of comorbid health conditions was self‐reported by asking participants if a doctor had ever told them that they had any of the following: hypertension, diabetes, hyperlipidemia, asthma, arthritis, myocardial infarction, stroke, or congestive heart failure. Albumin, c‐reactive protein, glycated haemoglobin, insulin, glucose, and creatinine were quantified using standardized laboratory assay procedures that have been described in detail.32, 33
Statistical analysis
The primary outcome was all‐cause mortality. Secondary outcomes included cardiovascular‐specific mortality, cancer‐specific mortality, and mortality from other causes. Continuous variables are presented as means (standard error), and categorical variables are presented as percentages (%). We used Cox proportional hazards regression models to estimate the hazard ratio [HR] and 95% confidence interval [95% CI] of sarcopenia and mortality. Models were estimated unadjusted (model 1), adjusted for sex and age (model 2), and fully adjusted for demographic, behavioural, and clinical characteristics (model 3).
The primary subgroup of interest was sex (males vs. females). The exploratory subgroup was obesity defined two ways: using BMI as a measure of general obesity [obese (BMI ≥30 kg/m2) vs. non‐obese (BMI < 30 kg/m2)]; and using waist circumference as a measure of abdominal obesity [obese (waist circumference >88 cm for women and >102 cm men) vs. non‐obese (waist circumference ≤88 cm for women and ≤102 cm men)].34 To determine if the relationship between sarcopenia and mortality differed between subgroups we included a statistical interaction term in the Cox proportional hazards regression models. Subgroup‐stratified analyses are presented to facilitate interpretation. As a result of the small proportion of obese (defined using either BMI or waist circumferences) persons with sarcopenia, we only examined the outcome of all‐cause mortality in the obesity subgroups. Because of the known limitations in statistical power when examining interactions,35 the threshold for statistical significance for interactions was P < 0.10 and the threshold for statistical significance for all other analyses was P < 0.05. All statistical analyses incorporated sample weights to account for nonresponse bias, multistage sampling probabilities, and the subpopulation of participants included in this analytic sample.36 Stata/SE v.13.1 statistical software was used for all analyses.
Results
Sarcopenia characteristics
The average age of study participants was 70.1 years old (95% CI: 69.8–70.3). Average skeletal muscle mass was 22.9 kg (95% CI: 22.6–23.2), SMI was 8.3 kg/m2 (95% CI: 8.2–8.3), and gait speed was 0.79 m/s (95% CI: 0.78–0.80). Age correlated with skeletal muscle mass (r = −0.20; P < 0.001), SMI (r = −0.17; P < 0.001), and gait speed (r = −0.33; P < 0.001). Gait speed correlated with skeletal muscle mass (r = 0.19; P < 0.001), and SMI (r = 0.13; P < 0.001).
Among 4425 older adults, we identified 2717 individuals with slow gait speed, of whom 1618 also had a low SMI (Figure 1). The overall prevalence of sarcopenia was 36.5%.
Figure 1.
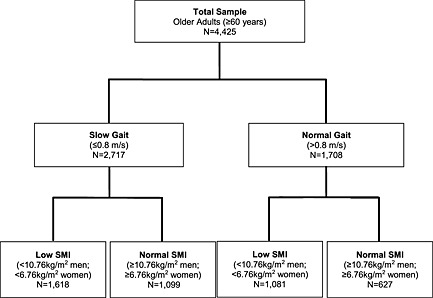
Study participant flow using sarcopenia identification algorithm. SMI: skeletal muscle index.
Baseline characteristics associated with sarcopenia
Characteristics of study participants are shown overall and stratified by sarcopenia status (Table 1).
Table 1.
Characteristics of study participants, overall and stratified by sarcopenia statusa
| Characteristic | Overall (N = 4425) | Distribution of sarcopenia | P | |
|---|---|---|---|---|
| [mean (SE) or (%)] | Sarcopenia (N = 1618) | No sarcopenia (N = 2807) | ||
| Age, yrs | 70.1 (0.14) | 73.1 (0.28) | 68.9 (0.15) | <.001 |
| Sex, % | ||||
| Male | 43.5 | 53.3 | 39.4 | <.001 |
| Female | 56.5 | 46.7 | 60.6 | |
| Race, % | .053 | |||
| White | 89.5 | 87.3 | 90.4 | |
| Black | 8.3 | 9.7 | 7.7 | |
| Other | 2.2 | 3.0 | 1.9 | |
| Education, years | ||||
| ≤8 | 23.9 | 33.9 | 19.7 | <.001 |
| 9–11 | 16.7 | 16.2 | 16.9 | |
| 12 | 31.3 | 29.7 | 33.2 | |
| ≥13 | 28.1 | 23.2 | 30.1 | |
| Body mass, kg | 73.7 (0.34) | 67.9 (0.56) | 76.1 (0.41) | <.001 |
| Body mass index, kg/m2 | ||||
| Continuous (mean) | 27.0 (0.10) | 24.7 (0.14) | 27.9 (0.13) | <.001 |
| <18.5 | 2.0 | 4.3 | 1.0 | <.001 |
| 18.5–24.9 | 3.5 | 48.4 | 28.8 | |
| 25.0–29.9 | 39.8 | 37.7 | 40.6 | |
| ≥30 | 23.7 | 9.6 | 29.6 | |
| Waist circumference, cm | ||||
| Continuous (mean) | 96.9 (0.28) | 93.6 (0.47) | 98.3 (0.34) | <.001 |
| ≤88 (women), ≤102 (men) | 42.1 | 54.5 | 37.0 | <.001 |
| >88 (women), >102 (men) | 57.9 | 45.5 | 63.0 | |
| Skeletal muscle mass, kg | 22.9 (0.15) | 21.6 (0.25) | 23.5 (0.18) | <.001 |
| Skeletal muscle index, kg/m2 | 8.3 (0.04) | 7.8 (0.06) | 8.5 (0.05) | <.001 |
| Smoking status, % | ||||
| Never | 44.2 | 38.7 | 46.5 | <.001 |
| Former | 40.5 | 41.2 | 40.2 | |
| Current | 15.3 | 20.1 | 13.3 | |
| Comorbid health conditions, % | ||||
| Hypertension | 44.7 | 41.7 | 46.0 | .053 |
| Diabetes | 12.2 | 10.0 | 13.1 | .024 |
| Hyperlipidemia | 40.9 | 37.1 | 42.3 | .047 |
| Asthma | 7.2 | 7.4 | 7.1 | .843 |
| Cancer | 8.7 | 11.1 | 7.7 | .006 |
| Arthritis | 44.0 | 45.2 | 43.4 | .440 |
| Heart attack | 10.7 | 13.0 | 9.7 | .014 |
| Stroke | 5.6 | 6.8 | 5.1 | .055 |
| Heart failure | 6.0 | 6.9 | 5.6 | .188 |
| Hospitalization, % | 16.1 | 17.3 | 15.6 | .276 |
| Self‐rated health, % | ||||
| Excellent | 14.1 | 9.3 | 16.0 | <.001 |
| Very Good | 27.7 | 22.7 | 25.5 | |
| Good | 34.3 | 35.0 | 34.1 | |
| Fair | 20.2 | 23.3 | 19.0 | |
| Poor | 6.7 | 9.7 | 5.4 | |
| Healthy eating index | 68.3 (0.29) | 66.8 (0.53) | 69.0 (0.34) | .001 |
| Albumin, g/dL | 4.0 (0.007) | 4.1 (0.012) | 4.0 (0.008) | .304 |
| C‐reactive protein, mg/dL | 0.5 (0.02) | 0.6 (0.03) | 0.5 (0.02) | .170 |
| Glycated haemoglobin, % | 5.8 (0.02) | 5.7 (0.04) | 5.8 (0.03) | .275 |
| Insulin, pmol/Lb | 4.1 (0.01) | 4.0 (0.02) | 4.1 (0.02) | <.001 |
| Glucose, mmol/Lb | 1.8 (0.005) | 1.7 (0.008) | 1.8 (0.006) | .310 |
| HOMA‐insulin resistanceb | 0.9 (0.02) | 0.8 (0.03) | 1.0 (0.02) | <.001 |
| Creatinine, mg/dL | 1.1 (0.006) | 1.2 (0.01) | 1.1 (0.007) | <.001 |
| Weekly walking, (bouts/wk) | ||||
| 0 | 66.7 | 75.8 | 62.9 | <.001 |
| 1–3 | 11.3 | 7.9 | 12.7 | |
| ≥3 | 22.0 | 16.3 | 24.4 | |
| Gait speed, m/s | 0.8 (0.005) | 0.6 (0.006) | 0.9 (0.005) | <.001 |
Values are means (standard error) or column percentages (%).
Variables were log‐transformed for normality.
Sarcopenia and mortality among all participants
During a median 14.4 year follow‐up period we observed 2683 deaths from all‐causes (60% of the total cohort). The median survival among subjects without sarcopenia was 16.3 years as compared with 10.3 years among subjects with sarcopenia (P < 0.001; Figure 2). In a multivariable‐adjusted regression model, sarcopenia associated with an increased risk of all‐cause mortality [HR: 1.29 (95% CI: 1.13–1.47); P < 0.001; (Table 2)].
Figure 2.
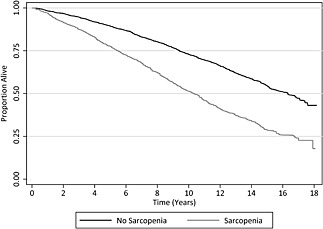
Survival of study participants, stratified by sarcopenia status.
Table 2.
Association between sarcopenia and mortality among all participants, and stratified by sex
| Mortality outcome | Hazard ratio (95% confidence interval) | |||||
|---|---|---|---|---|---|---|
| Model 1a | P | Model 2b | P | Model 3c | P | |
| All‐cause mortality | ||||||
| All participants | 2.03 (1.81–2.28) | <.001 | 1.40 (1.25–1.57) | <.001 | 1.29 (1.13–1.47) | <.001 |
| Sex‐specific strata | ||||||
| Males | 1.91 (1.63–2.24) | <.001 | 1.42 (1.21–1.67) | <.001 | 1.21 (1.01–1.44) | .039 |
| Females | 2.04 (1.72–2.42) | <.001 | 1.37 (1.17–1.61) | <.001 | 1.42 (1.17–1.72) | <.001 |
| Cardiovascular‐specific mortality | ||||||
| All participants | 2.19 (1.86–2.58) | <.001 | 1.42 (1.20–1.68) | <.001 | 1.34 (1.10–1.63) | .003 |
| Sex‐specific strata | ||||||
| Males | 1.76 (1.39–2.23) | <.001 | 1.25 (0.98–1.60) | .071 | 1.07 (0.81–1.40) | .643 |
| Females | 2.58 (2.05–3.23) | <.001 | 1.60 (1.27–2.00) | <.001 | 1.61 (1.22–2.12) | .001 |
| Cancer‐specific mortality | ||||||
| All participants | 1.46 (1.11–1.92) | .007 | 1.03 (0.77–1.37) | .832 | 1.07 (0.78–1.48) | .672 |
| Sex‐specific strata | ||||||
| Males | 1.58 (1.11–2.24) | .010 | 1.16 (0.81–1.67) | .415 | 1.23 (0.81–1.89) | .336 |
| Females | 1.12 (0.69–1.82) | .633 | 0.86 (0.52–1.41) | .539 | 0.85 (0.48–1.50) | .571 |
| Other causes of mortality | ||||||
| All participants | 2.10 (1.76–2.51) | <.001 | 1.54 (1.27–1.85) | <.001 | 1.32 (1.07–1.62) | .008 |
| Sex‐specific strata | ||||||
| Males | 2.26 (1.77–2.90) | <.001 | 1.78 (1.36–2.33) | <.001 | 1.39 (1.05–1.84) | .022 |
| Females | 1.84 (1.41–2.41) | <.001 | 1.32 (1.01–1.72) | .043 | 1.44 (1.04–2.00) | .026 |
Model 1 is unadjusted (crude).
Model 2 is adjusted for age and sex (except in sex‐specific strata).
Model 3 is adjusted for age, sex (except in sex‐specific strata), race, education, body mass index, waist circumference, smoking status, hypertension, diabetes, hyperlipidemia, asthma, cancer, arthritis, heart attack, stroke, and heart failure, hospitalization, self‐rated health, healthy eating index, albumin, c‐reactive protein, glycated haemoglobin, insulin (log‐transformed), glucose (log‐transformed), creatinine, and weekly bouts of walking.
We observed 1241 deaths from cardiovascular causes, 409 deaths from cancer causes, and 1033 deaths from other causes. In a multivariable‐adjusted regression model, sarcopenia associated with cardiovascular‐specific mortality [HR: 1.34 (95% CI: 1.10–1.63); P = 0.003], and other cause mortality [HR: 1.32 (95% CI: 1.07–1.62); P = 0.008], but not cancer‐specific mortality [HR: 1.07 (95% CI: 0.78–1.48); P = 0.672; (Table 2)].
Subgroups
Males and females
Males and females differed in their skeletal muscle mass (29.6 vs. 17.8 kg; P < 0.001), SMI (9.9 vs. 7.1 kg/m2; P < 0.001), and gait speed (0.83 vs. 0.76 m/s; P < 0.001), respectively. The prevalence of sarcopenia was higher among males than females (35.9% vs. 24.2%; P < 0.001).
In multivariable‐adjusted regression models, sex did not modify the relationship between sarcopenia and all‐cause mortality (P interaction = 0.552), cancer‐specific mortality (P interaction = 0.238), or mortality from other causes (P interaction = 0.637). Sex modified the relationship between sarcopenia and cardiovascular‐specific mortality (P interaction = 0.079), such that females with sarcopenia were more likely to die from cardiovascular causes [HR: 1.61 (95% CI: 1.22–2.12); P = 0.001; (Table 2)], but sarcopenic males were not [HR: 1.07 (95% CI: 0.81–1.40); P = 0.643].
Obese vs. non‐obese
Obese individuals (BMI‐defined) differed from non‐obese individuals in their skeletal muscle mass (25.4 vs. 22.2 kg; P < 0.001), SMI (9.2 vs. 8.0 kg/m2; P < 0.001), and gait speed (0.76 vs. 0.81 m/s; P < 0.001), respectively. BMI as a continuous variable associated with skeletal muscle mass (r = 0.31; P < 0.001), SMI (r = 0.43; P < 0.001), and gait speed (r = −0.08; P = 0.001). The prevalence of sarcopenia was lower among obese subjects compared with non‐obese subjects (34.7% vs. 11.8%; P < 0.001). Subjects with abdominal obesity (waist circumference‐defined) differed from those without abdominal obesity in their skeletal muscle mass (23.2 vs. 22.6 kg; P = 0.047), SMI (8.4 vs. 8.1 kg/m2; P = 0.001), and gait speed (0.78 vs. 0.82 m/s; P < 0.001), respectively. Waist circumference as a continuous variable associated with skeletal muscle mass (r = 0.49; P < 0.001), SMI (r = 0.52; P < 0.001), and gait speed (r = −0.06; P = 0.004). The prevalence of sarcopenia was lower among participants with abdominal obesity compared with those without abdominal obesity (37.8% vs. 22.9%; P < 0.001). Estimates of the prognostic importance of sarcopenia for all‐cause mortality were similar across obesity subgroups (Table 3; Figure 3). In the fully multivariable‐adjusted regression model, the relationship between sarcopenia and all‐cause mortality was not modified by general obesity (P interaction = 0.817) or abdominal obesity (P interaction = 0.219).
Table 3.
Association between sarcopenia and all‐cause mortality, stratified by obesity status
| Obesity strata | Hazard ratio (95% confidence interval) | |||||
|---|---|---|---|---|---|---|
| Model 1a | P | Model 2b | P | Model 3c | P | |
| General obesity (body mass index) | ||||||
| Non‐obese | 2.08 (1.83–2.37) | <.001 | 1.46 (1.29–1.65) | <.001 | 1.29 (1.13–1.48) | <.001 |
| Obese | 1.76 (1.31–2.37) | <.001 | 1.28 (0.93–1.76) | .124 | 1.29 (0.88–1.89) | .197 |
| Abdominal obesity (waist circumference) | ||||||
| Non‐obese | 2.07 (1.74–2.47) | <.001 | 1.44 (1.21–1.71) | <.001 | 1.20 (1.01–1.45) | .044 |
| Obese | 1.96 (1.66–2.31) | <.001 | 1.39 (1.19–1.62) | <.001 | 1.45 (1.22–1.72) | <.001 |
Model 1 is unadjusted (crude).
Model 2 is adjusted for age and sex.
Model 3 is adjusted for age, sex, race, education, smoking status, hypertension, diabetes, hyperlipidemia, asthma, cancer, arthritis, heart attack, stroke, and heart failure, hospitalization, self‐rated health, healthy eating index, albumin, c‐reactive protein, glycated haemoglobin, insulin (log‐transformed), glucose (log‐transformed), creatinine, and weekly bouts of walking.
Figure 3.
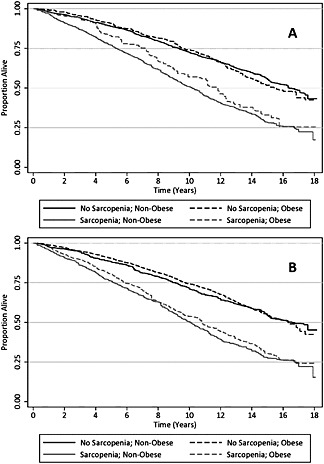
Survival of study participants, stratified by sarcopenia status and obesity, with obesity defined using: A) body mass index; and B) waist circumference.
Discussion
The prevalence of sarcopenia in this population‐based sample of community‐dwelling older adults was 36.5%. The presence of sarcopenia associated with an increased risk of all‐cause mortality, cardiovascular‐specific mortality, and mortality from other causes. Sarcopenia was not associated with cancer‐specific mortality. Sarcopenia was associated with an increased risk of cardiovascular‐specific mortality among females, but not males. Obesity, defined using BMI or waist circumference, did not modify the prognostic importance of sarcopenia. Collectively, these data help to advance our understanding of sarcopenia among community‐dwelling older adults.
It is important to understand the strengths and weaknesses of this study to facilitate interpretation of our findings. The main strength of this study is the large sample size that, based on the sampling design, is representative of the US population of community‐dwelling older adults.21 Our sample included participants with a wide range of age (from 60 to 90 years). The cohort had an extensive length of follow‐up (median 14.4 years), allowing us to examine specific causes of death.
There are several limitations of this study. The primary limitation is that we did not collect handgrip strength on study participants. Handgrip strength has been endorsed in some,2 but not all,3 recommendations as a screening modality to identify persons suspected of having sarcopenia. The assessment of handgrip strength is encouraged among persons who have a normal gait speed (>0.8 m/s) to detect muscle weakness that may not be reflected in a slow gait.2 We relied solely on gait speed as a measure of muscle function, which is correlated with muscle strength of the lower limbs.37 Prior work has described that the additional cases of sarcopenia detected when handgrip strength is added to gait speed appear to be few, suggesting that gait speed alone may sufficiently discriminate those with adequate (vs. inadequate) muscle performance.15 A second limitation of our study is that information on comorbid health conditions was self‐reported. This likely underestimates the prevalence of comorbidities. For example, for each known case of diabetes, there exists one unknown case.38 The sample of obese subjects with sarcopenia was modest in the current study, and therefore our analysis that examined sarcopenia and obesity was limited to all‐cause mortality as an outcome and considered exploratory.
We found that the prevalence of sarcopenia among community‐dwelling older adults was 36.5%, a higher prevalence than previously estimated by a review conducted by the International Sarcopenia Initiative (estimated range between 1 and 29%).39 The heterogeneity in published estimates of sarcopenia prevalence may be influenced by multiple factors such as the age and sex distribution of the population, and the methods and cut‐points used to measure muscle mass and muscle function to define sarcopenia.39 In our sample age and sex were both associated with sarcopenia, such that older (vs. younger) adults and males (vs. females) were more likely to have sarcopenia. Our results are consistent with prior work defining age and sex as correlates of sarcopenia.20, 39 We used validated methods to assess muscle mass and muscle function, and recommended cut‐points to identify sarcopenia.2
This study identified sarcopenia as a risk factor for all‐cause mortality. We adjusted for potential confounders that included demographic, behavioural, and clinical characteristics, and sarcopenia remained a significant predictor of all‐cause mortality. This finding is consistent with prior reports documenting the deleterious effect of sarcopenia on all‐cause mortality.14, 15, 16 Sarcopenia was also a significant risk factor for cardiovascular‐specific mortality for females, but not males. These data substantiate earlier findings that sarcopenic females are more likely to have greater arterial stiffness than non‐sarcopenic females, an observation that was not observed among males.40 Sarcopenia was not associated with cancer‐specific mortality, but was associated with other‐causes of mortality (i.e. non‐cardiovascular and non‐cancer). Collectively, these data indicate that sarcopenia portends a poor prognosis among community‐dwelling older adults.
The prevalence of obesity among older adults has increased dramatically in the past three‐decades.34 Although sarcopenia and obesity have been hypothesized to potentiate each other causing deleterious effects on disability and mortality,41 our exploratory subgroup analysis of obesity did not identify any interactions of obesity on the association of sarcopenia with mortality. We defined obesity both by BMI and waist circumference, with similar findings. These data align with prior reports in males7 and females10 that obesity does not appear to modify the relationship between sarcopenia and all‐cause mortality. Nonetheless, given the high prevalence of sarcopenia and obesity among older adults, this area of research warrants additional investigation.
Sarcopenia is characterized by the age‐associated loss of skeletal muscle mass and loss of muscle function (defined by measures of muscle strength or performance).2, 3 Studies have demonstrated that muscle strength predicts mobility disability,4 and mortality,5 among older adults, independent of muscle mass. Exercise, such as slowly‐progressive weight lifting, may increase muscle strength and improve physical function among older adults.42 Aerobic exercise such as brisk walking is efficacious to preserve physical function among older adults.43 However, few studies have examined the efficacy of exercise specifically among persons with sarcopenia.39 The potential efficacy of exercise in this population warrants further investigation.
In summary, sarcopenia is highly prevalent among community‐dwelling older adults in the United States and is a strong prognostic factor for premature mortality among older adults. Exercise is positioned as a potentially efficacious intervention for older adults with sarcopenia. However, randomized clinical trials are necessary to demonstrate efficacy and to clarify the safety profile of exercise in this population.
Conflict of interests
JCB, MOH, and MNH declare no conflicts of interest.
Acknowledgement
Research reported in this publication was supported by the National Cancer Institute (F31‐CA192560, R21‐CA182726), National Heart, Lung, and Blood Institute (F31‐HL127947), and the National Institute of Diabetes and Digestive and Kidney Diseases (K23‐DK105207) of the National Institutes of Health. The content is solely the responsibility of the authors and does not necessarily represent the official views of the National Institutes of Health. The authors certify that they comply with the ethical guidelines for authorship and publishing of the Journal of Cachexia, Sarcopenia and Muscle (von Haehling S, Morley JE, Coats AJS, Anker SD). Ethical guidelines for authorship and publishing in the Journal of Cachexia, Sarcopenia, and Muscle. J Cachexia Sarcopenia Muscle. 2010;1:7–8).
Brown, J. C. , Harhay, M. O. , and Harhay, M. N. (2016) Sarcopenia and mortality among a population‐based sample of community‐dwelling older adults. Journal of Cachexia, Sarcopenia and Muscle, 7: 290–298. doi: 10.1002/jcsm.12073.
References
- 1. Goodpaster BH, Park SW, Harris TB, Kritchevsky SB, Nevitt M, Schwartz AV, et al. The loss of skeletal muscle strength, mass, and quality in older adults: the health, aging and body composition study. J Gerontol A Biol Sci Med Sci 2006;61:1059–1064. [DOI] [PubMed] [Google Scholar]
- 2. Cruz‐Jentoft AJ, Baeyens JP, Bauer JM, Boirie Y, Cederholm T, Landi F, et al. Sarcopenia: European consensus on definition and diagnosis: report of the European Working Group on Sarcopenia in Older People. Age Ageing 2010;39:412–423. [DOI] [PMC free article] [PubMed] [Google Scholar]
- 3. Fielding RA, Vellas B, Evans WJ, Bhasin S, Morley JE, Newman AB, et al. Sarcopenia: an undiagnosed condition in older adults. Current consensus definition: prevalence, etiology, and consequences. International working group on sarcopenia. J Am Med Dir Assoc 2011;12:249–256. [DOI] [PMC free article] [PubMed] [Google Scholar]
- 4. Visser M, Goodpaster BH, Kritchevsky SB, Newman AB, Nevitt M, Rubin SM, et al. Muscle mass, muscle strength, and muscle fat infiltration as predictors of incident mobility limitations in well‐functioning older persons. J Gerontol A Biol Sci Med Sci 2005;60:324–333. [DOI] [PubMed] [Google Scholar]
- 5. Newman AB, Kupelian V, Visser M, Simonsick EM, Goodpaster BH, Kritchevsky SB, et al. Strength, but not muscle mass, is associated with mortality in the health, aging and body composition study cohort. J Gerontol A Biol Sci Med Sci 2006;61:72–77. [DOI] [PubMed] [Google Scholar]
- 6. Rantanen T. Muscle strength, disability and mortality. Scand J Med Sci Sports 2003;13:3–8. [DOI] [PubMed] [Google Scholar]
- 7. Atkins JL, Whincup PH, Morris RW, Lennon LT, Papacosta O, Wannamethee SG. Sarcopenic obesity and risk of cardiovascular disease and mortality: a population‐based cohort study of older men. J Am Geriatr Soc 2014;62:253–260. [DOI] [PMC free article] [PubMed] [Google Scholar]
- 8. Bunout D, de La Maza, María P, Barrera G, Leiva L, Hirsch S Association between sarcopenia and mortality in healthy older people. Australas J Ageing 2011;30:89–92. [DOI] [PubMed] [Google Scholar]
- 9. Cesari M, Pahor M, Lauretani F, Zamboni V, Bandinelli S, Bernabei R, et al. Skeletal muscle and mortality results from the InCHIANTI study. J Gerontol A Biol Sci Med Sci 2009;64:377–384. [DOI] [PMC free article] [PubMed] [Google Scholar]
- 10. Batsis J, Mackenzie T, Barre L, Lopez‐Jimenez F, Bartels S. Sarcopenia, sarcopenic obesity and mortality in older adults: results from the National Health and Nutrition Examination Survey III. Eur J Clin Nutr 2014;68:1001–1007. [DOI] [PubMed] [Google Scholar]
- 11. Roubenoff R, Parise H, Payette HA, Abad LW, D'Agostino R, Jacques PF, et al. Cytokines, insulin‐like growth factor 1, sarcopenia, and mortality in very old community‐dwelling men and women: the Framingham Heart Study. Am J Med 2003;115:429–435. [DOI] [PubMed] [Google Scholar]
- 12. Srikanthan P, Karlamangla AS. Muscle mass index as a predictor of longevity in older adults. Am J Med 2014;127:547–553. [DOI] [PMC free article] [PubMed] [Google Scholar]
- 13. Wannamethee SG, Shaper AG, Lennon L, Whincup PH. Decreased muscle mass and increased central adiposity are independently related to mortality in older men. Am J Clin Nutr 2007;86:1339–1346. [DOI] [PubMed] [Google Scholar]
- 14. Arango‐Lopera V, Arroyo P, Gutiérrez‐Robledo LM, Perez‐Zepeda M, Cesari M. Mortality as an adverse outcome of sarcopenia. J Nutr Health Aging 2013;17:259–262. [DOI] [PMC free article] [PubMed] [Google Scholar]
- 15. Landi F, Cruz‐Jentoft AJ, Liperoti R, Russo A, Giovannini S, Tosato M, et al. Sarcopenia and mortality risk in frail older persons aged 80 years and older: results from ilSIRENTE study. Age Ageing 2013;42:203–209. [DOI] [PubMed] [Google Scholar]
- 16. Alexandre TDS, Duarte YDO, Santos JF, Wong R, Lebrao M Sarcopenia according to the European Working Group on Sarcopenia in Older People (EWGSOP) versus dynapenia as a risk factor for mortality in the elderly. J Nutr Health Aging 2014;18:751–756. [DOI] [PubMed] [Google Scholar]
- 17. Evans WJ. What is sarcopenia? J Gerontol A Biol Sci Med Sci 1995;50Spec No:5–8. [DOI] [PubMed] [Google Scholar]
- 18. Villareal DT, Banks M, Siener C, Sinacore DR, Klein S. Physical frailty and body composition in obese elderly men and women. Obes Res 2004;12:913–920. [DOI] [PubMed] [Google Scholar]
- 19. Koster A, Ding J, Stenholm S, Caserotti P, Houston DK, Nicklas BJ, et al. Does the amount of fat mass predict age‐related loss of lean mass, muscle strength, and muscle quality in older adults? J Gerontol A Biol Sci Med Sci 2011;66:888–895. [DOI] [PMC free article] [PubMed] [Google Scholar]
- 20. Landi F, Liperoti R, Fusco D, Mastropaolo S, Quattrociocchi D, Proia A, et al. Prevalence and risk factors of sarcopenia among nursing home older residents. J Gerontol A Biol Sci Med Sci 2012;67:48–55. [DOI] [PubMed] [Google Scholar]
- 21. Plan and operation of the Third National Health and Nutrition Examination Survey, 1988–94. Series 1: programs and collection procedures. Vital Health Stat 1 1994;1–407. [PubMed] [Google Scholar]
- 22. Van Kan GA, Rolland Y, Andrieu S, Bauer J, Beauchet O, Bonnefoy M, et al. Gait speed at usual pace as a predictor of adverse outcomes in community‐dwelling older people an International Academy on Nutrition and Aging (IANA) Task Force. J Nutr Health Aging 2009;13:881–889. [DOI] [PubMed] [Google Scholar]
- 23. Janssen I, Baumgartner RN, Ross R, Rosenberg IH, Roubenoff R. Skeletal muscle cutpoints associated with elevated physical disability risk in older men and women. Am J Epidemiol 2004;159:413–421. [DOI] [PubMed] [Google Scholar]
- 24. Lukaski HC, Johnson PE, Bolonchuk WW, Lykken GI. Assessment of fat‐free mass using bioelectrical impedance measurements of the human body. Am J Clin Nutr 1985;41:810–817. [DOI] [PubMed] [Google Scholar]
- 25. Janssen I, Heymsfield SB, Baumgartner RN, Ross R Estimation of skeletal muscle mass by bioelectrical impedance analysis. J Appl Physiol (1985) 2000;89:465–471. [DOI] [PubMed] [Google Scholar]
- 26. Rogot E, Sorlie P, Johnson NJ. Probabilistic methods in matching census samples to the National Death Index. J Chronic Dis 1986;39:719–734. [DOI] [PubMed] [Google Scholar]
- 27.National Center for Health Statistics. The Third National Nutrition and Health Survey Linked Mortality File: Matching Methodology. http://www.cdc.gov/nchs/data/datalinkage/mort_calibration_study. Accessed on 2 July 2015.
- 28.World Health Organization ICD‐10: International statistical classification of diseases and related health problems: World Health Organization, 2004.
- 29. Wilper AP, Woolhandler S, Lasser KE, McCormick D, Bor DH, Himmelstein DU. Health insurance and mortality in US adults. Am J Public Health 2009;99:2289–2295. [DOI] [PMC free article] [PubMed] [Google Scholar]
- 30. National Center for Health Statistics . NHANES III Questionnaires, Datasets and Related Documentation. http://www.cdc.gov/nchs/nhanes/nh3data.htm. Accessed on 2 July 2015.
- 31. Kennedy ET, Ohls J, Carlson S, Fleming K. The healthy eating index: design and applications. J Am Diet Assoc 1995;95:1103–1108. [DOI] [PubMed] [Google Scholar]
- 32. National Center for Health Statistics . Laboratory Procedures Used for the Third National Health and Nutrition Exam Survey (NHANES III), 1988–1994. http://wonder.cdc.gov/wonder/sci_data/surveys/hanes/hanes3/type_txt/lab.asp. Accessed on 2 July 2015.
- 33. Lacher DA, Hughes JP, Carroll MD. Estimate of biological variation of laboratory analytes based on the third national health and nutrition examination survey. Clin Chem 2005;51:450–452. [DOI] [PubMed] [Google Scholar]
- 34. Janssen I, Katzmarzyk PT, Ross R. Body mass index, waist circumference, and health risk: evidence in support of current National Institutes of Health guidelines. Arch Intern Med 2002;162:2074–2079. [DOI] [PubMed] [Google Scholar]
- 35. Greenland S. Tests for interaction in epidemiologic studies: a review and a study of power. Stat Med 1983;2:243–251. [DOI] [PubMed] [Google Scholar]
- 36. Korn EL, Graubard BI. Epidemiologic studies utilizing surveys: accounting for the sampling design. Am J Public Health 1991;81:1166–1173. [DOI] [PMC free article] [PubMed] [Google Scholar]
- 37. Bohannon RW. Comfortable and maximum walking speed of adults aged 20–79 years: reference values and determinants. Age Ageing 1997;26:15–19. [DOI] [PubMed] [Google Scholar]
- 38. Dunstan DW, Zimmet PZ, Welborn TA, De Courten MP, Cameron AJ, Sicree RA, et al. The rising prevalence of diabetes and impaired glucose tolerance: the Australian Diabetes, Obesity and Lifestyle Study. Diabetes Care 2002;25:829–834. [DOI] [PubMed] [Google Scholar]
- 39. Cruz‐Jentoft AJ, Landi F, Schneider SM, Zuniga C, Arai H, Boirie Y, et al. Prevalence of and interventions for sarcopenia in ageing adults: a systematic review. Report of the International Sarcopenia Initiative (EWGSOP and IWGS). Age Ageing 2014;43:748–759. [DOI] [PMC free article] [PubMed] [Google Scholar]
- 40. Sanada K, Miyachi M, Tanimoto M, Yamamoto K, Murakami H, Okumura S, et al. A cross‐sectional study of sarcopenia in Japanese men and women: reference values and association with cardiovascular risk factors. Eur J Appl Physiol 2010;110:57–65. [DOI] [PubMed] [Google Scholar]
- 41. Zamboni M, Mazzali G, Fantin F, Rossi A. Di Francesco V Sarcopenic obesity: a new category of obesity in the elderly. Nutr Metab Cardiovasc Dis 2008;18:388–395. [DOI] [PubMed] [Google Scholar]
- 42. Brown JC, Schmitz KH. Weight lifting and physical function among survivors of breast cancer: a post hoc analysis of a randomized controlled trial. J Clin Oncol 2015;33:2184–2189. [DOI] [PMC free article] [PubMed] [Google Scholar]
- 43. Pahor M, Guralnik JM, Ambrosius WT, et al. Effect of structured physical activity on prevention of major mobility disability in older adults: the life study randomized clinical trial. JAMA 2014;311:2387–2396. [DOI] [PMC free article] [PubMed] [Google Scholar]