

Abstract
Background & Aims
The prevalence of non-alcoholic fatty liver disease (NAFLD) and steatohepatitis (NASH) is increasing at an alarming rate. The role of bile acids in the development and progression of NAFLD to NASH and cirrhosis is poorly understood. This study aimed to quantify the bile acid metabolome in healthy subjects and patients with non-cirrhotic NASH under fasting conditions and after a standardized meal.
Methods
Liquid chromatography tandem mass spectroscopy was used to quantify 30 serum and 16 urinary bile acids from 15 healthy volunteers and 7 patients with biopsy-confirmed NASH. Bile acid concentrations were measured at two fasting and four post-prandial timepoints following a high-fat meal to induce gallbladder contraction and bile acid reabsorption from the intestine.
Results
Patients with NASH had significantly higher total serum bile acid concentrations than healthy subjects under fasting conditions (2.2- to 2.4-fold increase in NASH; NASH: 2595–3549 μM and healthy: 1171–1458 μM) and at all post-prandial time points (1.7- to 2.2-fold increase in NASH; NASH: 4444–5898 μM and healthy: 2634–2829 μM). These changes were driven by increased taurine- and glycine-conjugated primary and secondary bile acids. Patients with NASH exhibited greater variability in their fasting and post-prandial bile acid profile.
Conclusions
Results indicate that patients with NASH have higher fasting and post-prandial exposure to bile acids, including the more hydrophobic and cytotoxic secondary species. Increased bile acid exposure may be involved in liver injury and the pathogenesis of NAFLD and NASH.
Keywords: non-alcoholic steatohepatitis, bile acids, bile acid metabolome, enterohepatic recirculation
Introduction
Non-alcoholic fatty liver disease (NAFLD) is one of the most common chronic liver diseases in the Western world, and the incidence is rising concurrently with the increased prevalence of metabolic syndrome.[1] The more progressive form, non-alcoholic steatohepatitis (NASH), is characterized by advancing hepatocyte steatosis, ballooning, and inflammation, subsequently leading to fibrosis and cirrhosis.[2] The mechanisms behind the progression of NAFLD from simple steatosis to NASH to cirrhosis are not well understood. Previously, progression of NAFLD has been associated with genetic predisposition, insulin resistance, hepatic iron storage, as well as inflammatory events or mediators including adipokines, endotoxins and oxidative stress leading to apoptosis and necrosis.[3,4] Although the mechanisms precipitating release of inflammatory mediators or induction of cell death pathways are not fully understood, intestinal and hepatic handling of cytotoxic bile acids may be involved.
Primary bile acid species (cholate [CA] and chenodeoxycholate [CDCA]) are synthesized in the liver and stored in the gallbladder until ingestion of a high fat meal when they are released into the duodenum. In the intestine, bile acids are metabolized by bacteria to more hydrophobic bile acid species through dehydroxylation resulting in secondary bile acid species (deoxycholate [DCA] and lithocholate [LCA]) and/or deconjugation of hydrophilic groups (e.g., amino acids).[5–7] Ultimately the bile acids are reabsorbed and returned to the liver to repeat the highly efficient and tightly regulated cycle.[8] In addition to enteric metabolism by bacteria, primary and secondary bile acid species can be modified by hepatic addition of hydrophilic groups including hydroxyl (hyocholate [HCA], muricholate [MCA], and hyodeoxycholate [HDCA]) and/or amino acid moieties (taurine or glycine, abbreviated as T- and G- followed by the parent bile acid abbreviation [e.g., glycine conjugated cholate, GCA]).[8] Importantly, accumulation of bile acids within hepatocytes can cause cytotoxicity by inducing mitochondrial dysfunction and formation of reactive oxygen species, ultimately leading to apoptosis or necrosis. Generally, the more hydrophobic bile acid species (e.g., unconjugated secondary > conjugated primary) have greater cytotoxic effects.[3]
Although supra-physiologic bile acid concentrations appear to be deleterious, activation of many key receptors including the G-protein coupled receptor, TGR5, farnesoid X receptor (FXR), and pregnane X receptor (PXR) indicate that bile acids may have far reaching endocrine functions.[9] In addition to regulation of de novo bile acid synthesis, activation of these receptors is involved in triglyceride, cholesterol and glucose homeostasis.[8–10] Interestingly, affinity for these important signaling receptors is dependent on species and conjugation status of the individual bile acids.[9] Due to these signaling properties and target selectivity achievable with minor physicochemical modification, bile acids and their close derivatives have become promising drug candidates for treating metabolic and hepatic diseases.[11] However, the role of individual bile acid species in energy homeostasis in relation to inflammation and cell death pathways is poorly understood.
Modification of hepatic bile acid metabolism and transporters[12–14] and/or the gut microbiome[6,15] in NAFLD may alter the predominant bile acid species thereby impacting post-prandial bile acid-dependent signaling and modulating hepatic inflammatory cascades. Examination of bile acid species in patients currently abstinent from ethanol with steatohepatitis and cirrhosis revealed decreased secondary bile acids excreted in the stool and increased glycine- and taurine-conjugated bile acids in the serum.[16] However, the impact of non-cirrhotic NASH on bile acid concentrations under fasting conditions, and in response to a standardized high fat meal stimulus and subsequent enterohepatic recirculation, has not been elucidated. Therefore, in this study a comprehensive array of bile acid species in the serum and urine were quantified under fasting conditions at two distinct clinic visits, and following a high-fat meal in patients with biopsy-confirmed NASH compared to healthy subjects.
Patients and Methods
Patients
Healthy subjects and patients with biopsy-confirmed NASH, between 18 and 65 years of age, and of any race and ethnicity, who reported drinking <20 g/day of alcohol, were enrolled in the study. The general inclusion and exclusion criteria were described previously.[13] Briefly, inclusion criteria for healthy subjects and patients with NASH were: normal serum creatinine and total bilirubin levels; non-reactive hepatitis B antigen and hepatitis C antibody; no history of gastrointestinal surgery; and no ingestion of any over-the-counter or prescription medications or dietary supplements known to disturb bile acid metabolism, transport or enterohepatic cycling. Patients with NASH were recruited from the University of North Carolina at Chapel Hill (UNC-CH) hepatology clinic and were eligible for enrollment based on the following: biopsy-confirmed non-cirrhotic NASH with non-alcoholic fatty liver disease activity score (NAS) >3[17]; BMI ≤45 kg/m2. Healthy volunteers were recruited from a pool of interested respondents to posted flyers, email messages and word of mouth, and were eligible if all of the following applied: normal alkaline phosphatase (ALP) and alanine transaminase (ALT) levels; HOMA-IR score <2.5; BMI ≤30 kg/m2. Effort was made to recruit a healthy subject cohort in a 2:1 fashion comparable to the NASH cohort with respect to age, sex, race, and ethnicity. Written informed consent was obtained from all subjects. This study was approved by the UNC-CH Biomedical Institutional Review Board and published in ClinicalTrials.gov (NCT01766960).
Study Design
This single center, comparative cohort study evaluated the baseline fasting and post-prandial bile acid profile in healthy subjects and patients with NASH. Subjects were fasted overnight prior to the screening visit; screening labs and an initial bile acid sample were collected at the screening visit. Subsequently, subjects who met all inclusion/exclusion criteria fasted overnight prior to presenting to the Clinical and Translational Research Center at UNC-CH Hospitals. Following admission, subjects voided any urine, another fasting bile acid sample was collected, and an i.v. catheter was placed in each arm delivering 50 mL/hr of normal saline and lactated Ringer’s solution. Patients ate (within a 30-min period) a standardized breakfast sandwich containing 509 kcal, 27.2 g protein, 23.9 g fat, and 53.3 g carbohydrates designed to induce gallbladder contraction.[10,18] Blood (5–15 mL) was collected in untreated glass tubes every 30 min for 2 hours after the meal was finished; urine was collected and pooled over the 2-hour post-prandial period. Blood samples were allowed to clot for 30 to 60 min, and serum was separated, divided into aliquots and frozen. Serum and urine samples were stored at −80°C until analysis.
Sample Processing and Analysis
A total of 30 bile acid standards were available and obtained from Steraloids Inc. (Newport, RI). Stable isotope-labeled standards were obtained from C/D/N Isotopes Inc. (Quebec, Canada). Sample preparation and bile acid quantification methodology were adapted from Xie et al.[19] Briefly, an internal standard solution containing 50 nM d4-CA, d4-UDCA and d4-LCA (C/D/N Isotopes, Quebec, Canada) was added to serum, urine or standard solution. After centrifugation, the supernatant was evaporated to dryness. The residue was reconstituted with 50:50 acetonitrile and water and filtered. A UPLC-MS/MS system (ACQUITY UPLC-Xevo TQ-S, Waters Corp., Milford, MA) with VanGuard pre-column (2.1×5 mm) and heated ACQUITY BEH C18 1.7 μM column (2.1×100 mm) was used to quantify 30 bile acids in serum and urine. The mass spectrometer was operated in negative ion mode. The cone and collision energy for each bile acid used the optimized settings from QuanOptimize application manager (Waters Corp., Milford, MA). Calibration solutions containing all 30 analytes prepared at a series of concentrations in pooled naïve plasma depleted of bile acids using activated charcoal were used to generate calibration curves using TargetLynx application manager (Waters Corp., Milford, MA).
Data Analysis
The molar sum of all measured bile acids is reported as total bile acids. Total unconjugated and glycine- and taurine-conjugated bile acids were calculated as the sum of all unconjugated or glycine- or taurine-conjugated species of CA, CDCA, HCA, HDCA, MCA, DCA, LCA, and UDCA bile acid species. The total concentrations of primary, secondary and 6α-hydroxylated bile acid species were calculated by adding the molar concentrations of all conjugated and unconjugated species of CA and CDCA; DCA, LCA, and UDCA; and HCA, HDCA, and MCA, respectively. The relative abundance of each group of bile acid species was calculated as the total molar mass for that particular species divided by the total bile acid concentration. Urinary bile acid species are presented as the total mass excreted over the 2-hour postprandial period calculated as the product of the concentration in urine and the volume of urine collected. The limit of quantification was 1 nM for all bile acid species except for a limit of 2 nM for GDCA and dehydro-, allo-, and iso-LCA, and a limit of 5 nM for 12-dehydro-HCA. Measured bile acid concentrations below the limit of quantification, but above the limit of detection were imputed as the limit of quantification; concentrations measured below the limit of detection were set to zero.
Statistical Analysis Strategy
Study population characteristics are presented as mean and standard deviation. Individual bile acid species and groups of bile acids are presented and graphed as mean and standard error. To compare the total post-prandial exposure to selected bile acids, the area under the serum concentration-time curve (AUC) from baseline on the study day to the 2-hour post-prandial time point (AUCpost-prandial; AUCpp) was estimated using non-compartmental analysis techniques with linear trapezoidal algorithm (WinNonlin Phoenix, v. 6.3, Certara, St. Louis, MO). Cohort characteristics, bile acid concentrations at discrete time points and AUCpp comparisons relied on a two-tailed pooled-variance t-test procedure of size α=0.05 using SAS (v. 9.3, SAS Institute, Inc., Cary, NC) and GraphPad Prism (v. 6.0 for Windows, GraphPad Software, La Jolla, CA). Due to the nature of this study and relatively small samples size, adjustment of statistical tests for multiple comparisons was not possible. According to the Shapiro-Wilk test, some individual and groups of bile acids were skewed and not normally distributed. Although the power to detect a difference using a parametric test with skewed data is decreased, all statistical comparisons were conducted similarly. Orthogonal partial least squares-discriminant analysis (OPLS-DA), a multivariate approach, was performed to visualize the bile acid metabolome in patients with NASH compared to healthy controls (SIMCA v. 13.0.3, Umetrics, Umeå, Sweden). OPLS-DA models were developed for the bile acid profile pooled from all samples collected as well as at each individual collection time.
Results
Study Subjects
Twenty-two volunteers (15 healthy subjects and 7 patients with biopsy-confirmed NASH) were studied. In selecting healthy subjects, effort was made to recruit a control cohort comparable to the NASH cohort with respect to age, sex, race, and ethnicity. The demographic results (Table 1) were reported, in part, in association with a pharmacokinetic study conducted in some of these subjects.[13] As expected, patients with NASH weighed more and had a higher body mass index (BMI) than the healthy subjects. Serum creatinine was within normal limits for both groups, resulting in estimated glomerular filtration rates within normal limits for all subjects. Compared to healthy subjects, patients with NASH had higher serum alanine aminotransferase (ALT), alkaline phosphatase (ALP), triglycerides, and decreased high-density lipoprotein cholesterol (HDL). Patients with NASH had increased insulin resistance as demonstrated by increased fasting glucose, insulin and leptin concentrations, as well as by homeostasis model for assessing insulin resistance (HOMA-IR) scores; insulin and glucose levels were statistically significantly higher at all post-prandial time points with the exception of the insulin concentration 30 min after completion of the meal (data not shown). Serum osteopontin concentrations were increased in patients with NASH at all fasting and post-prandial time points, but these differences did not reach statistical significance. Biopsy results indicated that all NASH patients had a NAFLD activity score (NAS) of at least 4, with a maximum score of 6 and minimal to moderate (F0 to F3) fibrosis (Table 1).
Table 1.
Demographic characteristics, serum chemistries, insulin resistance and liver biopsy grade of study participants.
| Parameter | Healthy (n=15) | NASH (n=7)a | |
|---|---|---|---|
| Sex | Men : Women | 7:8 | 3:4 |
| Ethnicity | Hispanic : Non-Hispanic | 1:14 | 1:6 |
| Race | White : Black | 13:2 | 7:0 |
| Age (years) | 43 (12) | 48 (10) | |
| Body weight (kg) | 74 (15) | 93 (17)* | |
| Body mass index (kg/m2) | 25 (2.7) | 32 (5.2)* | |
| Creatinine (mg/dL) | 0.81 (0.13) | 0.80 (0.22) | |
| ALT (U/L) | 33 (11) | 75 (36)* | |
| ALP (U/L) | 64 (13) | 80 (14)* | |
| Albumin (g/dL) | 4.3 (0.3) | 4.5 (0.4) | |
| Total Bilirubin (mg/dL) | 0.63 (0.21) | 0.81 (0.29) | |
| Cholesterol (mg/dL) | 192 (40) | 190 (48) | |
| Triglycerides (mg/dL) | 96 (49) | 253 (98)* | |
| HDL (mg/dL) | 67 (26) | 37 (5)* | |
| LDL, calculated (mg/dL) | 105 (35) | 101 (47) | |
| Leptin (ng/mL) | 9.1 (7.9) | 31 (30)* | |
| Osteopontin (ng/mL) | 19 (16) | 30 (9.8) | |
| Fasting Glucose (mg/dL) | 86 (8) | 124 (16)* | |
| Serum Insulin (μIU/mL) | 7.6 (2.6) | 40 (27)* | |
| HOMA-IR | 1.6 (0.6) | 13 (8.7)* | |
| Total NAS Score | N/A | 5 (4–6) | |
| Steatosis | N/A | 2 (1–3) | |
| Hepatocyte Ballooning | N/A | 2 (1–3) | |
| Inflammation | N/A | 1 (0–2) | |
| Fibrosis | N/A | 1 (0–3) | |
| NAS + Fibrosis | N/A | 7 (4–8) | |
| FibroScan® Liver Stiffness (kPa) | 4.14 (0.97) | 13.9 (8.13)* | |
Data presented as mean (SD); biopsy scoring presented as median (range)
Some demographic data were reported previously as part of a pharmacokinetic study [13]
ALT; alanine aminotransferase
ALP; alkaline phosphatase
HDL; high-density lipoprotein cholesterol
LDL; low-density lipoprotein cholesterol
NAS: non-alcoholic fatty liver disease activity score
HOMA-IR; homeostasis model for assessing insulin resistance
N/A; not applicable
P < 0.05, Student’s two-tailed t-test comparing healthy subjects to patients with NASH
Fasting Circulating Bile Acid Concentrations
Total fasting serum bile acid concentrations in patients with NASH were increased 2.2 to 2.4-fold compared to healthy subjects (Figure 1). As shown, this difference was due predominantly to higher concentrations of taurine- and glycine-conjugated bile acids. Taurine-conjugated bile acids increased by as much as 5.6-fold whereas glycine-conjugated bile acids increased to a lesser extent by as much as 3.2-fold. Individual serum bile acid concentrations under fasting conditions at screening and on the study day (T=0) are presented in Supplementary Table 1. Both primary and secondary bile acids were increased in patients with NASH (Figure 2, Supplementary Table 1). It is important to note that total secondary bile acid concentrations, which tend to be more hydrophobic and toxic, were statistically significantly higher in patients with NASH at both fasting serum collections (screening and T=0) by 2.3 to 2.5-fold compared to healthy subjects (Supplementary Table 1).
Figure 1.

Serum bile acid concentrations at screening and on study day by conjugation status in healthy subjects (grey, n=15) and patients with NASH (black, n=7). Total bile acid concentrations represent the molar sum of unconjugated, glycine-, taurine and sulfate-conjugated bile acids. Data are presented as mean (nM) and standard error of the mean. *p<0.05 NASH vs. Healthy
Figure 2.
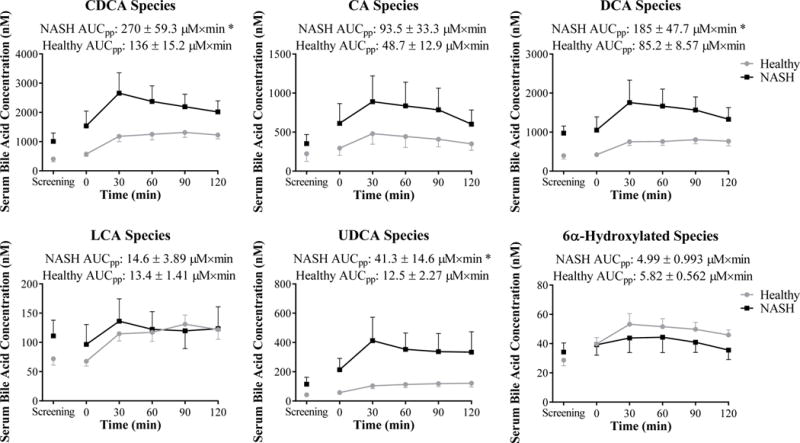
Serum bile acid species at screening and on study day depicted as concentration vs. time profiles in healthy subjects (grey circles, n=15) and patients with NASH (black squares, n=7). Post-prandial exposure calculated as the area under the serum concentration-time profile from 0–120 min (AUCpp) is reported. Data are presented as mean (nM or μM×min) and standard error of the mean. *p<0.05 NASH vs. Healthy
Post-Prandial Circulating Bile Acid Concentrations and Urinary Bile Acid Excretion
Serum bile acid concentrations generally increased from baseline in both healthy subjects and patients with NASH following ingestion of the standardized high fat breakfast, consistent with gallbladder contraction and reabsorption of bile acids from the intestine. Patients with NASH exhibited a greater post-prandial increase in all bile acid groups except LCA and 6α-hydroxylated bile acids (Figure 2). Furthermore total post-prandial exposure measured by AUCpp of CDCA, DCA and UDCA species was statistically significantly increased in NASH patients after ingestion of the high fat meal (Figure 2). Interestingly, LCA did not exhibit the same increased post-prandial exposure between patients with NASH and healthy subjects compared to DCA. Separating the fasting and post-prandial circulating LCA concentrations by conjugation status revealed that patients with NASH had slightly increased unconjugated LCA exposure over the post-prandial period, whereas glycine- and taurine-conjugated LCA post-prandial exposure was decreased (Figure 3). This finding is contrary to the apparent increase in glycine and taurine conjugation patterns observed with most other serum bile acids.
Figure 3.

Serum total unconjugated (left) and glycine and taurine-conjugated (right) LCA bile acid species in healthy subjects (grey circles, n=15) and patients with NASH (black squares, n=7). Post-prandial exposure calculated as the area under the serum concentration-time profile from 0–120 min (AUCpp) is reported. Data are presented as mean (nM or μM×min) and standard error of the mean.
Although total concentrations of the majority of bile acids were increased in patients with NASH, the relative abundance of each bile acid species (defined as the fraction of the total bile acid concentration represented by each species) was unchanged at both fasting baseline measurements and over the post-prandial period (Figure 4). The relative amount of bile acids excreted in the urine was slightly higher in patients with NASH (Table 2, Figure 5).
Figure 4.
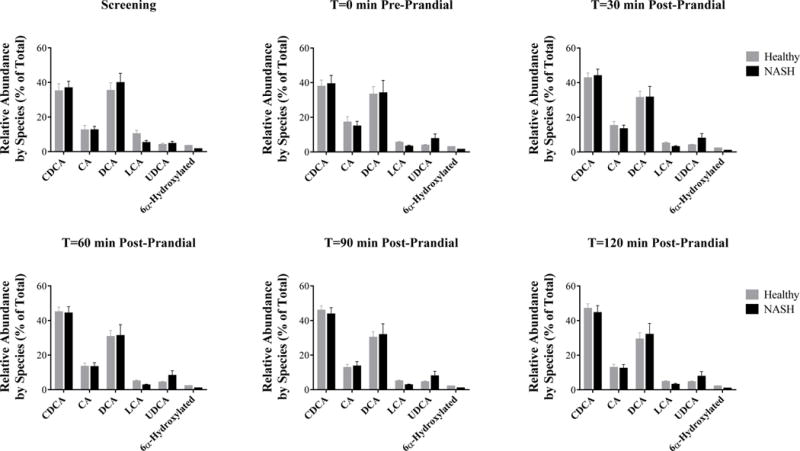
Relative abundance of bile acids in healthy subjects (grey, n=15) and patients with NASH (black, n=7) as a percentage of total serum bile acid concentrations. Data are presented as mean (%) and standard error of the mean.
Table 2.
Bile acids excreted in urine over 2-hour post-prandial period in healthy subjects and patients with NASH.
| Mass Excreted over Post-prandial Period | ||
|---|---|---|
|
| ||
| Bile Acid | Healthy | NASH |
|
| ||
| CA | 11.1 (6.6) |
11.3 (5.4) |
| DCA | 0.6 (0.1) |
1.8* (0.6) |
|
| ||
| 7-ketoDCA | 14.1 (5.7) |
20.5 (8.8) |
|
| ||
| 3-DHCA | 1.6 (0.7) |
1.8 (0.6) |
| 12-DHCA | 6.1 (1.4) |
4.9 (1.4) |
|
| ||
| HDCA | 0.8 (0.1) |
0.9 (0.1) |
|
| ||
| βMCA | 5.4 (3.2) |
5.1 (2.3) |
|
| ||
| ωMCA | 2.9 (1.1) |
6.8 (2.6) |
|
| ||
| GCA | 1.7 (0.4) |
3.6* (0.9) |
|
| ||
| GCDCA | 0.5 (0.1) |
1.1* (0.2) |
|
| ||
| GDCA | 1 (0.1) |
1.5 (0.4) |
| GUDCA | 6.3 (1.1) |
9.7 (4.1) |
|
| ||
| GHCA | 1.9 (0.3) |
1.2 (0.4) |
|
| ||
| TCA | 0.6 (0.1) |
1.2* (0.4) |
|
| ||
| TαMCA | 7.1 (2.7) |
13.5 (9.7) |
|
| ||
| LCA-3-sulfate | 1.6 (0.4) |
1.5 (0.6) |
|
| ||
| Total BA | 63.2 (17.5) |
86.5 (19.3) |
|
| ||
| Unconj BA | 42.6 (16.4) |
53.2 (15.6) |
|
| ||
| Glycine BA | 11.4 (1.6) |
17 (4.6) |
|
| ||
| Taurine BA | 7.6 (2.7) |
14.8 (10.1) |
|
| ||
| Sulfate BA | 1.6 (0.4) |
1.5 (0.6) |
|
| ||
| Primary BA | 13.9 (7) |
17.2 (6.1) |
|
| ||
| Secondary BA | 23.6 (6.5) |
35 (12.1) |
|
| ||
| 6α-BA | 25.7 (5.0) |
34.3 (9.9) |
Presented as mass excreted (nmoles) mean (SEM), n=13 Healthy and n=7 NASH
: P<0.05 t-test between healthy and NASH
Figure 5.
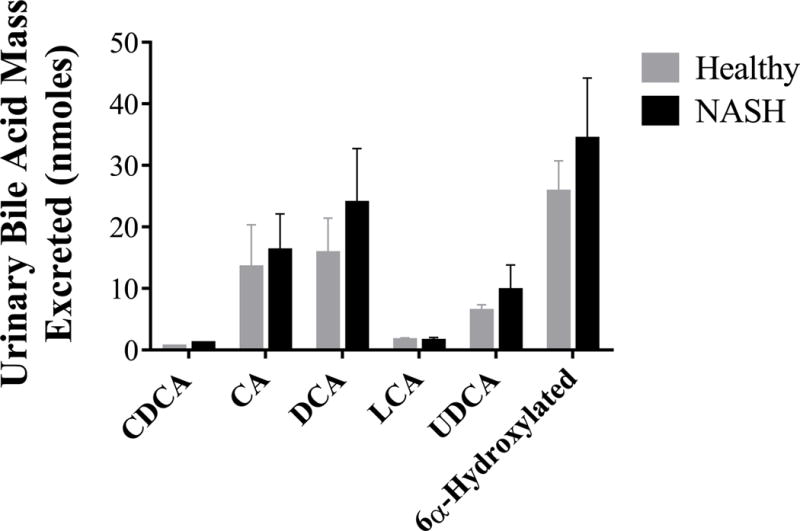
Urinary excretion of bile acid species in healthy subjects (grey, n=13) and patients with NASH (black, n=7). Data are presented as mean (nmoles) and standard error of the mean.
Orthogonal Partial Least Squares-Discriminant Analysis
Separate OPLS-DA scores plots for the bile acids at each fasting and post-prandial sample were used to evaluate perturbations in the profile of individual bile acid species between patients with NASH and healthy subjects (Figure 6). OPLS-DA scores plots of the bile acids indicated that patients with NASH clearly separated from healthy subjects (cumulative Q2Y 0.20 to 0.40). Under fasting conditions, healthy subjects were more tightly grouped and demonstrated less overall variability in the primary components of the bile acid profile compared to patients with NASH. The OPLS-DA plots are able to distinguish diseased patients from healthy subjects (Figure 6 Screening and Pre-Prandial). Over the post-prandial period, the cluster describing healthy subjects tended to expand (Figure 6 Post-Prandial), suggesting that the high fat meal induced a more pronounced change in the bile acid profile in the patients with NASH compared to healthy subjects.
Figure 6.

Scores plots of the OPLS-DA models of bile acid profiles at each sample time in patients with NASH (black diamonds) compared to healthy subjects (grey circles) under fasting conditions (screening and pre-prandial) and following a high fat meal (30, 60, 90 and 120 min post-prandial).
Discussion
This study is the first to compare the serum bile acid profile in patients with non-cirrhotic NASH to healthy controls without evidence of insulin resistance under fasting conditions and following a high fat breakfast. The fasting serum bile acid profile in healthy subjects was almost identical to previous reports strengthening the validity of our methods and results.[5,20] This is likely due to the redundant cellular mechanisms and feedback loops governing de novo synthesis, hepatic and intestinal metabolism, hepatic excretion and intestinal reabsorption providing tight control of bile acid homeostasis.[8,15] However, in the presence of NASH, regulation of bile acid homeostasis appears to be disrupted. The fasting total serum bile acid concentrations were increased in patients with NASH by approximately 2-fold, driven by increases in glycine- and taurine-conjugated bile acids including increased secondary bile acid species. In similar studies evaluating bile acid concentrations in patients with cirrhotic NASH and rodent models, similar albeit exaggerated increases in systemic bile acids were observed compared to the present study, whereas primary and secondary bile acid concentrations were reduced in human stool samples.[16,21] Although stool concentrations were decreased, intrahepatic accumulation of the secondary bile acid DCA was increased in NASH.[22] Serum and urine DCA concentrations were statistically significantly increased in the present study. Overall, these findings suggest that multiple regulatory mechanisms involved in the formation and recirculation of bile acids may be impacted in patients with NASH.
Intestinal flora mediate deconjugation of bile acids as well as conversion of primary to secondary bile acid species. While many intestinal microbes deconjugate bile acids, only a few possess the ability to dehydroxylate primary to secondary bile acids.[7] Therefore, changes in intestinal flora, especially in the colon where most bacteria that are able to dehydroxylate bile acids reside, could substantially alter systemic concentrations of conjugated and/or secondary bile acids returned to the liver through enterohepatic recirculation. Intestinal dysbiosis in NAFLD has been well documented.[6,15] Changes in the fecal microbiota in NAFLD involve some of the most prominent phylums, including Firmicutes, Bacteroidetes and Proteobacteria. Many of the individual species within these groups are able to deconjugate and/or dehydroxylate bile acids, including Bacteroides, Clostridium and Escherichia, which may lead to increased circulating unconjugated secondary bile acid species. Furthermore, the variability observed in pre- and post-prandial bile acid concentrations may be influenced by intra-subject variation in GI flora.
Higher systemic concentrations of secondary bile acids in this study are consistent with altered intestinal microbiota and increased production of secondary bile acids, with the majority present as conjugated species. This finding could be due to decreased deconjugation of secondary bile acids by intestinal microbiota, but also is likely influenced by increased hepatic conjugation with taurine and glycine. Bile acid coenzyme A:amino acid N-acyltransferase enzyme (BAAT) is the primary enzyme responsible for conjugation of bile acids with taurine and glycine.[23] Indeed, both BAAT expression and availability of taurine as a cofactor were increased in liver biopsies from patients with NASH compared to subjects without liver disease.[24] Taken together, our findings support the theory that altered intestinal microbiota and increased hepatic conjugation of secondary bile acids leads to a greater systemic burden of secondary bile acids and potential for toxic effects.
Under normal physiologic conditions bile acids appear to function as hormones, which allows communication between the liver, intestine, and other organ systems. Bile acids are ligands for FXR, TGR5, and PXR, which are involved in diverse functions including prevention of intestinal bacterial overgrowth[25], stimulating the release of glucagon-like peptide-1[26], and regulating adipose and muscle tissue energy expenditure.[27] At high levels, bile acids are able to activate inflammatory- and oxidative stress-mediated cell death pathways[28]; the more hydrophobic bile acid species (e.g., DCA and LCA) appear to be more potent activators of these pathways.[29] Therefore constant or repeated activation of these cell death pathways could result in prolonged low-grade inflammation and selection for resistant cells and cancer initiation. In this study, patients with NASH had increased total and secondary bile acid concentrations under fasting conditions and at all post-prandial time points; post-prandial exposure to DCA species was statistically significantly increased 2-fold. Additionally, unconjugated LCA species showed a trend toward higher concentrations in patients with NASH at pre- and post-prandial time points. Furthermore, taurine and glycine conjugation of LCA, which aids in LCA detoxification, appears to be decreased as evidenced by the decreased exposure to glycine- and taurine-conjugated LCA species 1 to 2 hours following a high fat meal. This suggests bile acids may be involved in the pathogenesis of liver injury and potentially initiation of cancerous activity, particularly in the colon or liver where the secondary bile acids concentrate.[2,30]
OPLS-DA plots show a clear differentiation in bile acid species at fasting and post-prandial time points. These findings suggest that, in addition to bile acid species playing a role in the pathogenesis of NASH, bile acid profiles may be useful in the diagnosis of NASH. Variations in profiles could reflect pre-cirrhotic decrements in liver synthetic and excretory function. Recently, altered hepatic transporter-mediated disposition of morphine glucuronide was shown to be positively correlated with NASH severity.[13] Progression of NAFLD from simple steatosis to NASH is correlated with decreased hepatic uptake and increased hepatic efflux transport protein expression.[12] These transporters are involved in the disposition of both exogenously administered drugs as well as endogenous substrates, including bile acids. Therefore, future well-controlled studies should evaluate the diagnostic ability of changes in the bile acid metabolome to detect pre-cirrhotic liver dysfunction in patients with NASH and simple steatosis.
In conclusion, this study demonstrates patients with NASH have a distinct shift in fasting circulating bile acids that is exaggerated in the post-prandial time period. This shift results in a more hydrophobic bile acid profile that may influence and/or precipitate NAFLD progression, and has implications in the diagnosis and staging of NASH. Bile acid derivatives and modulators are being evaluated for the treatment of NAFLD/NASH. Further research is vital for understanding the potential role of endogenous bile acids in NAFLD progression and the benefit these new agents may afford.
Supplementary Material
Acknowledgments
The authors would like to sincerely thank Drs. Nathan D. Pfeifer, Mary F. Paine, and Dhiren R. Thakker for insightful discussions throughout the development, conduct and analysis of this study. The authors also would like to thank Kevin B. Harris and Dr. Eleftheria Tsakalozou for assistance with study conduct and data management, and Lisa Hardee for assistance performing FibroScan® measurements. Phoenix WinNonlin software was generously provided to the Division of Pharmacotherapy and Experimental Therapeutics, UNC Eshelman School of Pharmacy, by Certara as a member of the Pharsight Academic Center of Excellence Program.
Financial Support: This project was supported in part by the National Institutes of Health, National Center for Advancing Translational Sciences (NCATS), through award number 1UL1TR001111, National Institute of General Medical Sciences through award number R01 GM041935 [K.L.R.B], an Amgen Predoctoral Fellowship in Pharmacokinetics and Drug Disposition [B.C.F.], and Quintiles Pharmacokinetics/Pharmacodynamics Fellowships [C.K.J.]. The content is solely the responsibility of the authors and does not necessarily represent the official views of the NIH, Amgen or Quintiles.
Abbreviations (as they appear)
- NAFLD
Non-Alcoholic Fatty Liver disease
- NASH
Non-Alcoholic Steatohepatitis
- CA
Cholate
- CDCA
Chenodeoxycholate
- DCA
Deoxycholate
- LCA
Lithocholate
- HCA
Hyocholate
- MCA
Muricholate
- HDCA
Hyodeoxycholate
- FXR
Farnesoid X Receptor
- PXR
Pregnane X Receptor
- NAS
Non-Alcoholic Fatty Liver Disease Activity Score
- AUC
Area Under the Curve
- OPLS-DA
Orthogonal Partial Lease Squares-Discriminant Analysis
- HOMA-IR
Homeostatic Model for Assessing Insulin Resistance
- BAAT
Bile Acid Coenzyme A:Amino Acid N-Acyltransferase
Footnotes
Author Contributions:
Participated in research design: Ferslew, Stewart, Jia, Brouwer and Barritt
Recruited patients: Ferslew, Johnston, and Barritt
Conducted experiments: Ferslew, Johnston, Xie and Su
Performed data analysis: Ferslew, Xie, Stewart, Jia, Brouwer and Barritt
Wrote or contributed to the writing of the manuscript: Ferslew, Xie, Su, Stewart, Jia, Brouwer and Barritt
Conflict of Interest: The authors have no conflict of interest to disclose.
Contributor Information
Brian C. Ferslew, Email: bferslew@theravance.com.
Guoxiang Xie, Email: GXie@cc.hawaii.edu.
Curtis K. Johnston, Email: curtis.k.johnston@gmail.com.
Mingming Su, Email: MSu@cc.hawaii.edu.
Paul W. Stewart, Email: Paul_Stewart@unc.edu.
Wei Jia, Email: WJia@cc.hawaii.edu.
Kim L.R. Brouwer, Email: kbrouwer@unc.edu.
References
- 1.Browning JD, Szczepaniak LS, Dobbins R, et al. Prevalence of hepatic steatosis in an urban population in the United States: impact of ethnicity. Hepatology. 2004;40:1387–1395. doi: 10.1002/hep.20466. [DOI] [PubMed] [Google Scholar]
- 2.Chalasani N, Younossi Z, Lavine JE, et al. The diagnosis and management of non-alcoholic fatty liver disease: practice guideline by the American Gastroenterological Association, American Association for the Study of Liver Diseases, and American College of Gastroenterology. Gastroenterology. 2012;142:1592–1609. doi: 10.1053/j.gastro.2012.04.001. [DOI] [PubMed] [Google Scholar]
- 3.Perez MJ, Briz O. Bile-acid-induced cell injury and protection. World journal of gastroenterology : WJG. 2009;15:1677–1689. doi: 10.3748/wjg.15.1677. [DOI] [PMC free article] [PubMed] [Google Scholar]
- 4.Neuman MG, French SW, French BA, et al. Alcoholic and non-alcoholic steatohepatitis. Experimental and molecular pathology. 2014;97:492–510. doi: 10.1016/j.yexmp.2014.09.005. [DOI] [PMC free article] [PubMed] [Google Scholar]
- 5.Trottier J, Bialek A, Caron P, Straka RJ, Milkiewicz P, Barbier O. Profiling circulating and urinary bile acids in patients with biliary obstruction before and after biliary stenting. PLoS One. 2011;6:e22094. doi: 10.1371/journal.pone.0022094. [DOI] [PMC free article] [PubMed] [Google Scholar]
- 6.Mouzaki M, Comelli EM, Arendt BM, et al. Intestinal microbiota in patients with nonalcoholic fatty liver disease. Hepatology. 2013;58:120–127. doi: 10.1002/hep.26319. [DOI] [PubMed] [Google Scholar]
- 7.Ridlon JM, Kang DJ, Hylemon PB. Bile salt biotransformations by human intestinal bacteria. Journal of lipid research. 2006;47:241–259. doi: 10.1194/jlr.R500013-JLR200. [DOI] [PubMed] [Google Scholar]
- 8.Hofmann AF. Bile Acids: The Good, the Bad, and the Ugly. News in physiological sciences : an international journal of physiology produced jointly by the International Union of Physiological Sciences and the American Physiological Society. 1999;14:24–29. doi: 10.1152/physiologyonline.1999.14.1.24. [DOI] [PubMed] [Google Scholar]
- 9.Jonker JW, Liddle C, Downes M. FXR and PXR: potential therapeutic targets in cholestasis. The Journal of steroid biochemistry and molecular biology. 2012;130:147–158. doi: 10.1016/j.jsbmb.2011.06.012. [DOI] [PMC free article] [PubMed] [Google Scholar]
- 10.Roberts RE, Glicksman C, Alaghband-Zadeh J, Sherwood RA, Akuji N, le Roux CW. The relationship between postprandial bile acid concentration, GLP-1, PYY and ghrelin. Clinical endocrinology. 2011;74:67–72. doi: 10.1111/j.1365-2265.2010.03886.x. [DOI] [PubMed] [Google Scholar]
- 11.Mudaliar S, Henry RR, Sanyal AJ, et al. Efficacy and safety of the farnesoid X receptor agonist obeticholic acid in patients with type 2 diabetes and nonalcoholic fatty liver disease. Gastroenterology. 2013;145:574–582 e571. doi: 10.1053/j.gastro.2013.05.042. [DOI] [PubMed] [Google Scholar]; Bechmann LP, Kocabayoglu P, Sowa JP, et al. Free fatty acids repress small heterodimer partner (SHP) activation and adiponectin counteracts bile acid-induced liver injury in superobese patients with nonalcoholic steatohepatitis. Hepatology. 2013;57:1394–1406. doi: 10.1002/hep.26225. [DOI] [PubMed] [Google Scholar]
- 12.Hardwick RN, Fisher CD, Canet MJ, Scheffer GL, Cherrington NJ. Variations in ATP-binding cassette transporter regulation during the progression of human nonalcoholic fatty liver disease. Drug metabolism and disposition: the biological fate of chemicals. 2011;39:2395–2402. doi: 10.1124/dmd.111.041012. [DOI] [PMC free article] [PubMed] [Google Scholar]
- 13.Ferslew BC, Johnston CK, Tsakalozou E, et al. Altered morphine glucuronide and bile acid disposition in patients with non-alcoholic steatohepatitis. Clinical Pharmacology & Therapeutics. 2014 doi: 10.1002/cpt.66. n/a-n/a. [DOI] [PMC free article] [PubMed] [Google Scholar]
- 14.Jia X, Naito H, Yetti H, et al. Dysregulated bile acid synthesis, metabolism and excretion in a high fat-cholesterol diet-induced fibrotic steatohepatitis in rats. Digestive diseases and sciences. 2013;58:2212–2222. doi: 10.1007/s10620-013-2747-1. [DOI] [PMC free article] [PubMed] [Google Scholar]
- 15.Schnabl B, Brenner DA. Interactions between the intestinal microbiome and liver diseases. Gastroenterology. 2014;146:1513–1524. doi: 10.1053/j.gastro.2014.01.020. [DOI] [PMC free article] [PubMed] [Google Scholar]
- 16.Kakiyama G, Hylemon PB, Zhou H, et al. Colonic inflammation and secondary bile acids in alcoholic cirrhosis. American journal of physiology. Gastrointestinal and liver physiology. 2014;306:G929–937. doi: 10.1152/ajpgi.00315.2013. [DOI] [PMC free article] [PubMed] [Google Scholar]; Kalhan SC, Guo L, Edmison J, et al. Plasma metabolomic profile in nonalcoholic fatty liver disease. Metabolism: clinical and experimental. 2011;60:404–413. doi: 10.1016/j.metabol.2010.03.006. [DOI] [PMC free article] [PubMed] [Google Scholar]
- 17.Kleiner DE, Brunt EM, Van Natta M. Design and validation of a histological scoring system for nonalcoholic fatty liver disease. Hepatology. 2005;41:1313–1321. doi: 10.1002/hep.20701. [DOI] [PubMed] [Google Scholar]
- 18.Stone BG, Ansel HJ, Peterson FJ, Gebhard RL. Gallbladder emptying stimuli in obese and normal-weight subjects. Hepatology. 1992;15:795–798. doi: 10.1002/hep.1840150508. [DOI] [PubMed] [Google Scholar]
- 19.Xie G, Wang Y, Wang X, et al. Profiling of Serum Bile Acids in a Healthy Chinese Population Using UPLC-MS/MS. Journal of proteome research. 2015;14:850–859. doi: 10.1021/pr500920q. [DOI] [PubMed] [Google Scholar]
- 20.Trottier J, Bialek A, Caron P, et al. Metabolomic profiling of 17 bile acids in serum from patients with primary biliary cirrhosis and primary sclerosing cholangitis: a pilot study. Digestive and liver disease : official journal of the Italian Society of Gastroenterology and the Italian Association for the Study of the Liver. 2012;44:303–310. doi: 10.1016/j.dld.2011.10.025. [DOI] [PubMed] [Google Scholar]; Garcia-Canaveras JC, Donato MT, Castell JV, Lahoz A. Targeted profiling of circulating and hepatic bile acids in human, mouse, and rat using a UPLC-MRM-MS-validated method. Journal of lipid research. 2012;53:2231–2241. doi: 10.1194/jlr.D028803. [DOI] [PMC free article] [PubMed] [Google Scholar]
- 21.Tanaka N, Matsubara T, Krausz KW, Patterson AD, Gonzalez FJ. Disruption of phospholipid and bile acid homeostasis in mice with nonalcoholic steatohepatitis. Hepatology. 2012;56:118–129. doi: 10.1002/hep.25630. [DOI] [PMC free article] [PubMed] [Google Scholar]
- 22.Aranha MM, Cortez-Pinto H, Costa A, et al. Bile acid levels are increased in the liver of patients with steatohepatitis. European journal of gastroenterology & hepatology. 2008;20:519–525. doi: 10.1097/MEG.0b013e3282f4710a. [DOI] [PubMed] [Google Scholar]
- 23.Russell DW. The enzymes, regulation, and genetics of bile acid synthesis. Annual review of biochemistry. 2003;72:137–174. doi: 10.1146/annurev.biochem.72.121801.161712. [DOI] [PubMed] [Google Scholar]
- 24.Lake AD, Novak P, Shipkova P, et al. Decreased hepatotoxic bile acid composition and altered synthesis in progressive human nonalcoholic fatty liver disease. Toxicology and applied pharmacology. 2013;268:132–140. doi: 10.1016/j.taap.2013.01.022. [DOI] [PMC free article] [PubMed] [Google Scholar]
- 25.Inagaki T, Moschetta A, Lee YK, et al. Regulation of antibacterial defense in the small intestine by the nuclear bile acid receptor. Proceedings of the National Academy of Sciences of the United States of America. 2006;103:3920–3925. doi: 10.1073/pnas.0509592103. [DOI] [PMC free article] [PubMed] [Google Scholar]
- 26.Thomas C, Gioiello A, Noriega L, et al. TGR5-mediated bile acid sensing controls glucose homeostasis. Cell metabolism. 2009;10:167–177. doi: 10.1016/j.cmet.2009.08.001. [DOI] [PMC free article] [PubMed] [Google Scholar]
- 27.Watanabe M, Houten SM, Mataki C, et al. Bile acids induce energy expenditure by promoting intracellular thyroid hormone activation. Nature. 2006;439:484–489. doi: 10.1038/nature04330. [DOI] [PubMed] [Google Scholar]
- 28.Faubion WA, Guicciardi ME, Miyoshi H, et al. Toxic bile salts induce rodent hepatocyte apoptosis via direct activation of Fas. The Journal of clinical investigation. 1999;103:137–145. doi: 10.1172/JCI4765. [DOI] [PMC free article] [PubMed] [Google Scholar]; Rodrigues CM, Fan G, Wong PY, Kren BT, Steer CJ. Ursodeoxycholic acid may inhibit deoxycholic acid-induced apoptosis by modulating mitochondrial transmembrane potential and reactive oxygen species production. Molecular medicine (Cambridge, Mass) 1998;4:165–178. [PMC free article] [PubMed] [Google Scholar]
- 29.Spivey JR, Bronk SF, Gores GJ. Glycochenodeoxycholate-induced lethal hepatocellular injury in rat hepatocytes. Role of ATP depletion and cytosolic free calcium. The Journal of clinical investigation. 1993;92:17–24. doi: 10.1172/JCI116546. [DOI] [PMC free article] [PubMed] [Google Scholar]; Rodrigues CM, Fan G, Ma X, Kren BT, Steer CJ. A novel role for ursodeoxycholic acid in inhibiting apoptosis by modulating mitochondrial membrane perturbation. The Journal of clinical investigation. 1998;101:2790–2799. doi: 10.1172/JCI1325. [DOI] [PMC free article] [PubMed] [Google Scholar]
- 30.Bernstein H, Bernstein C, Payne CM, Dvorakova K, Garewal H. Bile acids as carcinogens in human gastrointestinal cancers. Mutation research. 2005;589:47–65. doi: 10.1016/j.mrrev.2004.08.001. [DOI] [PubMed] [Google Scholar]; Baffy G, Brunt EM, Caldwell SH. Hepatocellular carcinoma in non-alcoholic fatty liver disease: an emerging menace. Journal of hepatology. 2012;56:1384–1391. doi: 10.1016/j.jhep.2011.10.027. [DOI] [PubMed] [Google Scholar]; Larsson SC, Wolk A. Overweight, obesity and risk of liver cancer: a meta-analysis of cohort studies. British journal of cancer. 2007;97:1005–1008. doi: 10.1038/sj.bjc.6603932. [DOI] [PMC free article] [PubMed] [Google Scholar]; Larsson SC, Wolk A. Obesity and the risk of gallbladder cancer: a meta-analysis. British journal of cancer. 2007;96:1457–1461. doi: 10.1038/sj.bjc.6603703. [DOI] [PMC free article] [PubMed] [Google Scholar]; Reddy BS, Narasawa T, Weisburger JH, Wynder EL. Promoting effect of sodium deoxycholate on colon adenocarcinomas in germfree rats. Journal of the National Cancer Institute. 1976;56:441–442. doi: 10.1093/jnci/56.2.441. [DOI] [PubMed] [Google Scholar]; Zhang Y, Hagedorn CH, Wang L. Role of nuclear receptor SHP in metabolism and cancer. Biochimica et biophysica acta. 2011;1812:893–908. doi: 10.1016/j.bbadis.2010.10.006. [DOI] [PMC free article] [PubMed] [Google Scholar]
Associated Data
This section collects any data citations, data availability statements, or supplementary materials included in this article.