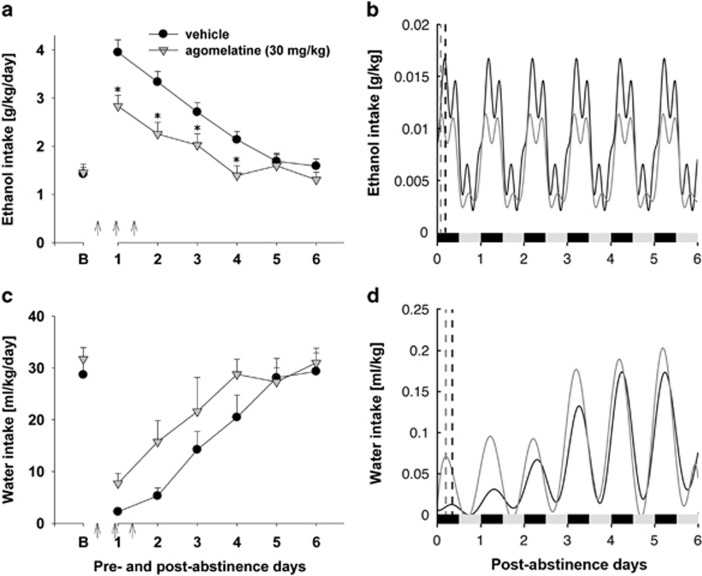
Figure 1.
Total daily ethanol intake (g/kg per day) before and after an alcohol deprivation period of 2 weeks (a) and the Fourier representations of the averaged 5-min ethanol (g/kg) intake during the first six post-abstinence drinking days (b). Total daily water intake (ml/kg per day) before and after an alcohol deprivation period of 2 weeks (c) and the Fourier representations of the averaged 5-min water (ml/kg) intake during the first six post-abstinence drinking days (d). Arrows indicate the administration of either vehicle (n=10) or 30 mg/kg of agomelatine (n=10). Drug administration was performed at ZT12 (ie, at the end of the light phase). The last six days measurements of ethanol and water intake is given as baseline drinking—B. Data are presented as means±SEM *indicates significant differences from the vehicle treatment group, P<0.05. In (b) and (d) the vehicle-treated animal group is marked as a black line and the agomelatine-treated animal group is marked as a gray line. Vertical dashed lines mark the peak fluid consumption within the first 24 h in vehicle (black) and agomelatine (gray) treated animal groups. The black and gray bars on the x-axis indicate the dark and light phases, respectively.

