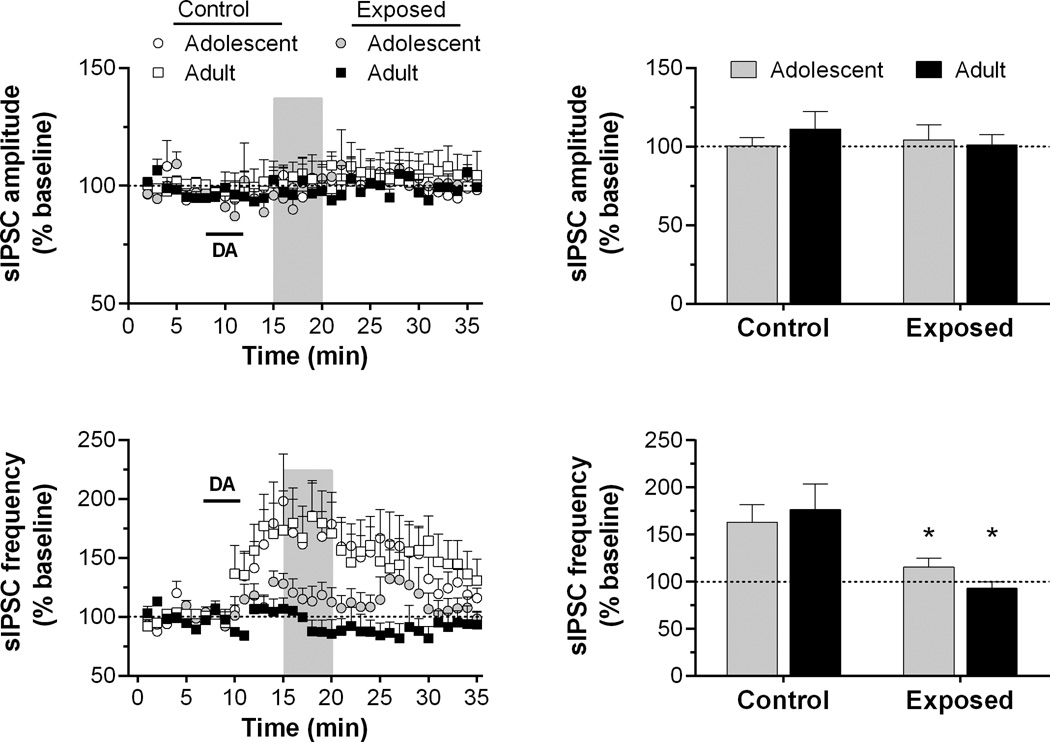
Fig. 2.
Time course and peak response for sIPSC amplitude and frequency in slices exposed to dopamine (DA; 50 µM for 4 min, as indicated by horizontal bar) in Experiment 1. Recordings were obtained from 4 to 6 cells/group in slices from 3 to 4 rats/group. Shaded regions in the time series indicate the areas of peak response (see “Experimental procedures”). The mean responses during these periods are summarized in the bar graphs. *p < 0.05, vs. control.

