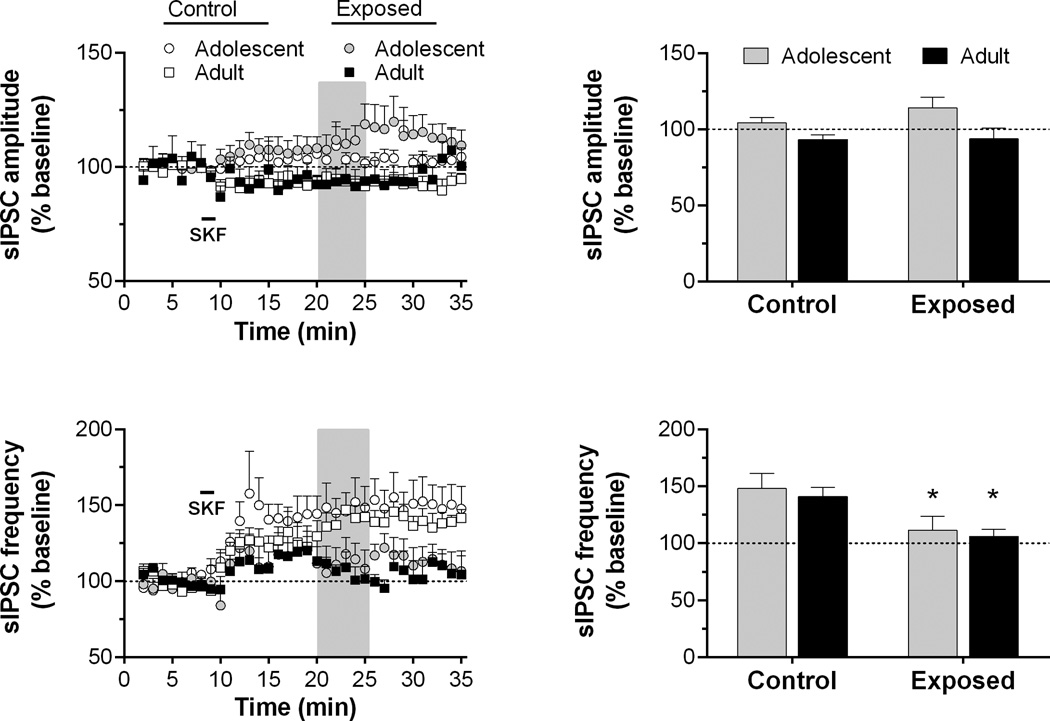
Fig. 3.
Time course and peak response for sIPSC amplitude and frequency in slices exposed to SKF38393 (10 µM for 90 s, as indicated by horizontal bar) in Experiment 1. Recordings were obtained from 4 to 7 cells/group in slices from 3 to 4 rats/group. Data are presented as described for Fig. 2. *p < 0.05, vs. control.

