

Abstract
The ascomycete Trichoderma reesei is used for the production of plant cell wall-degrading enzymes in industrial scale. The interplay of the transactivator Xyr1 and the repressor Cre1 mainly regulates the expression of these enzymes. During induc-ing conditions, such as in the presence of sophorose, the transcription of the two major cellulase-encoding genes, cbh1 and cbh2, is activated as well as the expression of xyr1. In the presence of D-glucose carbon catabolite repression mediated by Cre1 takes place and the expression of Xyr1 and the plant cell wall-degrading enzymes is down-regulated. In this study we compare the chromatin status of xyr1, cbh1, and cbh2 promoters in the wild-type strain and the Cre1-deficient strain Rut-C30. Chromatin rearrangement occurs in the xyr1 promoter during induction on sophorose. Chromatin opening and protein-DNA interactions in the xyr1 promoter were detected especially in a region located 0.9 kb upstream the translation start co-don, which bears several putative Cre1-binding sites and a CCAAT-box. Moreover, the xyr1 promoter is overall more acces-sible in a cre1-truncated background, no matter which carbon source is present. This makes the xyr1 regulatory sequence a good target for promoter engineering aiming at the enhancement of cellulase production.
Keywords: Cellulases, Chromatin, Promoter, Trichoderma reesei, Rut-C30, Xyr1.
1. INTRODUCTION
The saprophytic ascomycete Trichoderma reesei (teleomorph Hypocrea jecorina [1]) is an industrially relevant microorganism due to its high capacity to secrete plant cell wall-degrading enzymes (PCWDE). These enzymes are applied in the food and textile, pulp and paper industry, and are a bottleneck for the cost-efficient production of second-generation biofuels. Details on applications of T. reesei enzymes are reviewed in [2, 3].
The expression of the PCWDE-encoding genes in T. reesei is controlled in large part by two transcriptions factors, i.e. the main transactivator Xyr1 and the mediator of carbon catabolite repression (CCR), Cre1. Xyr1 is a Zn2Cys6 binuclear cluster protein essential for expression of both, xylanases and cellulases [4]. It normally binds to 5’-GGC(A/T)3-3’-motifs [5] arranged as inverted repeats in the promoters regions of its target genes. On most carbon sources xyr1 is expressed at low levels, however, this can be induced by the disaccharide sophorose [6]. Within the Xyr1 regulon, the induction of the genes coding for the main cellulases (i.e. cbh1 and cbh2) is directly associated with the extent of induction of xyr1 expression, which is not observed for the other target genes of Xyr1 [6].
Cre1 is a C2H2-type zinc finger protein that binds to the consensus sequence 5′-SYGGRG-3′ [7]. In the presence of D-glucose, Cre1 mediates CCR in a double-lock mechanism by directly repressing the expression of some PCWDE-encoding genes [8, 9], and also the expression of xyr1 itself [10]. It should be noted that the deletion of cre1 in order to circumvent CCR is not a useful strategy. This deletion causes strong pleiotropic effects, i.e. a cre1 deletion strain is strongly reduced in growth and therefore not convenient for industrial applications.
However, a strain suitable for industrial applications was derived from the T. reesei wild-type isolate QM6a by three rounds of mutagenesis. This strain, Rut-C30, was selected for high cellulase production and turned out to be released from Cre1-mediated CCR [11-13]. In total, Rut-C30 lacks over 100 kb of genomic DNA compared to the wild-type strain. In detail, it bears 15 small insertions, 223 point mutations, and 18 deletions [14, 15]. For example, an 83 kb large region containing 29 genes is missing in Rut-C30 [16, 17]. An important feature of Rut-C30 is the presence of a truncated form of the Carbon catabolite repressor 1 (Cre1-96, [7]). Cre1-96 contains only one of the two zinc finger motifs [18], however, it is still able to bind DNA [19]. This truncation does not only result in release from CCR, but additionally has a positive regulatory influence on the expression of target genes [19]. Notably, most industrially used strains originate from Rut-C30 [6, 14].
Despite the intense efforts to investigate the molecular mechanism underlying the regulation of cellulase production in T. reesei (reviewed in [20]), the mechanism of activation of gene expression is still not fully understood. Especially, information about the activation of expression of the xyr1 gene is scarce. The same is true for possible additional levels of gene regulation within the Xyr1 regulon, such as chromatin remodeling. The upstream regulatory regions (URR) of the cellulase-encoding genes cbh1 and cbh2 have been previously subjects in studies focusing on nucleosome positioning and chromatin remodeling in response to different carbon sources. Former reports pointed towards Cre1 as an important factor in influencing chromatin packaging during repressing conditions [19, 21, 22]. During this study we investigated the chromatin accessibility status of the xyr1, cbh1, and cbh2 promoter under repressing and inducing conditions. We aimed to learn more about the xyr1 promoter architecture and the impact on the cellulase expression in a comparative study including Rut-C30 and the wild-type strain.
2. MATERIALS AND METHODS
2.1. Fungal Strains
The following T. reesei strains were used throughout this study: the wild-type strain QM6a (ATCC 13631) and the carbon catabolite derepressed strain Rut-C30 (ATCC 56765). Both strains were maintained on malt extract agar.
2.2. Growth Conditions
For carbon source replacement experiments mycelia were pre-cultured in 1-l Erlenmeyer flasks on a rotary shaker (180 rpm) at 30 °C for 24 h in 250 ml of Mandels-Andreotti (MA) medium [23] supplemented with 1 % (w/v) glycerol as sole carbon source. A total of 109 conidia per litre (final concentration) were used as inoculum. Pre-grown mycelia were washed and equal amounts were resuspended in 20 ml MA media containing 1 % (w/v) D-glucose or 2 mM sophorose or no carbon source, respectively, and were incubated for 3 h. Samples were derived from three biological replicates and were pooled before RNA extraction and chromatin digestion.
2.3. Analysis of Transcript Levels
Fungal mycelia were homogenized in 1 ml of peqGOLDTriFast DNA/RNA/protein purification system reagent (PEQLAB Biotechnologie, Erlangen, Germany) using a FastPrep(R)-24 cell disrupter (MP Biomedicals, Santa Ana, CA, USA). RNA was isolated according to the manufacturer’s instructions, and the concentration was measured using the NanoDrop 1000 (Thermo Scientific, Waltham, US). Synthesis of cDNA from mRNA was carried out using the RevertAidTM H Minus First Strand cDNA Synthesis Kit (Thermo Scientific, Waltham, USA) according to the manufacturer’s instructions. Quantitative, reverse transcription PCRs (RT-qPCRs) were performed in a Rotor-Gene Q system (Qiagen, Hilden, Germany). All reactions were performed in triplicates. The reaction mixture (final volume 15 µl) contained 7.5 µl 2 x iQ SYBR Green Mix (Bio-Rad, Hercules, USA), 100 nM forward and reverse primer and 2.5 µl cDNA (diluted 1:20). Primer sequences are provided in (Table 1). Cycling conditions and control reactions were performed as described previously [24]. Data normalization using sar1 and act as reference genes and calculations were performed as published previously [24].
Table 1.
Oligonucleotides used throughout this study.
| Name | Sequence (5, -3, ) | Usage |
|---|---|---|
| Actfw | TGAGAGCGGTGGTATCCACG | RT-qPCR |
| Actrev | GGTACCACCAGACATGACAATGTTG | RT-qPCR |
| sar1fw | TGGATCGTCAACTGGTTCTACGA | RT-qPCR |
| sar1rev | GCATGTGTAGCAACGTGGTCTTT | RT-qPCR |
| cbh1f | GATGATGACTACGCCAACATGCTG | RT-qPCR |
| cbh1r | ACGGCACCGGGTGTGG | RT-qPCR |
| cbh2f | CTATGCCGGACAGTTTGTGGTG | RT-qPCR |
| cbh2r | GTCAGGCTCAATAACCAGGAGG | RT-qPCR |
| xyr1f | CCCATTCGGCGGAGGATCAG | RT-qPCR |
| xyr1r | CGAATTCTATACAATGGGCACATGGG | RT-qPCR |
| epiactinTr_f | CTTCCCTCCTTTCCTCCCCCTCCAC | act CHART, region -226 to +24 |
| epiactinTr_r | GCGACAGGTGCACGTACCCTCCATT | act CHART, region -226 to +24 |
| episar1Tr_f | GTCAGGAAATGCCGCACAAGCAAGA | sar1 CHART, region -490 to -224 |
| episar1Tr_r | TGTGTTTTACCGCCTTGGCCTTTGG | sar1 CHART, region -490 to -224 |
| epixyr1_1Tr_f | CCTTTGGCCATCTACACAAGAGCAA | xyr1 CHART, region -1038 to -742 |
| epixyr1_1Tr_r | CGCAATTTTTATTGCTGTTCGCTTC | xyr1 CHART, region -1038 to -742 |
| epixyr1_2Tr_f | CCGACAGCAGCAGTAGTCAGGTTTT | xyr1 CHART, region -216 to +35 |
| epixyr1_2Tr_r | TAGGCAGAATAGCGACGGAGAGGAT | xyr1 CHART, region -216 to +35 |
| epicbh1_1Tr_f | AAGGGAAACCACCGATAGCAGTGTC | cbh1 CHART, region -902 to -610 |
| epicbh1_1Tr_r | TTTCACTTCACCGGAACAAACAAGC | cbh1 CHART, region -902 to -610 |
| epicbh1_2Tr_f | TTTCACTTCACCGGAACAAACAAGC | cbh1 CHART, region -301 to -27 |
| epicbh1_2Tr_r | GGTTTCTGTGCCTCAAAAGATGGTG | cbh1 CHART, region -301 to -27 |
| epicbh2_1Tr_f | CGGATCTAGGGCAGACTGGGCATTG | cbh2 CHART, region -587 to -338 |
| epicbh2_1Tr_r | GTGTAGTGTTGCGCTGCACCCTGAG | cbh2 CHART, region -587 to -338 |
| epicbh2_2Tr_f | TGCAGCGCAACACTACACGCAACAT | cbh2 CHART, region -355 to -62 |
| epicbh2_2Tr_r | TGCGCCTCATACAGGGTCACAGTCC | cbh2 CHART, region -355 to -62 |
| RG161 | [6-FAM]AGGAGGAGCACGAACTGGACCGCAA | xyr1 URR iv fp, fwd |
| RG162 | [6-FAM]GACACGACCAGAGAGCTCCATCATGG | xyr1 URR iv fp, rev |
| RG149 | [6-FAM]CCTGCTCAGAGCTTGGCGCGATTTC | xyr1 core region iv fp, fwd |
| RG150 | [6-FAM]TCGGGGTAGGCAGAATAGCGACGGA | xyr1 core region iv fp, rev |
2.4. Chromatin Accessibility Real-time PCR (CHART-PCR)
DNase I digestion of chromatin and quantitative PCR (qPCR) analysis were carried out as described before [19]. qPCR analysis of the DNase I-treated samples was performed to measure the relative abundance of target regions. PCRs were performed in triplicates in a Rotor-Gene Q system (Qiagen) using the reaction mixture (final volume 20 μl) and cycling conditions described before [19]. Primer sequences are provided in (Table 1). The amount of intact input DNA of each sample was calculated by comparing the threshold values of the PCR amplification plots with a standard curve generated for each primer set using serial dilutions of genomic, undigested DNA. The chromatin accessibility index (CAI) was defined as: CAI = (Dc1+Dc2)/2Ds, where Ds is the amount of intact DNA detected for each target region and Dc1 and Dc2 are the amounts of intact DNA detected for the promoter regions of sar1 and act respectively, used as reference genes for normalization.
2.5. In Vivo Footprinting Analysis
In vivo methylation using dimethyl sulphate (DMS) followed by ligation-mediated PCR was performed as described previously [25]. Primer sequences are provided in (Table 1). The separation of fragments was performed by capillary gel electrophoresis (Microsynth, Balgach, Switzerland) and results were analyzed using the ivFAST program [25]. For the generation of the landscape visualization, the data sets of the coding and non-coding strand were combined, for each base pair the mean of the output value of this base pair and of the four adjacent base pairs was calculated, obtained mean values were converted to logarithmic scale, and given as the protein-DNA interaction index (PDI). In the case of no difference between compared conditions, termed 'n/a' in the ivFAST data output file, the value was set to 0.
3. RESULTS
3.1. Higher xyr1 Expression Corresponds to Higher Chromatin Accessibility in the xyr1 Promoter
We were interested to what extent chromatin accessibility of the xyr1 promoter is linked to the transcript levels of xyr1. Therefore, we subjected the wild-type strain QM6a and Rut-C30 to a carbon source replacement experiment. After pre-growing both strains in MA medium containing glycerol, the obtained mycelia were transferred to MA medium containing sophorose (inducing condition), D-glucose (repressing condition) or no carbon source (reference condition) and were incubated for 3 h. First, CHART-PCR was employed to investigate the chromatin packaging of two xyr1 promoter regions: the core promoter (position -216 to +35) bearing the TATA-box, and a putative URR (position -1038 to -742) bearing five Cre1-binding sites (positions -872, -878, -945, -963, and -972) and a CCAAT-box (-995, [26]) (Fig. 1A). Complementary, the expression of xyr1 was investigated by RT-qPCR in order to evaluate its relation to chromatin accessibility. The expression of xyr1 is equally induced on sophorose in the two strains, whereas D-glucose represses
Fig. (1).
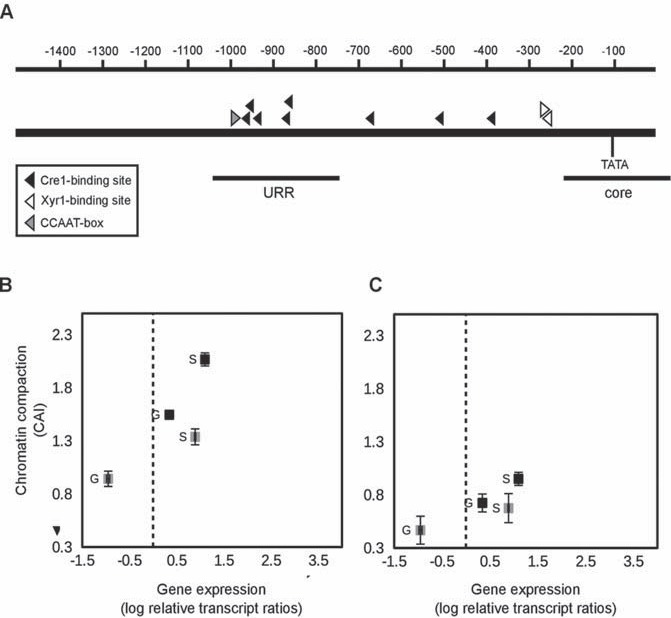
Chromatin status and gene expression of xyr1 in the wild-type strain and Rut-C30. (A) The promoter of xyr1 is schematically represented. The scale at the top indicates the distance from the start codon in bp. Black bars indicate the positions of the core region (core) and the URR (URR) investigated by CHART-PCR. Triangles indicate cis elements. For CHART-PCR of the URR (B) and the core promoter (C) and xyr1 transcript analysis (B, C) the T. reesei wild-type strain (grey squares) and Rut-C30 (black squares) were pre-grown on glycerol and thereafter incubated on D-glucose (G) or sophorose (S) for 3 h. CHART-PCR was performed by DNase I digestion followed by qPCR, and chromatin accessibility indices (CAIs) are depicted on the y-axis. The gene expression analysis was performed by cDNA synthesis followed by qPCR, and transcript levels are depicted on the x-axis. The dashed line indicates transcript level of the reference condition (wildtype strain, no carbon source, 3 h). sar1 and act genes were used for data normalization. All values are means from measurements in triplicates and three biological replicates. Error bars indicate standard deviations. Diagrams are identically scaled.
xyr1 expression only in the wild-type strain (Fig. 1B, C). In both strains, the induced xyr1 transcript formation on sophorose went along with a more open chromatin status compared to D-glucose. This could be found in the investigated URR (Fig. 1B) and in the core promoter (Fig. 1C). However, a comparison of the strains under the same condition (i.e. D-glucose repression or sophorose-mediated induction) revealed that the chromatin is in all cases more accessible in Rut-C30 (Fig. 1B, C). This indicates a generally more accessible xyr1 promoter in Rut-C30 than in the wild-type strain.
3.2. A Condition-specific Predisposition for DNA Occupancy in the URR of the xyr1 Promoter is Lost in Rut-C30
The observed, strain-specific differences in chromatin compaction of the xyr1 promoter prompted us to perform a detailed investigation of the DNA accessibility. To this end, in vivo footprinting analyses of an URR and the core promoter region were performed to identify differences in protein-DNA interaction patterns. Again, both strains were subjected to a carbon source replacement experiment as described above, followed by DMS-induced in vivo methylation. We could detect high DNA occupancy signals in the vicinity of the TATA-box, indicating a highly active transcription of xyr1 in both strains during sophorose induction (Fig. 2B). This is in good accordance with the before observed sophorose-mediated induction of transcript formation (compare Fig. 1B, C). However, an overall analysis of the two regions resulted in different profiles for the two strains. Rut-C30 exhibited a repetitive signal appearance along the two analyzed regions, indicating widespread differences in DNA accessibility on sophorose and D-glucose (Fig. 2A, B). In contrary, in the wild-type strain, the footprinting patterns turned out to differ between the two investigated xyr1 promoter regions. For the URR we detected a high number of strong signals indicating considerable increased protein-DNA interaction under inducing condition compared to repressing condition (Fig. 2A) while less and weaker signals were detected in the core promoter (Fig. 2B). Altogether, these data support the assumption of a generally higher chromatin accessibility within the xyr1 promoter in Rut-C30. It should be noted that we detected more and higher signals in the URR of QM6a than in the one of Rut-C30 (Fig. 2A). The increased chromatin accessibility in the URR of the wild-type strain might be necessary to result in the same high transcript levels of xyr1 during sophorose induction as in Rut-C30. Finally, we found that a single Xyr1-binding site (5’-GGCTAT-3’, position -265 on the non-coding strand) is occupied in both strains, with stronger signals for Rut-C30 (Fig. 2C). A second, non-canonical Xyr1-binding site (5’-GGGTTA-3’, position – 270 on the coding strand) close to the first one was detected.
Fig. (2).

In vivo foot printing analysis of the xyr1 promoter. The T. reesei wild-type strain (grey landscape) and Rut-C30 (black landscape) were pre-grown on glycerol and then incubated on D-glucose or sophorose for 3 h followed by DMS-induced in vivo methylation. An URR (A) and the core promoter (B) were investigated. Triangles indicate cis elements. Analysis of data was performed using ivFAST [25] followed by a landscape-like visualization. The relative protein-DNA-interaction indices (PDI) give differences between the in vivo footprinting patterns obtained on sophorose compared to D-glucose of one strain. The diagrams are identically scaled and are comparable amongst the two strains within one region. The scale at the top indicates distance from the start codon in bp. (C) Detailed in vivo footprint result for both strains of the region -279 to -255 bearing two overlapping Xyr1-binding sites (bold letters). Methylation differences between sophorose and D-glucose are represented by light grey (1.1- to 1.3-fold) and dark grey squares (more than 1.3-fold).
3.3. Expression of Cellulase-encoding Genes is Not Directly Influenced By the Promoter Chromatin Status During Early Induction
We observed a higher accessible chromatin status in the xyr1 promoter in Rut-C30 compared to the wild-type strain. To examine whether this is also present in the targets genes of Xyr1, we comparatively investigated the chromatin status of the core promoter and an URR of the cbh1 and cbh2 genes each. Complementary, we analyzed their transcript levels. In contrast to what was observed for xyr1, no remarkable differences in the chromatin status of the cbh1 (Fig. 3C, D) nor
Fig. (3).

Chromatin status and gene expression of cellulase-encoding genes in the wild-type strain and Rut-C30. The promoters of cbh1 (A) and cbh2 (B) are schematically represented. The scale at the top indicates the distance from the start codon in bp. Black bars indicate the positions of the core region (core) and the URR (URR) investigated by CHART-PCR. Triangles indicate cis elements. Carbon sourcespecifically positioned nucleosomes [21, 22] are indicated by ellipses. (C-F) The T. reesei wild-type strain (grey squares) and Rut-C30 (black squares) were pre-grown on glycerol and thereafter incubated on D-glucose (G) or sophorose (S) for 3 h. The URR (C, E) and the core promoter region (D, F) of the cbh1 (C, D) and cbh2 (E, F) genes were investigated each. CHART-PCR was performed by DNase I digestion followed by qPCR, and chromatin accessibility indices (CAIs) are depicted on the y-axis. The gene expression analysis was performed by cDNA synthesis followed by qPCR, and transcript levels are depicted on the x-axis. The dashed line indicates transcript level of the reference condition (wild-type strain, no carbon source, 3 h). sar1 and act genes were used for data normalization. All values are means from measurements in triplicates and three biological replicates. Error bars indicate standard deviations. Diagrams are identically scaled.
of the cbh2 (Fig. 3E, F) promoters could be detected between the two strains. Besides this, we detected a slight sophorose-specific chromatin opening for each strain compared to D-glucose (Fig. 3C-F). As expected, expression of both genes on D-glucose was partly released from CCR in Rut-C30. Transcript levels of cbh1 and cbh2 under inducing conditions were similar in both strains (Fig. 3Cand E), which fits to the before observed equal xyr1 transcript levels (compare Fig. 1B). Even if the above described results point to a relation between the chromatin status of the promoter and transcript formation in case of the xyr1 gene, the expression of the cbh1 and cbh2 genes during early induction seem to be rather a consequence of the levels of Xyr1 than influenced by the chromatin status of their own promoters.
4. DISCUSSION
It has recently been reported that chromatin remodeling is associated with gene expression of PCWDEs in T. reesei in dependence of the carbon source used [19, 21, 22]. Moreover, Xyr1 is absolutely required for activation of PCWDE-encoding genes since a xyr1 deletion fully abolishes their expression [4, 27]. However, up to now it remained completely unstudied whether chromatin remodeling is also influencing the expression of xyr1 itself, and thereby,
might influence PCWDE-encoding gene expression in an indirect way. We found that induction-specific opening of chromatin is a lot more pronounced in the xyr1 promoter than in those of the target genes, cbh1 and cbh2. In the case of xyr1 this chromatin opening goes hand in hand with higher gene expression, while for the target genes cbh1 and cbh2 the early induction is not directly related with opening of the chromatin. However, nucleosome positioning in cbh1 and cbh2 has previously been studied in T. reesei [21, 22]. Comparing the wild-type strain with cre1-deficient strains (including Rut-C30) revealed that in the latter no positioned nucleosomes are present in the coding region of cbh1 during cultivation on D-glucose. The authors also suggested a re-positioning of promoter nucleosomes during inducing condition. Another study reported that two nucleosomes downstream of an cbh2 activating element lose their positioning in a Cre1 positive background during induction, whereas Rut-C30 constitutively lacked strictly positioned nucleosomes on the cbh2 promoter under all conditions tested [22]. Both studies emphasize a possible role of Cre1 in organizing the local chromatin structure in cbh1 and cbh2 during repressing conditions. It was speculated that a loss of functional Cre1 results in a less dense chromatin structure during CCR. At first glance, the similar chromatin compaction in the wild-type strain and Rut-C30 on D-glucose, which was observed during this study, seem to contradict these earlier studies. However, considering the time frame of the experiments, they turn out to be complementary. The previous nucleosome mapping in cbh1 was investigated in a time course experiment by direct cultivation of the strains [21], and data for cbh2 were obtained from longer incubation times after the carbon source replacement [22]. As we investigated the chromatin status already after 3 h, it is likely that chromatin remodeling had only influenced the transactivator-encoding gene expression. This led to enough available Xyr1 that consecutively positively influenced the expression of cbh1 and cbh2. This conclusion is in accordance with the previously reported strict dependence of gene expression of cbh1 and cbh2 on the level of xyr1 [6]. We suppose that the previously observed chromatin remodeling in the promoters of the target genes (chb1 and cbh2) takes place during later cultivation stages. The authors would even suggest that Xyr1 then even contributes to a chromatin opening in the URR of cellulase-encoding genes since recently obtained data support this hypothesis (Mello-de-Sousa et al., 2015, unpublished data).
Notably, we found that a cre1 truncation background contributes to higher xyr1 expression that goes along with chromatin opening regardless the condition employed. The increased accessibility of chromatin in Rut-C30 was verified by in vivo footprinting. During this experiment we detected a canonical Xyr1-binding site next to a non-canonical site in the xyr1 promoter. It should be mentioned that previous in vivo footprinting analyses also detected active non-canonical Xyr1-binding sites (bearing up to two mismatches) in the cbh2 and xyn2 promoters [25]. The occuring Xyr1 double binding site (typically arranged as an inverted repeat) in the xyr1 promoter points towards an eventual autoregulatory mechanism. According to the in vivo footprinting analysis this Xyr1-binding motif is stronger contactedRut-C30. This would allow more available Xyr1 in Rut-C30, which might explain the observed differences between the strains on sophorose.
In the case of D-glucose the strongest differences in chromatin accessibility between Rut-C30 and wild-type strain were observed for the xyr1 URR. This region bears five putative Cre1-binding sites and a CCAAT-box. The close position of the 5’-SYGGRG-3’ motifs to each other and the strong signals detected in the wild-type strain point to an occupation by Cre1. This is a likely explanation for the more compact chromatin status observed in the wild-type strain on D-glucose. The presence of a CCAAT-box reinforces the importance of this region since the interaction of this cis element with the HAP2/3/5 complex is required for chromatin remodeling and full transcriptional activation of cbh2 [22, 28]. In vivo footprinting analysis carried out in this study highlighted strong protein-DNA interactions in both strains at this motif during sophorose induction.
5. CONCLUSION
The investigation of chromatin accessibility of the xyr1, cbh1, and cbh2 promoters revealed that during early induction chromatin rearrangement targets primary the xyr1 promoter. An upstream regulatory region in the xyr1 promoter was detected to be an important target of chromatin opening, probably involving regulation by Cre1 interaction and the protein complex HAP2/3/5. Consequently, the xyr1 promoter represents a high potential target for strain engineering and employing approaches involving heterochromatin control of gene expression.
CONFLICT OF INTEREST
The author(s) confirm that this article content has no conflict of interest.
ACKNOWLEDGEMENTS
TMMS participated in conception of the study, performed CHART-PCR, transcript analyses, and drafted the manuscript. AR participated in conception of the landscape visualization of the in vivo footprinting data and carried out the footprinting analyses. CD participated in conception of the landscape visualization of the in vivo footprinting data and revision of the manuscript. RLM and MJPF participated in conception of the study and revision of the manuscript. ARMA participated in conception of the study, supervision of experiments, and revision of the manuscript. All authors read and approved the final manuscript. This work was supported by two grants from the Austrian Science Fund (FWF): V232-B20, P24851 given to ARMA, and by a doctoral program of Vienna University of Technology (“CatMat”).
LIST OF ABBREVIATIONS
- CAI =
Chromatin accessibility index
- CCR =
Carbon catabolite repression
- CHART-PCR =
Chromatin accessibility real-time PCR
- Cre1 =
Carbon catabolite repressor 1
- DMS =
Dimethyl sulphate
- MA =
Mandels Andreotti
- PCWDEs =
Plant cell wall-degrading enzymes
- PDI =
Protein-DNA interaction index
- qPCR =
Quantitative PCR
- RT-qPCR =
Quantitative, reverse transcription PCR
- URR =
Upstream regulatory region
- Xyr1 =
Xylanase regulator 1
REFERENCES
- 1.Kuhls K., Lieckfeldt E., Samuels G.J., Kovacs W., Meyer W., Petrini O., Gams W., Börner T., Kubicek C.P. Molecular evidence that the asexual industrial fungus Trichoderma reesei is a clonal derivative of the ascomycete Hypocrea jecorina. Proc. Natl. Acad. Sci. USA. 1996;93(15):7755–7760. doi: 10.1073/pnas.93.15.7755. [DOI] [PMC free article] [PubMed] [Google Scholar]
- 2.Chundawat S.P., Beckham G.T., Himmel M.E., Dale B.E. Deconstruction of lignocellulosic biomass to fuels and chemicals. Annu. Rev. Chem. Biomol. Eng. 2011;2:121–145. doi: 10.1146/annurev-chembioeng-061010-114205. [DOI] [PubMed] [Google Scholar]
- 3.Viikari L., Vehmaanperä J., Koivula A. Lignocellulosic ethanol: From science to industry. Biomass Bioenergy. 2012;46(0):13–24. doi: 10.1016/j.biombioe.2012.05.008. [DOI] [Google Scholar]
- 4.Stricker A.R., Grosstessner-Hain K., Würleitner E., Mach R.L. Xyr1 (xylanase regulator 1) regulates both the hydrolytic enzyme system and D-xylose metabolism in Hypocrea jecorina. Eukaryot. Cell. 2006;5(12):2128–2137. doi: 10.1128/EC.00211-06. [DOI] [PMC free article] [PubMed] [Google Scholar]
- 5.Furukawa T., Shida Y., Kitagami N., Mori K., Kato M., Kobayashi T., Okada H., Ogasawara W., Morikawa Y. Identification of specific binding sites for XYR1, a transcriptional activator of cellulolytic and xylanolytic genes in Trichoderma reesei. Fungal Genet. Biol. 2009;46(8):564–574. doi: 10.1016/j.fgb.2009.04.001. [DOI] [PubMed] [Google Scholar]
- 6.Derntl C., Gudynaite-Savitch L., Calixte S., White T., Mach R.L., Mach-Aigner A.R. Mutation of the Xylanase regulator 1 causes a glucose blind hydrolase expressing phenotype in industrially used Trichoderma strains. Biotechnol. Biofuels. 2013;6(1):62. doi: 10.1186/1754-6834-6-62. [DOI] [PMC free article] [PubMed] [Google Scholar]
- 7.Strauss J., Mach R.L., Zeilinger S., Hartler G., Stöffler G., Wolschek M., Kubicek C.P. Cre1, the carbon catabolite repressor protein from Trichoderma reesei. FEBS Lett. 1995;376(1-2):103–107. doi: 10.1016/0014-5793(95)01255-5. [DOI] [PubMed] [Google Scholar]
- 8.Mach R.L., Strauss J., Zeilinger S., Schindler M., Kubicek C.P. Carbon catabolite repression of xylanase I (xyn1) gene expression in Trichoderma reesei. Mol. Microbiol. 1996;21(6):1273–1281. doi: 10.1046/j.1365-2958.1996.00094.x. [DOI] [PubMed] [Google Scholar]
- 9.Ilmén M., Onnela M.L., Klemsdal S., Keränen S., Pentilä M. Functional analysis of the cellobiohydrolase I promoter of the filamentous fungus Trichoderma reesei. Mol. Gen. Genet. 1998;257(3):386. doi: 10.1007/s004380050661. [DOI] [PubMed] [Google Scholar]
- 10.Mach-Aigner A.R., Pucher M.E., Steiger M.G., Bauer G.E., Preis S.J., Mach R.L. Transcriptional regulation of xyr1, encoding the main regulator of the xylanolytic and cellulolytic enzyme system in Hypocrea jecorina. Appl. Environ. Microbiol. 2008;74(21):6554–6562. doi: 10.1128/AEM.01143-08. [DOI] [PMC free article] [PubMed] [Google Scholar]
- 11.Montenecourt B.S., Eveleigh D.E. Semiquantitative plate assay for determination of cellulase production by Trichoderma viride. Appl. Environ. Microbiol. 1977;33(1):178–183. doi: 10.1128/aem.33.1.178-183.1977. [DOI] [PMC free article] [PubMed] [Google Scholar]
- 12.Montenecourt B.S., Eveleigh D.E. Preparation of mutants of Trichoderma reesei with enhanced cellulase production. Appl. Environ. Microbiol. 1977;34(6):777–782. doi: 10.1128/aem.34.6.777-782.1977. [DOI] [PMC free article] [PubMed] [Google Scholar]
- 13.Montenecourt B., Eveleigh D. Selective Screening Methods for the Isolation of High Yielding Cellulase Mutants of Trichoderma reesei. In: Brown R, L J., editors. Hydrolysis of cellulose: mechanisms of enzymatic and acid catalysis. American Chemical Society; 1979. pp. 289–301. [Google Scholar]
- 14.Peterson R., Nevalainen H. Trichoderma reesei RUT-C30--thirty years of strain improvement. Microbiology. 2012;158(Pt 1):58–68. doi: 10.1099/mic.0.054031-0. [DOI] [PubMed] [Google Scholar]
- 15.Le Crom S., Schackwitz W., Pennacchio L., Magnuson J.K., Culley D.E., Collett J.R., Martin J., Druzhinina I.S., Mathis H., Monot F., Seiboth B., Cherry B., Rey M., Berka R., Kubicek C.P., Baker S.E., Margeot A. Tracking the roots of cellulase hyperproduction by the fungus Trichoderma reesei using massively parallel DNA sequencing. Proc. Natl. Acad. Sci. USA. 2009;106(38):16151–16156. doi: 10.1073/pnas.0905848106. [DOI] [PMC free article] [PubMed] [Google Scholar]
- 16.Seidl V., Gamauf C., Druzhinina I.S., Seiboth B., Hartl L., Kubicek C.P. The Hypocrea jecorina (Trichoderma reesei) hypercellulolytic mutant RUT C30 lacks a 85 kb (29 gene-encoding) region of the wild-type genome. BMC Genomics. 2008;9:327. doi: 10.1186/1471-2164-9-327. [DOI] [PMC free article] [PubMed] [Google Scholar]
- 17.Vitikainen M., Arvas M., Pakula T., Oja M., Penttilä M., Saloheimo M. Array comparative genomic hybridization analysis of Trichoderma reesei strains with enhanced cellulase production properties. BMC Genomics. 2010;11:441. doi: 10.1186/1471-2164-11-441. [DOI] [PMC free article] [PubMed] [Google Scholar]
- 18.Ilmén M., Thrane C., Penttilä M. The glucose repressor gene cre1 of Trichoderma: isolation and expression of a full-length and a truncated mutant form. Mol. Gen. Genet. 1996;251(4):451–460. doi: 10.1007/BF02172374. [DOI] [PubMed] [Google Scholar]
- 19.Mello-de-Sousa T.M., Gorsche R., Rassinger A., Poças-Fonseca M.J., Mach R.L., Mach-Aigner A.R. A truncated form of the Carbon catabolite repressor 1 increases cellulase production in Trichoderma reesei. Biotechnol. Biofuels. 2014;7(1):129. doi: 10.1186/s13068-014-0129-3. [DOI] [PMC free article] [PubMed] [Google Scholar]
- 20.Stricker A.R., Mach R.L., de Graaff L.H. Regulation of transcription of cellulases- and hemicellulases-encoding genes in Aspergillus niger and Hypocrea jecorina (Trichoderma reesei). Appl. Microbiol. Biotechnol. 2008;78(2):211–220. doi: 10.1007/s00253-007-1322-0. [DOI] [PubMed] [Google Scholar]
- 21.Ries L., Belshaw N.J., Ilmén M., Penttilä M.E., Alapuranen M., Archer D.B. The role of CRE1 in nucleosome positioning within the cbh1 promoter and coding regions of Trichoderma reesei. Appl. Microbiol. Biotechnol. 2014;98(2):749–762. doi: 10.1007/s00253-013-5354-3. [DOI] [PubMed] [Google Scholar]
- 22.Zeilinger S., Schmoll M., Pail M., Mach R.L., Kubicek C.P. Nucleosome transactions on the Hypocrea jecorina (Trichoderma reesei) cellulase promoter cbh2 associated with cellulase induction. Mol. Genet. Genomics. 2003;270(1):46–55. doi: 10.1007/s00438-003-0895-2. [DOI] [PubMed] [Google Scholar]
- 23.Mandels M. Applications of cellulases. Biochem. Soc. Trans. 1985;13(2):414–416. doi: 10.1042/bst0130414. [DOI] [PubMed] [Google Scholar]
- 24.Steiger M.G., Mach R.L., Mach-Aigner A.R. An accurate normalization strategy for RT-qPCR in Hypocrea jecorina (Trichoderma reesei). J. Biotechnol. 2010;145(1):30–37. doi: 10.1016/j.jbiotec.2009.10.012. [DOI] [PubMed] [Google Scholar]
- 25.Gorsche R., Jovanovic B., Gudynaite-Savitch L., Mach R.L., Mach-Aigner A.R. A highly sensitive in vivo footprinting technique for condition-dependent identification of cis elements. Nucleic Acids Res. 2014;42(1):e1. doi: 10.1093/nar/gkt883. [DOI] [PMC free article] [PubMed] [Google Scholar]
- 26.Mantovani R. A survey of 178 NF-Y binding CCAAT boxes. Nucleic Acids Res. 1998;26(5):1135–1143. doi: 10.1093/nar/26.5.1135. [DOI] [PMC free article] [PubMed] [Google Scholar]
- 27.Stricker A.R., Steiger M.G., Mach R.L. Xyr1 receives the lactose induction signal and regulates lactose metabolism in Hypocrea jecorina. FEBS Lett. 2007;581(21):3915–3920. doi: 10.1016/j.febslet.2007.07.025. [DOI] [PubMed] [Google Scholar]
- 28.Zeilinger S., Mach R.L., Kubicek C.P. Two adjacent protein binding motifs in the cbh2 (cellobiohydrolase II-encoding) promoter of the fungus Hypocrea jecorina (Trichoderma reesei) cooperate in theinduction by cellulose. J. Biol. Chem. 1998;273(51):34463–34471. doi: 10.1074/jbc.273.51.34463. [DOI] [PubMed] [Google Scholar]