

Abstract
Background
Sedentary behavior is associated with increased risk of functional decline and disability. Individuals with rheumatoid arthritis (RA) spend more time sedentary than healthy adults. Self-reported assessment of sedentary behavior has not been well-developed in this patient population.
Methods
172 adults with RA wore an accelerometer for 7 days and completed a modified version of the Yale Physical Activity Survey (YPAS). YPAS-derived sedentary estimates included 1) daily sitting categories (<3, 3 to 6, 6 to 8, >8 hours/day), 2) continuous daily sedentary time calculated by subtracting hours spent sleeping or in physical activity from a 24-hour day, and 3) rank order of YPAS-derived continuous daily sedentary time. Each estimate was compared with objective accelerometer-derived sedentary time using linear regression and Bland-Altman analysis.
Results
A significant relationship was observed between accelerometer-derived sedentary time and all 3 estimates. Bland-Altman plot demonstrated systematic bias, however Bland-Altman plot of rank-order demonstrated that the ranked YPAS-derived continuous estimate was an unbiased predictor of ranked accelerometer sedentary time though limits of agreement were wide.
Conclusions
This patient-reported approach using the YPAS shows promise to be a useful tool to identify the most sedentary patients. Providing a practical and accurate tool may increase the frequency sedentary behavior is assessed by clinicians.
Keywords: accelerometry, sedentary behavior, clinical research, measurement, chronic disease, instrument psychometrics
Sedentary lifestyle is hazardous to health, contributing to obesity, cardiovascular disease,1 mental illness,2,3 and hypertension.4 Yet Americans are more sedentary than ever before,5 spending half of their waking time in sedentary pursuits. Sedentary behavior is defined as any waking behavior characterized by an energy expenditure ≤1.5 METs while in a sitting or reclining posture, for example watching television, and operationally defined as time spent at low activity counts on an accelerometer, such as <100 counts/minute.6 Individuals with rheumatoid arthritis (RA) have been shown to be more sedentary than healthy adults7 further increasing their risk for health problems.
Despite the substantial health risks, sedentary behavior is not commonly addressed during clinical encounters8 perhaps in part because of limited ability to measure sedentary behavior. Currently, sedentary behavior is frequently measured in the research setting via accelerometer. Inclinometers, which measure change in posture, are another option. Both of these tools are expensive and place a large burden on patients, though they are more practical than direct observation.9 A self-reported instrument would allow clinicians to easily identify the most sedentary patients who might benefit from an intervention to decrease sedentary time. No questionnaires assessing sedentary activity, to our knowledge, have been successfully validated in rheumatic disease populations. One promising possibility is the Yale Physical Activity Survey (YPAS) sitting score, which correlated with accelerometer-derived sedentary behavior in older adults.10 The YPAS has been validated to measure physical activity in persons with RA,11 but its validity to measure sedentary time in RA is yet to be examined. The purpose of this study is to examine the validity of the YPAS as a measure of subjective sedentary time compared with objective accelerometer-derived sedentary time in individuals with RA.
Methods
Study Population
This study analyzed baseline (preintervention) data from 172 individuals with RA who participated in the randomized clinical trial, Increasing Motivation for Physical Activity in Arthritis Clinical Trial (IMPAACT).12 This trial received approval from the Institutional Review Board and all participants provided written informed consent. As previously described, all participants were recruited from 2 clinical practices at a single academic medical center and met the American College of Rheumatology (ACR) criteria for RA.13 Inclusion criteria for participants were 1) aged 18 years or older, 2) able to ambulate at least 50 feet, 3) body mass index (BMI) <35 kg/m2, 4) cognitively intact and able to speak and understand English, 5) no comorbid condition that limited function more than RA (eg, peripheral vascular disease, spinal stenosis, residual lower extremity neuromuscular effects of stroke, or major signs or symptoms suggestive of pulmonary or cardiovascular disease), and 6) no contraindication to physical activity intervention due to comorbid conditions. Exclusion criteria were 1) planned total joint replacement in the subsequent 24 months or lower extremity total joint replacement in the past 12 months, 2) primary diagnosis of fibromyalgia, 3) inability to perform basic self-care activities, and 4) plans to relocate away from the Chicago area within 24 months.
Objectively Measured Sedentary Behavior
Participants were asked to wear an accelerometer for 7 days before their baseline clinic visit and “do what they would normally do in a typical week.” Physical activity was monitored using a GT1M ActiGraph accelerometer, a small uniaxial accelerometer that measures vertical acceleration and deceleration.14 Participants were given uniform scripted instructions to wear the unit on a belt at the natural waistline on the right hip in line with the right axilla upon arising in the morning and continuously until retiring at night, except during water activities, for 7 consecutive days. Accelerometer data were analytically filtered using validated methodology to identify nonwear periods (a period the monitor was potentially removed during the day) and days with sufficient wear time to be analyzed.15 To provide reliable estimates, we restricted analyses to participants with at least 4 valid days of accelerometer monitoring.5 Nonwear periods were defined as more than 90 minutes with 0 activity counts (allowing for 2 consecutive interrupted minutes with counts <100). A valid day of monitoring was defined as 10 or more wear hours in a 24-hour period, which was verified from accelerometer output. Accelerometer data were recorded as activity counts on a minute-by-minute basis (ie, weighted sum of the number of accelerations measured over 1 minute with the magnitude of the measured acceleration proportional to the weight). Sedentary behavior was identified by accelerometer activity counts/minute <100 over analytically confirmed wear time. Objective sedentary time was calculated as the average of the daily sedentary hours across the monitoring days.
Self-reported Sedentary Behavior
Following the week of accelerometer monitoring, participants completed a baseline interview which included the YPAS referencing the period they had worn the accelerometer.16 The YPAS consists of 38 items divided between 2 sections. In part 1 participants report how many minutes they spent performing each activity during the past week, including housework, yard work, exercise, and recreational activities. The values from this first section are used to calculate total daily activity time. Part 1 of the YPAS has established test-retest reliability.16
Part 2 of the YPAS asks participants to estimate daily time spent over the entire past month in vigorous physical activity, walking, standing, and sitting. To better help participants estimate sitting time (and therefore improve the accuracy), we modified part 2 by adding a question asking participants to estimate the average time they spent sleeping on a typical day. Sleep time was subtracted from a 24 hour day to provide participants with a balance from which they could then better estimate how much time they spent moving, sitting and standing. As time in each category of activity was estimated, it was then subtracted from the remaining ‘awake’ hours. At the end of this section of part 2, participants were allowed to reallocate time spent in each activity to best reflect an average day.
We used the results from the YPAS to estimate sedentary time in 2 ways. The first was the subjective sitting category from the categorical response to the ‘sitting’ question in part 2: choices included ‘not at all,’ ‘less than 3 hours,’ ‘3 to less than 6 hours,’ ‘6 to less than 8 hours,’ and ‘8+ hours per day.’ For the subjective continuous estimate, we combined reported time spent sleeping (from part 2) and total daily activity time, then subtracted that sum from 24 hours to arrive at the estimated number of hours of sedentary behavior.
Sample Descriptors
Upon enrollment, demographic information (age, sex, and race) was collected via telephone interview. BMI was calculated at the baseline visit using measured height and weight with normal weight considered a BMI less than 25 kg/m2, overweight BMI 25 to 30 kg/m2 and obese BMI greater than 30 kg/m2. Participants completed questionnaires assessing health status and disease activity. Disease activity score ranges from 1 (no disease) to 9 (most severe disease activity). Health Assessment Questionnaire (HAQ) Disability Index was used to measure function with a possible range of 0 (no disability) to 3 (complete disability). For HAQ pain scores, patients were asked to rate their pain over the past week using a visual analog scale ranging 0 (no pain) to 10 (very severe pain).17,18
Statistical Analysis
Self-reported sitting category was compared with objective accelerometer-derived total sedentary time. A continuous estimate of self-reported sedentary time calculated by subtracting hours reported as sleeping and physical activity from a 24-hour day was compared with objective accelerometer-derived sedentary time. Pearson and Spearman correlation coefficients were calculated between the continuous self-reported sedentary time estimates and accelerometer-derived sedentary time and between rank order of subjective and objective sedentary time. A Bland-Altman plot compared the agreement between subjective and objective sedentary time represented by the difference in self-reported and accelerometer-derived sedentary time (y-axis) versus the mean of the 2 measures of sedentary time (x-axis). Bland-Altman plots were also used to compare the agreement of the rank-order of subjective continuous sedentary time estimates versus objective accelerometer-derived sedentary time.
Results
The IMPAACT trial enrolled 185 individuals meeting the ACR criteria for RA. Excluded from this validation sample were 13 participants who had less than 4 days of valid accelerometer data. Demographic characteristics of the remaining 172 adults included in this validation study are described in Table 1. The mean age was 55 years with a range of 23 to 86 years. Eighty-three percent of the participants were female and 73% were Caucasian. The average BMI was 28 kg/m2 with 38% of participants classified as normal weight, 31% overweight, and 31% obese. Average disease duration was 13.4 years. The mean HAQ Disability Index was 0.69 and mean HAQ pain scores were 3.37. Disease activity score averaged 6.44. Table 2 includes accelerometer and YPAS data. 154 participants (89%) recorded 6 or 7 valid days of accelerometer monitoring with an average of 13.69 hours monitored per day. Participants had an average of 9.86 hours of sedentary time per day.
Table 1.
Participant Characteristics (N = 172)
| Mean (SD) or n (%) | |
|---|---|
| Sociodemographics | |
| Age (years) | 55.11 (13.91) |
| Gender (female) | 142 (82.56) |
| Race/Ethnicity | |
| Caucasian | 125 (72.67) |
| African American | 21 (12.21) |
| Other | 26 (15.12) |
| Health factors | |
| BMI (kg·m2) | 28.02 (6.74) |
| HAQ—Pain | 3.37 (2.19) |
| HAQ—Disability Index | 0.69 (0.71) |
| Disease duration (years) | 13.42 (10.16) |
| Disease activity score | 6.44 (7.97) |
Abbreviations: BMI, Body Mass Index; HAQ, Health Assessment Questionnaire.
Table 2.
Accelerometer and Yale Physical Activity Survey (YPAS) Data
| Mean (SD) or n (%) | |
|---|---|
| Objective accelerometer data | |
| Number of valid days | |
| 4 days | 5 (2.9) |
| 5 days | 13 (7.6) |
| 6 days | 25 (14.5) |
| 7 days | 129 (75.0) |
| Average daily monitored hours | 13.69 (1.85) |
| Average daily sedentary hours | 9.86 (1.38) |
| Subjective YPAS data | |
| Total daily activity hours | 3.64 (2.18) |
| Sleep duration in hours | 7.36 (1.26) |
| Average daily sedentary hours | 13.00 (2.59) |
Self-reported sitting category: Accelerometer-derived sedentary time was compared with the self-reported sit-time response category as shown in Figure 1. Fifty-three percent selected the longest daily sitting time category, over 8 hours a day, whereas 91% registered over 8 hours of accelerometer-derived sedentary time daily. There was substantial overlap in accelerometer-derived sedentary time in all 4 categories and the difference in mean accelerometer-derived sedentary time between groups was small. The average daily sedentary time was 9.4, 9.0, 10.0, and 10.2 hours respectively for categories <3, 3 to 6, 6 to 8, and ≥8 hours/day which represented a significant linear trend with increased objective sedentary time with increasing sitting category (P = .0044). The average sedentary time for those who selected ≥8 hours/day was 10.2 hours/day as compared with 9.5 hours/day for those who selected a category other than ≥8 hours/day (P = .002). Weighted Kappa demonstrated low agreement between self-reported sitting category and objective sedentary time (kappa = 0.06, 95% CI −0.007 to 0.13).
Figure 1.

Comparison of subjective YPAS sitting category and objective accelerometer-derived sedentary time (n = 172).
Self-reported continuous sedentary time estimate: We also calculated a continuous estimate of subjective sedentary time during waking hours. Figure 2 compares subjective versus objective accelerometer-based sedentary time. A significant linear relationship was found between the subjective continuous sedentary time estimate and the objective sedentary time (Pearson r = .29, 95% CI 0.15 to 0.42, P < .001). The slope of the line was 0.16. Bland-Altman analysis was used to evaluate for potential bias in the subjective continuous sedentary time estimate relative to objective sedentary time. Bland-Altman plots (Figure 3A) showed systematic bias indicated by the strongly sloping scatter plot of the differences with slope of −0.97, 95% CI −1.16 to −0.78. The limits of agreement demonstrated a mean difference of ± 4.0 hours/day. (An unbiased estimator would show random scatter around the horizontal line representing no difference).
Figure 2.
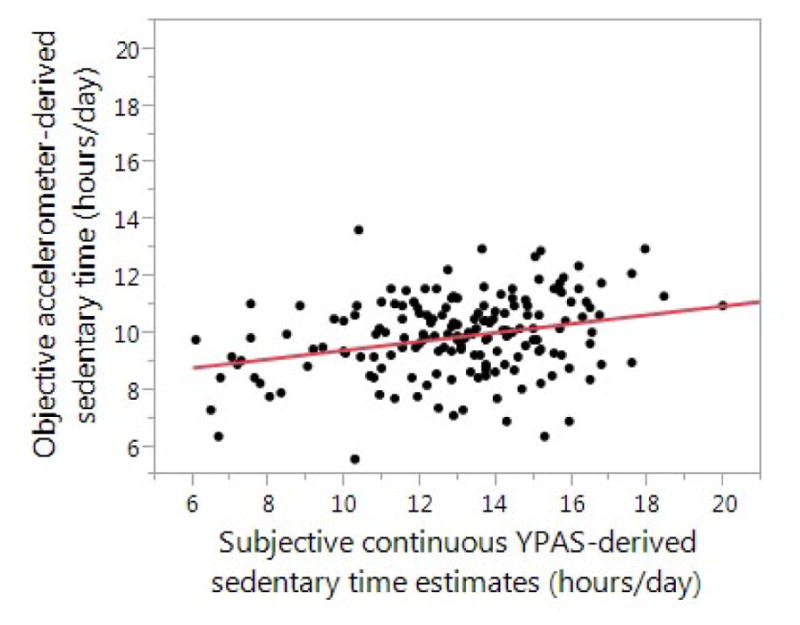
Comparison of subjective continuous YPAS-derived sedentary time estimate and objective accelerometer-derived sedentary time (n = 172)
Figure 3.

A. Modified Bland-Altman plot of objective accelerometer-derived sedentary time and subjective continuous YPAS-derived sedentary time differences (n = 172). Note. Solid line: estimate of slope = −0.97 (95% CI: −1.16 to −0.78). Dashed lines: limits of agreement = mean difference ± 4.0 hours/day. B. Modified Bland-Altman plot of objective rank order and YPAS-derived continuous estimate rank order (n = 172). Note. Solid line: estimate of slope = −0.00097 (95% CI: −0.23 to 0.23). Dashed lines: limits of agreement = mean difference ± 121.
Given the benefit of a significant linear trend but a biased estimator, we then evaluated if the continuous estimate of YPAS-derived sedentary time could be used to identify those individuals who were the most or least sedentary. Each participant was given a separate ranking based on the continuous estimate of sedentary time and the accelerometer-derived sedentary time. This again showed a significant linear relationship but substantial variability (Spearman r = .26, 95% CI 0.11 to 0.39, P < .001). Bland-Altman plot of rank-order (Figure 3B) demonstrated that the ranked YPAS-derived continuous estimate was an unbiased predictor of ranked accelerometer sedentary time with a slope of −0.001, 95% confidence limits −0.23, 0.23, limits of agreement ± 121. This plot was centered around 0 with those with the most and the least sedentary time very close to 0, while those with sedentary time reflecting the group mean were farther from 0. This demonstrates the ability of the continuous self-reported estimate of sedentary behavior to identify the most and the least sedentary individuals.
Discussion
In this study, we evaluated whether self-reported estimates of sedentary time derived from the YPAS correlated with objectively measured sedentary time for patients with RA. We used 3 self-reported approaches to estimate sedentary time: selection of 1 of 4 sitting time categories, a continuous estimate of sedentary time (derived from physical activity and sleep information), and rank of the continuous sedentary time estimate. While all 3 approaches showed a significant relationship between greater self-reported and objectively measured sedentary time, the final approach of ranked YPAS-derived sedentary time performed the best. The ranked YPAS-derived sedentary time was an unbiased predictor of ranked accelerometer sedentary time and was most accurate for identifying the most sedentary individuals.
Individuals with RA on average spend a larger percentage of their day in sedentary activities than healthy adults without a chronic disease.7 There is growing evidence of the deleterious effects of sedentary behavior.19 Sedentary behavior has been shown to be significantly associated with increased incidence of cardiovascular disease,1 weight gain,20 and hypertension.4 Sedentary time has also been shown to be detrimentally associated with cardio-metabolic biomarkers including triglycerides, markers of insulin resistance, and C-reactive protein.21 While there is no literature examining the consequences of excessive sedentary activity specifically in the RA population, individuals with RA are already at higher risk for cardiovascular and cerebrovascular disease than the general population.22 Thus the adverse consequences of excessive sedentary time are likely to be even greater and identifying individuals who spend the majority of their day in sedentary behavior to target for intervention is likely to pay off even more than for the average population.
Instruments which capture sitting information in categories were of initial interest because these questionnaires can be easily adopted in clinical practice if they accurately identify sedentary individuals. There is limited literature comparing sedentary behavior categorical outcomes with objective measurement. Gennuso and colleagues report on the validity of YPAS sitting categories in adults ages 65 years and older.10 They demonstrated a significant linear relationship between sitting responses with accelerometer-measured sedentary behavior, but agreement was low (κ = 0.0003). Similarly, Shuval and colleagues examined the Rapid Assessment Disuse Index (RADI) compared with accelerometer in adults ages 40 to 79 which included additional sitting time categories.23 A higher RADI score was correlated with greater sedentary time (ρ = 0.40), though the ability to detect patients with high levels of sedentary time was only fair (AUC = 0.72). Both of these results were consistent with our finding of a linear increase across the YPAS sitting categories but low agreement in this RA sample. In the current study, the categorical approach had compromised discriminatory ability due to the limited number of participants in this RA sample with less than 8 hours/day of accelerometer sedentary time. Including a sitting category of 8 to 12 hours and 12 or more hours a day may improve the ability to identify participants with the greatest sedentary time.
In addition to categorical sitting instruments, numerous instruments have been developed to assess self-reported sedentary behavior including short-term recalls and questionnaires.24,25 Some questionnaires, such as the short form of the International Physical Activity Questionnaire, use a question asking participants how long they sit each day,26 while other questionnaires use composite measures of time spent in different sedentary activities including TV-viewing, computer use, occupational sitting, etc.25,27 These self-reported measures have consistently been limited by poor validity and participants have generally underreported sedentary time. Questionnaires focused on sitting time are also likely to underestimate sedentary time either due to underreporting or by not accounting for activities not generally included specifically in the questionnaire (eg, eating or talking on the telephone).25,28 Matthews has discussed the cognitive demands required to estimate usual sedentary time and the difficulty of recalling routine daily activities that are performed in numerous small increments.29
These historical difficulties and the poor validity of instruments currently available motivated us to investigate new approaches to identify sedentary individuals. We tried a novel approach using self-reported physical activity and estimates of sleeping time. Although the resulting estimate of sedentary time was significantly related to accelerometer-assessed sedentary time, Modified Bland-Altman plots demonstrated that the continuous estimate was systematically biased. The calculation generally underestimated sedentary time for those who were least sedentary and overestimated sedentary time for the most sedentary individuals. However, the rank of the sedentary time estimate was unbiased and provided information to identify the most and the least sedentary individuals. Identifying the most sedentary individuals is clinically useful to target intervention appropriately.
Limitations to this study should be noted. Uniaxial accelerometers cannot detect posture to distinguish sitting or reclining from standing quietly. We can only estimate objective sedentary time during the hours participants wore the accelerometer. Self-reported physical activity may be hampered by recall difficulty, but the YPAS has documented validity for physical activity.11 Self-reported sleep recall can have low correlation with recorded sleep.30 In the current study, participants were assisted in accounting for sleep and activity totals over a 24 hour period to improve accuracy. It is also recognized that the YPAS is a lengthy questionnaire to complete. However, completing the questionnaire represents less time burden for participants than wearing an accelerometer for a week and completing a concurrent wear-time diary.
Clinicians frequently discuss physical activity with patients; however few visits incorporate sedentary behavior assessment and counseling.8 While little is known about physicians’ knowledge and attitudes about sedentary behavior, they may rarely address sedentary behavior because current guidelines focus only on physical activity. Infrequent screening may also be due, in part, to the lack of an available tool which would allow clinicians to identify patients with excessive sedentary time.
We have shown that a physical activity survey combined with a question about sleep can be used to identify the most sedentary patients with RA. A questionnaire may help clinicians focus on sedentary behavior in conjunction with physical activity and signal physician concern to patients. Increased frequency of screening for excessive sedentary time may result in better intervention targeting among these adults at elevated risk for serious health events. Future work is needed to identify a brief instrument for both patients and clinicians.
Acknowledgments
This study is supported in part by the National Institute for Arthritis and Musculoskeletal Diseases (grant no. T32 AR007611-13, R01-AR052912, P60 AR064464, and UL1 TR000150).
Contributor Information
Abigail L. Gilbert, Email: abigail.gilbert@northwestern.edu, Division of Rheumatology, Northwestern University Feinberg School of Medicine, Chicago, IL
Jungwha Lee, Dept of Preventive Medicine, Northwestern University Feinberg School of Medicine, Chicago, IL.
Madeleine Ma, Dept of Preventive Medicine, Northwestern University Feinberg School of Medicine, Chicago, IL.
Pamela A. Semanik, Dept of Physical Medicine and Rehabilitation, Northwestern University Feinberg School of Medicine, Chicago, IL
Loretta DiPietro, Dept of Exercise Science, George Washington University School of Public Health and Health Services, Washington, DC.
Dorothy D. Dunlop, Center for Healthcare Studies, Northwestern University, Chicago, IL
Rowland W. Chang, Dept of Preventive Medicine, Northwestern University Feinberg School of Medicine, Chicago, IL
References
- 1.Manson JE, Greenland P, LaCroix AZ, et al. Walking compared with vigorous exercise for the prevention of cardiovascular events in women. N Engl J Med. 2002;347(10):716–725. doi: 10.1056/NEJMoa021067. [DOI] [PubMed] [Google Scholar]
- 2.Sanchez-Villegas A, Ara I, Guillen-Grima F, Bes-Rastrollo M, Varo-Cenarruzabeitia JJ, Martinez-Gonzalez MA. Physical activity, sedentary index, and mental disorders in the SUN cohort study. Med Sci Sports Exerc. 2008;40(5):827–834. doi: 10.1249/MSS.0b013e31816348b9. [DOI] [PubMed] [Google Scholar]
- 3.Vallance JK, Winkler EA, Gardiner PA, Healy GN, Lynch BM, Owen N. Associations of objectively-assessed physical activity and sedentary time with depression: NHANES (2005–2006) Prev Med. 2011;53(4–5):284–288. doi: 10.1016/j.ypmed.2011.07.013. [DOI] [PubMed] [Google Scholar]
- 4.Beunza JJ, Martinez-Gonzalez MA, Ebrahim S, et al. Sedentary behaviors and the risk of incident hypertension: the SUN Cohort. Am J Hypertens. 2007;20(11):1156–1162. doi: 10.1016/j.amjhyper.2007.06.007. [DOI] [PubMed] [Google Scholar]
- 5.Troiano RP, Berrigan D, Dodd KW, Masse LC, Tilert T, McDowell M. Physical activity in the United States measured by accelerometer. Med Sci Sports Exerc. 2008;40(1):181–188. doi: 10.1249/mss.0b013e31815a51b3. [DOI] [PubMed] [Google Scholar]
- 6.Sedentary Behaviour Research N. Letter to the Editor. Standardized use of the terms ‘sedentary’ and ‘sedentary behaviours’. Appl Physiol Nutr Metab. 2012;37(3):540–542. doi: 10.1139/h2012-024. [DOI] [PubMed] [Google Scholar]
- 7.Prioreschi A, Hodkinson B, Avidon I, Tikly M, McVeigh JA. The clinical utility of accelerometry in patients with rheumatoid arthritis. Rheumatology (Oxford) 2013;52(9):1721–1727. doi: 10.1093/rheumatology/ket216. [DOI] [PubMed] [Google Scholar]
- 8.Shuval K, DiPietro L, Skinner CS, et al. ‘Sedentary behaviour counselling’: the next step in lifestyle counselling in primary care; pilot findings from the Rapid Assessment Disuse Index (RADI) study. Br J Sports Med. 2014;48(19):1451–1455. doi: 10.1136/bjsports-2012-091357. [DOI] [PMC free article] [PubMed] [Google Scholar]
- 9.Atkin AJ, Gorely T, Clemes SA, et al. Methods of measurement in epidemiology: sedentary behaviour. Int J Epidemiol. 2012;41(5):1460–1471. doi: 10.1093/ije/dys118. [DOI] [PMC free article] [PubMed] [Google Scholar]
- 10.Gennuso KP, Matthews CE, Colbert LH. Reliability and validity of two self-report measures to assess sedentary behavior in older adults. J Phys Act Health. 12(5):727–32. doi: 10.1123/jpah.2013-0546. 201. [DOI] [PMC free article] [PubMed] [Google Scholar]
- 11.Semanik P, Lee J, Manheim L, Dipietro L, Dunlop D, Chang RW. Relationship between accelerometer-based measures of physical activity and the Yale Physical Activity Survey in adults with arthritis. Arthritis Care Res (Hoboken) 2011;63(12):1766–1772. doi: 10.1002/acr.20644. [DOI] [PMC free article] [PubMed] [Google Scholar]
- 12.Chang RW, Semanik PA, Lee J, Feinglass J, Ehrlich-Jones L, Dunlop DD. Improving physical activity in arthritis clinical trial (IMPAACT): study design, rationale, recruitment, and baseline data. Contemp Clin Trials. 2014;39(2):224–35. doi: 10.1016/j.cct.2014.08.010. [DOI] [PMC free article] [PubMed] [Google Scholar]
- 13.Arnett FC, Edworthy SM, Bloch DA, et al. The American Rheumatism Association 1987 revised criteria for the classification of rheumatoid arthritis. Arthritis Rheum. 1988;31(3):315–324. doi: 10.1002/art.1780310302. [DOI] [PubMed] [Google Scholar]
- 14.Matthews CE, Ainsworth BE, Thompson RW, Bassett DR., Jr Sources of variance in daily physical activity levels as measured by an accelerometer. Med Sci Sports Exerc. 2002;34(8):1376–1381. doi: 10.1097/00005768-200208000-00021. [DOI] [PubMed] [Google Scholar]
- 15.Semanik P, Song J, Chang RW, Manheim L, Ainsworth B, Dunlop D. Assessing physical activity in persons with rheumatoid arthritis using accelerometry. Med Sci Sports Exerc. 2010;42(8):1493–1501. doi: 10.1249/MSS.0b013e3181cfc9da. [DOI] [PMC free article] [PubMed] [Google Scholar]
- 16.Dipietro L, Caspersen CJ, Ostfeld AM, Nadel ER. A survey for assessing physical activity among older adults. Med Sci Sports Exerc. 1993;25(5):628–642. doi: 10.1249/00005768-199305000-00016. [DOI] [PubMed] [Google Scholar]
- 17.Fries JF, Spitz P, Kraines RG, Holman HR. Measurement of patient outcome in arthritis. Arthritis Rheum. 1980;23(2):137–145. doi: 10.1002/art.1780230202. [DOI] [PubMed] [Google Scholar]
- 18.Bruce B, Fries JF. The Stanford Health Assessment Questionnaire: a review of its history, issues, progress, and documentation. J Rheumatol. 2003;30(1):167–178. [PubMed] [Google Scholar]
- 19.Thorp AA, Owen N, Neuhaus M, Dunstan DW. Sedentary behaviors and subsequent health outcomes in adults a systematic review of longitudinal studies, 1996–2011. Am J Prev Med. 2011;41(2):207–215. doi: 10.1016/j.amepre.2011.05.004. [DOI] [PubMed] [Google Scholar]
- 20.Coakley EH, Rimm EB, Colditz G, Kawachi I, Willett W. Predictors of weight change in men: results from the Health Professionals Follow-up Study. Int J Obes Relat Metab Disord. 1998;22(2):89–96. doi: 10.1038/sj.ijo.0800549. [DOI] [PubMed] [Google Scholar]
- 21.Healy GN, Matthews CE, Dunstan DW, Winkler EA, Owen N. Sedentary time and cardio-metabolic biomarkers in US adults: NHANES 2003–06. Eur Heart J. 2011;32(5):590–597. doi: 10.1093/eurheartj/ehq451. [DOI] [PMC free article] [PubMed] [Google Scholar]
- 22.Meune C, Touze E, Trinquart L, Allanore Y. High risk of clinical cardiovascular events in rheumatoid arthritis: levels of associations of myocardial infarction and stroke through a systematic review and meta-analysis. Arch Cardiovasc Dis. 2010;103(4):253–261. doi: 10.1016/j.acvd.2010.03.007. [DOI] [PubMed] [Google Scholar]
- 23.Shuval K, Kohl HW, 3rd, Bernstein I, et al. Sedentary behaviour and physical inactivity assessment in primary care: the Rapid Assessment Disuse Index (RADI) study. Br J Sports Med. 2014;48(3):250–255. doi: 10.1136/bjsports-2013-092901. [DOI] [PMC free article] [PubMed] [Google Scholar]
- 24.Healy GN, Clark BK, Winkler EA, Gardiner PA, Brown WJ, Matthews CE. Measurement of adults’ sedentary time in population-based studies. Am J Prev Med. 2011;41(2):216–227. doi: 10.1016/j.amepre.2011.05.005. [DOI] [PMC free article] [PubMed] [Google Scholar]
- 25.Gardiner PA, Clark BK, Healy GN, Eakin EG, Winkler EA, Owen N. Measuring older adults’ sedentary time: reliability, validity, and responsiveness. Med Sci Sports Exerc. 2011;43(11):2127–2133. doi: 10.1249/MSS.0b013e31821b94f7. [DOI] [PubMed] [Google Scholar]
- 26.Rosenberg DE, Bull FC, Marshall AL, Sallis JF, Bauman AE. Assessment of sedentary behavior with the International Physical Activity Questionnaire. J Phys Act Health. 2008;5(Suppl 1):S30–S44. doi: 10.1123/jpah.5.s1.s30. [DOI] [PubMed] [Google Scholar]
- 27.Marshall AL, Miller YD, Burton NW, Brown WJ. Measuring total and domain-specific sitting: a study of reliability and validity. Med Sci Sports Exerc. 2010;42(6):1094–1102. doi: 10.1249/MSS.0b013e3181c5ec18. [DOI] [PubMed] [Google Scholar]
- 28.Van Cauwenberg J, Van Holle V, De Bourdeaudhuij I, Owen N, Deforche B. Older adults’ reporting of specific sedentary behaviors: validity and reliability. BMC Public Health. 2014;14:734. doi: 10.1186/1471-2458-14-734. [DOI] [PMC free article] [PubMed] [Google Scholar]
- 29.Matthews CE, Moore SC, George SM, Sampson J, Bowles HR. Improving self-reports of active and sedentary behaviors in large epidemiologic studies. Exerc Sport Sci Rev. 2012;40(3):118–126. doi: 10.1097/JES.0b013e31825b34a0. [DOI] [PMC free article] [PubMed] [Google Scholar]
- 30.Girschik J, Fritschi L, Heyworth J, Waters F. Validation of self-reported sleep against Actigraphy. J Epidemiol. 2012;22(5):462–468. doi: 10.2188/jea.JE20120012. [DOI] [PMC free article] [PubMed] [Google Scholar]