

Use of heteroplasmic m.3243A > G primary fibroblast cells derived from a patient with the mitochondrial disease MELAS shows that ROS trigger vegetative segregation of heteroplasmy toward wild-type and mutant mitochondrial DNA homoplasmy via the formation of linear head-to-tail multimers (concatemers).
Abstract
Mitochondria that contain a mixture of mutant and wild-type mitochondrial (mt) DNA copies are heteroplasmic. In humans, homoplasmy is restored during early oogenesis and reprogramming of somatic cells, but the mechanism of mt-allele segregation remains unknown. In budding yeast, homoplasmy is restored by head-to-tail concatemer formation in mother cells by reactive oxygen species (ROS)–induced rolling-circle replication and selective transmission of concatemers to daughter cells, but this mechanism is not obvious in higher eukaryotes. Here, using heteroplasmic m.3243A > G primary fibroblast cells derived from MELAS patients treated with hydrogen peroxide (H2O2), we show that an optimal ROS level promotes mt-allele segregation toward wild-type and mutant mtDNA homoplasmy. Enhanced ROS level reduced the amount of intact mtDNA replication templates but increased linear tandem multimers linked by head-to-tail unit-sized mtDNA (mtDNA concatemers). ROS-triggered mt-allele segregation correlated with mtDNA-concatemer production and enabled transmission of multiple identical mt-genome copies as a single unit. Our results support a mechanism by which mt-allele segregation toward mt-homoplasmy is mediated by concatemers.
INTRODUCTION
Eukaryotic cells generally contain hundreds to thousands of copies of mitochondrial DNA (mtDNA). Mutations occur in mtDNA much more frequently than in nuclear genomic DNA; therefore the mitochondrial genome tends toward heteroplasmy, a state associated with mitochondrial disorders, aging, and various human diseases (Holt et al., 1988; Linnane et al., 1989; Wallace, 1994; Ozawa, 1997; Smeitink et al., 2006). In humans, one common heteroplasmic mtDNA mutation is the A-to-G transition at nucleotide position (np) 3243 (m.3243A > G), which forms stable heteroplasmy with wild-type mtDNA (Lehtinen et al., 2000; Raap et al., 2012) and causes mitochondrial myopathy, encephalopathy, lactic acidosis, and stroke-like episodes (MELAS) disease (Goto et al., 1990) and diabetes (Reardon et al., 1992; Kadowaki et al., 1994). The onset of pathogenic mtDNA-associated diseases depends on an increase in the ratio of mutant to wild-type mtDNA in specific tissues. Mechanisms underlying maintenance of (and alterations in) the proportion of mutant mtDNA in heteroplasmic cells are of considerable clinical importance; however, it remains unclear how mt-allele segregation occurs in higher eukaryotes.
Rapid segregation of mtDNA heteroplasmy to homoplasmy (in which all mtDNA copies have an identical sequence) occurs during early oogenesis in metazoan female germlines and is known as the bottleneck phenomenon (Cree et al., 2008; Khrapko, 2008; Wai et al., 2008). A similar phenomenon was observed during reprogramming of somatic cells (Fujikura et al., 2012). The dominant molecular species of human mtDNA is the circular monomer (one genome unit in size), which replicates by a θ-type mechanism and randomly assorts into sister cells. However, θ-type replication and inheritance cannot explain the rapid segregation of mt-alleles observed in heteroplasmic mammalian cells (Hauswirth and Laipis, 1982; Ashley et al., 1989; Koehler et al., 1991) and single-celled organisms (Birky, 1978a, b). Mathematical modeling predicted that decreasing the number of mtDNA-segregating units to a few copies promotes the segregation of mt-alleles (Birky, 1978a, b). One proposed explanation is a genetic bottleneck, in which mtDNA copy number is dramatically reduced, although the nature (and existence) of such a mechanism remains controversial (Cao et al., 2007; Cree et al., 2008; Khrapko, 2008; Wai et al., 2008). Another mechanism that we found in Saccharomyces cerevisiae is vegetative segregation of mt-alleles caused by formation of head-to-tail tandem multimers (concatemers) of single genome-sized mtDNA in mother cells and their selective transmission into daughter cells.
Concatemers are produced by reactive oxygen species (ROS)–triggered rolling-circle replication, allowing for inheritance of multiple mtDNA genome units as a single segregation unit, thereby allowing most progeny cells to become homoplasmic within eight generations of growth from a heteroplasmic ancestor cell (Ling and Shibata, 2002, 2004; Ling et al., 2011). However, it remains unclear whether ROS production contributes to the segregation of mt-alleles in human cells despite the established role for H2O2 as a signaling molecule in yeast, plants, and animals (Kamata and Hirata, 1999; Neill et al., 2002; Bienert et al., 2006; Ling et al., 2011). In addition, selective mtDNA-concatemer transmission from mother to daughter cells clearly explains homoplasmy restoration in budding yeast and asymmetric cell division, but it is unclear whether this mechanism is applicable to most organisms, including humans, that undergo symmetric cell division.
In this study, using heteroplasmic m.3243A > G primary fibroblast cell lines derived from MELAS patients, we provide evidence that ROS triggers rolling-circle replication, which forms concatemers and stimulates mtDNA-allele segregation toward homoplasmy during vegetative growth.
RESULTS
Induced mt-allele segregation by ROS
To test the effects of ROS on mt-allele segregation, we analyzed the m.3243A > G mutant fraction in clones from H2O2-treated heteroplasmic fibroblast cells derived from MELAS patients (Supplemental Figure S1). Treatment-induced changes to the distribution of mutant mtDNA-allele fractions from a single-peaked to a bimodal distribution (Figure 1A, parental to i) are achieved only by mt-allele segregation from heteroplasmic cells to homoplasmic descendants. A shift of the distribution toward the wild-type or mutant mtDNA side results from selection for cells with either wild-type or mutant mtDNA (Figure 1A, parental to ii and iii, respectively).
FIGURE 1:

Elevated ROS levels induced segregation of mtDNA alleles in heteroplasmic MELAS cells. (A) Possible distribution profile shifts from parental heteroplasmic cells after growth condition changes. (i) Vegetative segregation toward homoplasmy. (ii) Selection for cells with normal mtDNA. (iii) Selection for cells with mutant mtDNA. (B) Intracellular ROS level after H2O2 treatment. MELAS cells were treated with the indicated concentrations of H2O2 and measured at 5-min intervals using the probe CM-H2DCFDA. (C) Distribution of m.3243A > G mutant fraction in clones derived from cells treated for 30 min with (i) 0, (ii) 25 μM, (iii) 50 μM, (iv) 100 μM, or (v) 300 μM H2O2 and then cultivated to allow robust growth of cells. (D) Statistical analysis for distribution of the m.3243A > G mutant fraction in clones derived from cells treated with the indicated concentrations of H2O2. ***p < 0.001, ****p < 0.0001; N.S., not significant. For each concentration of H2O2, the treatment time was 30 min.
MELAS cells treated with H2O2 followed by 6 d of cultivation (“posttreatment cultivation”) were subjected to single-cell cloning, and the m.3243A > G mutant fraction in each clone was analyzed (Supplemental Figure S1B). Treatment of cells with H2O2 caused detectable increases in intracellular ROS levels within 15 min (Figure 1B). The m.3243A > G mutant fraction among all mtDNAs within each cell clone was measured using an established PCR-restriction fragment-length polymorphism (RFLP) assay (diagram in Supplemental Figure S1A, left; Goto et al., 1990).
The original MELAS cell culture consisted of cells with 32 ± 3% (n = 5) m.3243A > G mutant mtDNA (Supplemental Figure S1A, right), and all clones isolated from untreated MELAS culture contained m.3243A > G mutant fractions within a range of 25–55% (Figure 1, Ci and D, and Supplemental Figure S2A). Treatment with 100 μM H2O2 for 30 min caused ∼40% of the clone population to yield colonies with <25% or >55% m.3243A > G mutant allele content (Figure 1, Civ and D). The shift to a bimodal distribution is indicative of mt-allele segregation (Figure 1Ai). Remarkably, sequencing revealed that some clones (such as clone 1) derived from MELAS cells treated with 100 μM H2O2 for 30 min and cultivated for 6 d contained a very low (<3%) m.3243A > G mtDNA level (Supplemental Figure S2F).
On the other hand, a higher concentration of H2O2 (300 μM) was much less effective at inducing segregation (Figures 1, Cv and D, and Supplemental Figure S2E), presumably due to excess cellular damage. Treatment with 25 or 50 μM H2O2 for 30 min did not yield significant changes to m.3243A > G mutant allele content among the measured populations of clones (Figure 1C, ii and iii vs. iv). Therefore only an optimal amount of ROS induced mt-allele segregation toward mutant and wild-type mtDNA homoplasmy during vegetative growth.
Closed circular monomeric mtDNA decreased in H2O2-treated MELAS cells
To determine the effects of ROS on mtDNA species, we treated MELAS cells with 100 μM H2O2 and performed analysis using one-dimensional gel electrophoresis followed by Southern hybridization. In untreated cells, the closed circular monomer of one genome-unit size is the major species of mtDNA and is converted to a 16.5-kbp linear form upon treatment with BamHI, which has a single cutting site in human mtDNA (Figure 2A). In H2O2-treated cells, we observed that closed circular (cc) mtDNA disappeared, and careful examination revealed a faint signal from linear unit-sized mtDNA and other forms in H2O2-treated MELAS cells (Figure 2A).
FIGURE 2:
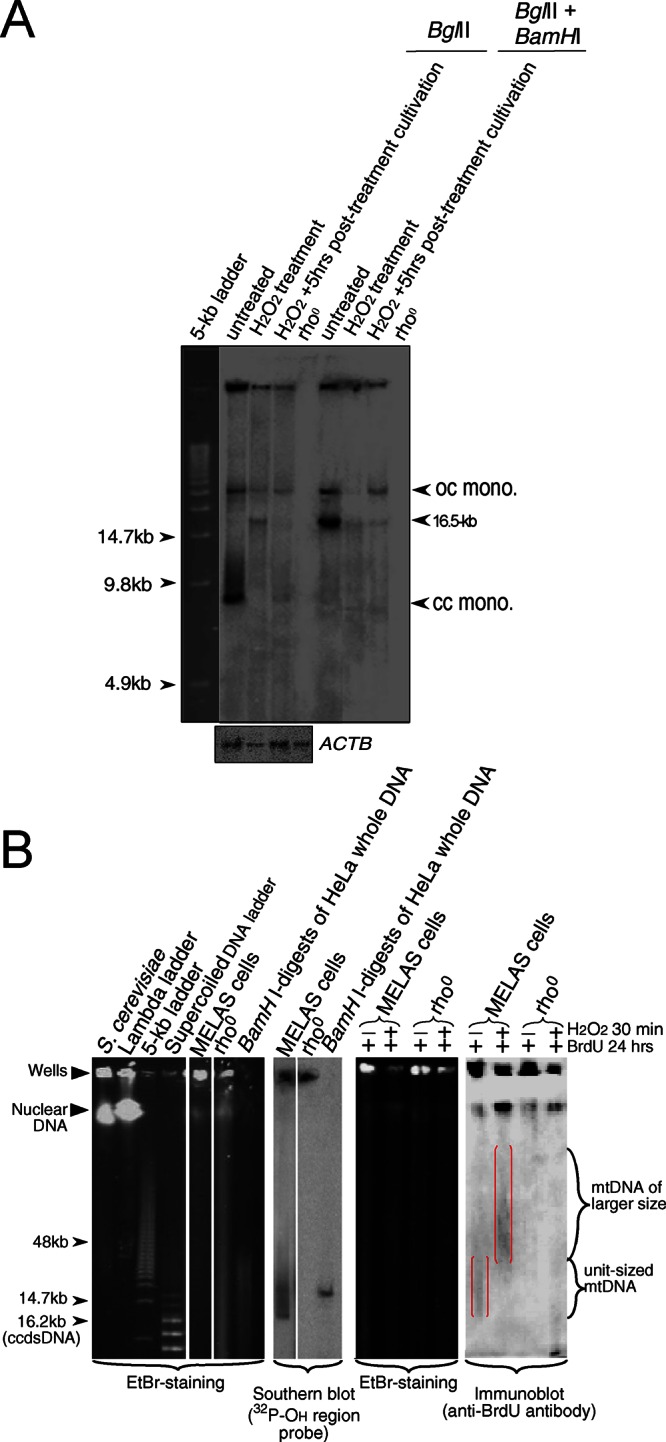
Analyses of mtDNA-species in H2O2-treated MELAS cells. (A) One-dimensional gel analyses. The BglII or BglII/BamHI digests were separated on a 0.5% agarose gel by electrophoresis. Treatment with BglII (no cutting site on human mtDNA) slightly reduced background signals from nuclear genomic DNA. Signals from mtDNA species were detected by Southern hybridization using a 32P-labeled mtDNA fragment of the OH region as a probe. Signals from the nuclear gene ACTB are shown below the one-dimensional gel profile. Open-circular monomers migrated more slowly than linear monomers (lane 1) and were resistant to BamHI treatment (lane 5). Because the BamHI cutting site in human mtDNA is located close to the heavy chain replication origin (oriH) within the D-loop region, mtDNA replicating in the θ-type mode with the D-loop are BamHI resistant and in open-circular form (or readily convert to open-circular form). No background signal was detected in BglII digests obtained from mtDNA-deficient (rho0) cells (lane 4). (B) PFGE profiles of mtDNA. PFGE plugs prepared from MELAS and rho0 cells treated or untreated with H2O2, followed by BrdU labeling of mtDNA. Samples were subjected to PFGE along with size and position markers (DNA plugs from S. cerevisiae, lambda DNA ladder, 5-kb DNA ladder, supercoiled DNA ladder, and BamHI digest of total DNA from HeLa cells) to indicate the position of unit-sized mtDNA. Whole DNA species (including nuclear species) were visualized by EtBr staining. BrdU-labeled nascent DNA species were detected by immunoblot analysis; larger nascent mtDNA is framed in red.
Newly synthesized mtDNA was concatemeric in H2O2-treated MELAS cells
Next we sought to elucidate the molecular basis of mt-allelic segregation induced by ROS in human cells. First, we analyzed newly synthesized bromodeoxyuridine (BrdU)–labeled mtDNA by pulsed-field gel-electrophoresis (PFGE), which effectively separates mtDNA molecules from nuclear genomes. We detected BrdU-labeled mtDNA molecules with sizes larger than the unit length from 100 μM H2O2-treated MELAS cells but detected only unit-sized mtDNA from untreated cells and no BrdU-signals in ρ0 cells (Figure 2B).
To analyze the forms of larger mtDNA, we prepared plugs from cells treated with or without 100 μM H2O2 for 30 min followed by various periods of posttreatment cultivation (Supplemental Figure S3). Finally, we subjected the samples to two-dimensional (2D) gel electrophoresis (Figure 3). In untreated cells, primarily open-circular (oc) and cc mtDNA monomers with unit-sized genomes (16.5 kb) were detected as the major mtDNA species (Figure 3i). After treatment with 100 μM H2O2 and 1 h of posttreatment cultivation, oc monomers, linear monomers, and fragmented mtDNAs were detectable (Figure 3, ii and iii). After 5 h of posttreatment incubation, fragmented mtDNAs disappeared, oc monomer signals increased, and a faint signal from cc monomers was detected (Figure 3iv). Of note, after 24 h of posttreatment cultivation, linear mtDNA multimers larger than the unit length (>20 kb; concatemers) were detected, and larger amounts of cc monomers were formed (Figure 3v; see also the positions of the size markers in Supplemental Figure S4). Southern blot analysis revealed no remarkable mtDNA signals from ρ0 cells, indicating that the signals detected in each panel correspond to mtDNA species (Figure 3vi).
FIGURE 3:

Profiles of mtDNA species detected by Southern blot after PFGE-coupled 2D gel electrophoresis. (i–vi) Schematic diagrams indicating mtDNA species corresponding to images on the right showing mtDNA species from MELAS cells treated under the indicated conditions.
These results suggest ROS induced de novo synthesis of multimeric mtDNA species in the treated MELAS cells.
Correlation between concatemer formation and mt-allele segregation
To explore the relationship between concatemer formation and mt-allele segregation from heteroplasmic cells, we designed an assay system to monitor signal ratios of mtDNA concatemers to nuclear DNA, using PFGE-coupled 2D gel electrophoresis profiles (Figure 4A). Signals from mtDNA and nuclear DNA in cells treated with various concentrations of H2O2 followed by 24-h posttreatment incubation were detected by Southern blot analysis using 32P-labeled DNA fragments from the mtDNA OH region and the nuclear β-actin gene (ACTB), respectively, as probes.
FIGURE 4:

Concatemer formation under conditions that induce segregation of the m.3243A > G allele. (A) Schematic diagrams of PFGE-coupled 2D gel electrophoresis of DNA. (i) Plug and marker run in the first dimension. (ii) Excised lane of total cellular DNA, rotated 90° counterclockwise and embedded in a newly poured gel for 2D electrophoresis. (iii) DNA species after EtBr staining. (iv) Left and right, nuclear DNA after 2D electrophoresis and mtDNA species separated from the nuclear chromosomes and well-bound DNAs after undergoing PFGE, respectively. Signals from mtDNA and nuclear DNA were detected by Southern hybridization. Arrowheads indicate the positions of each mtDNA species (bottom right). (B) Identification of head-to-tail concatemers. Gel containing the concatemers (framed in a red box; see Aiv) was excised. Purified DNA was divided into two equal parts for the undigested control and BamHI-digested samples. Arrowhead indicates the position of unit-sized mtDNA. (C, D) Signals from mtDNA (C) and nuclear DNA (D) from cells treated with the indicated concentration of H2O2.
To verify concatemer formation, we excised a piece of agarose gel corresponding to the region predicted to contain linear DNA species with sizes >16.5 kb (Figure 4Aiv, right, red-framed box) after PFGE-coupled 2D gel electrophoresis and isolated the DNA species by digesting the agarose gel with β-agarase I. Large DNA species with branched structures such as the Holliday junction or replication fork–type three-way junctions are unable to enter gels during PFGE and thus should not be included in this linear DNA fraction. The isolated linear DNA was digested with the restriction enzyme BamHI, giving rise to 16.5-kb unit-length fragments (Figure 4B). This result indicates that multimeric mtDNA in H2O2-treated MELAS cells are in a head-to-tail configuration and thus are concatemers.
The major mtDNA species in untreated MELAS cells were oc and cc monomers, with nearly undetectable amounts of concatemers, linear monomers, and linear mtDNA fragments <16.5 kbp (Figure 4Ci). Treatment of MELAS cells with 100 μM H2O2 followed by 24 h of posttreatment incubation significantly increased concatemer signals (Figure 4Civ) relative to cells treated with lower (75 μM: Figure 4Ciii) or higher concentrations of H2O2 (150 μM; Figure 4Cv). Concatemer signals were not significant at 50 μM H2O2 (Figure 4Cii) and became very faint at >200 μM H2O2 (Figure 4C, vi and vii). These results correlate with mt-allele segregation in heteroplasmic cells at the single-cell level (Figure 1C, iv vs. ii, iii, and v). Concatemers are exclusively formed by rolling circle replication or crossing-over–type recombination. Those formed by recombination have discrete lengths (monomers, dimers, trimers, etc.). As shown in Figure 4C, ii–vii, the mtDNA concatemers we detected had continuous lengths and are therefore likely to have been formed by rolling-circle replication.
Detection of rolling-circle replication intermediates from well-bound DNA after PFGE
Concatemers generated by rolling-circle replication are expected to be accompanied by intermediates possessing conjoined circular mtDNA structures at one end. However, some circular structure likely separates from concatemers during experimental processing (Bendich, 1996; Ling and Shibata, 2002, 2004; Ide et al., 2013). In addition, four-way branched structures exist as rolling-circle replication intermediates and may have a role in concatemer-to-monomer resolution (Lewis et al., 2015). DNA species with circular structures, branched DNA with four-way junctions, or replication fork–type three-way junctions (i.e., rolling circle replication intermediates, homologous recombination products, and replication intermediates) are unable to exit PFGE wells but do enter agarose gels during conventional electrophoresis.
We tried to detect rolling-circle replication intermediates (concatemers conjoined with circular mtDNA structures at one end) in samples derived from PFGE wells by two consecutive steps of conventional gel electrophoresis (first through normal agarose and then through low–melting point agarose; schematically illustrated in Figure 5A, i and ii). We isolated DNA species with sizes >16.5 kb from the third electrophoresis round by β-agarase I digestion (Figure 5A, ii, framed in a red box). After BamHI digestion, the isolated DNA yielded a signal corresponding to the unit size (16.5 kb) of mtDNA (Figure 5B), indicating that the mtDNA species that were well bound during PFGE contained concatemers. We also observed that the BglII-digested sample contained well-bound DNA species, using conventional gel electrophoresis (Figure 5B), which had previously been excised from a low–melting point agarose gel after PFGE-coupled 2D electrophoresis, leading us to infer that the large isolated mtDNA species contain impurities from the gel and thus tend to form aggregates spontaneously during DNA handling. On the other hand, because exonuclease III (ExoIII) digests double-stranded DNA in the 3′ to 5′ direction starting from the 3′-OH end, we predicted that ExoIII treatment would allow for migration of species with attached linear DNA. Digestion of well-bound DNA obtained after the first PFGE run with ExoIII (Kusano et al., 1989) generated signals from circular monomers, which were able to enter the gel during the second PFGE run (Figure 5, C and D). These results indicate that circular structures with attached linear DNAs were among the well-bound DNA species.
FIGURE 5:

Detection of rolling-circle replication intermediates from well-bound DNA after PFGE. (A) Procedure for identifying species of mtDNA after PFGE-coupled 2D electrophoresis. We ran PFGE using plugs prepared from MELAS cells treated with 100 μM H2O2 for 0.5 h and then cultured for 24 h. The 2D gel electrophoresis runs were performed to allow well-bound DNA to enter the gel (top). Gel containing the well-bound DNAs after PFGE (framed with black dashed lines) was excised, rotated 90° counterclockwise, embedded in a newly poured 1% low–melting point agarose gel, and subjected to a second round of electrophoresis (bottom). DNA species with sizes >16.5 kb (framed with a red box) were cut out and purified after the gel was digested with β-agarase. (B) Restriction enzyme digestion of the predicted concatemeric mtDNAs. Purified DNA molecules were separated into two parts: the first aliquot was digested with BglII to reduce the possible effects of contaminating nonspecific nuclear DNA signals to a minimum. The second aliquot was digested with BamHI. Positions of unit-sized mtDNA are indicated by arrowheads. (C) Schematic diagram of 3′–5′ digestion of rolling-circle intermediates by ExoIII to generate open (oc mono.) and closed-circular (cc mono.) monomers. Broken lines indicate the digested DNA strands. (D) After undergoing the first PFGE run, the DNA plugs containing well-bound DNAs were divided into two smaller plugs of nearly identical dimensions. ExoIII-treated and untreated plugs were subjected to a second PFGE run. MtDNA signals were detected by Southern blot analysis.
Induced endogenous ROS generation promoted mt-allele segregation
Next we set out to examine whether inducing endogenous ROS production can also lead to mt-allele segregation. MtDNA polymerase γ (POLG) is essential for replication and repair of mtDNA. Inhibition of POLG by ethidium bromide (EtBr) treatment depletes mtDNA (Okamaoto et al., 2003) and induces endogenous ROS production (Palmeira et al., 2007; Sasaki et al., 2008). We hypothesized that ROS contribute to mt-allele segregation from heteroplasmy toward homoplasmy upon copy number reduction in heteroplasmic MELAS cell cultures. To test this possibility, we treated MELAS cells with EtBr for 6 d, thereby decreasing mtDNA copy number to <10% of control levels (Figure 6A). Using a flow cytometer and the fluorogenic dye MitoSOX red, an indicator for mitochondrial superoxide in live cells (Robinson et al., 2006), we detected increased ROS levels at 3 and 6 d after EtBr treatment (Figure 6, A and B). Subsequent washing and incubation for 6 d allowed for recovery of mtDNA copy number to a mean value of 79.7% of control levels (Figure 6A) and a decrease in ROS levels to those of untreated MELAS cells at 3 and 6 d after washing out EtBr (Figure 6B). After the recovery process, the m.3243A > G mutant fraction exhibited a much wider distribution (Figure 6Cii and Supplemental Figure S5B), indicating mt-allele segregation.
FIGURE 6:

Segregation of mt-alleles in heteroplasmic MELAS cells upon endogenous ROS induction. The experimental procedure is shown in Supplemental Figure S1B. (A) Changes in mtDNA copy number upon EtBr treatment. MELAS cells were treated with 50 ng/ml EtBr for 6 d and then allowed to recover for 6 d. Total DNA was extracted, and relative mtDNA copy number was determined by real-time PCR analysis in triplicate at the indicated time points. (B) Increases in ROS level upon EtBr treatment. MELAS cells were treated with 50 ng/ml EtBr for 6 d. After EtBr removal, cells were then allowed to recover for 6 d. Relative ROS levels at the indicated time points were analyzed by MitoSOX labeling. (C) Segregation of mtDNA alleles by EtBr treatment. Distribution of the m.3243A > G mutant fraction in clones derived from (i) untreated (Ctrl) cells, (ii) EtBr-treated cells, (iii) EtBr-treated cells cultivated in the presence of NAC or (iv) vitamin C, and (v, vi) Ctrl cells cultivated in the presence of (v) NAC or (vi) vitamin C alone. (D) Statistical analysis for distribution of the m.3243A > G mutant fraction in clones derived from cells under the conditions described in C. *, p < 0.05; ****, p < 0.0001; N.S., not significant.
To further examine the role of ROS in EtBr induced mt-allele segregation, we also treated MELAS cells with EtBr in the presence of ROS scavenger vitamin C or N-acetylcysteine (NAC), respectively. Vitamin C partially but significantly inhibited mt-allele segregation toward lower mutant-allele frequency in EtBr-treated MELAS cells (Figure 6, C, ii vs. iv, and D, and Supplemental Figure S5, B vs. D). In the presence of NAC, we also observed broadening of the distribution of the m.3243A > G mutant fraction (Figure 6, C, ii vs. iii, and D, and Supplemental Figure S5, B vs. C). NAC treatment increases the intracellular level of glutathione, an antioxidant and substrate of glutathione peroxidase. Because EtBr inhibits glutathione peroxidase activity in EtBr-treated rat brains (Abdel-Salam et al., 2012), we suspected that the poor efficacy of NAC was due to inhibition of glutathione peroxidase activity by EtBr. No broadening in the distribution of the m.3243A > G mutant fraction occurred in clones treated with either NAC or vitamin C alone (Figure 6, C, i vs. v and i vs. vi, and Supplemental Figure S5, A vs. E or F). It is very likely that a decrease in mtDNA-encoded electron transport chain (ETC) subunits affected the balance in the relative abundance between the nuclear- and mitochondrial-encoded subunits, thereby disrupting formation of ETC complexes and causing endogenous ROS production.
On the basis of the foregoing observations, we propose a model in which ROS production decreases the amount of intact closed-circular mtDNA monomers (potential replication templates) while triggering rolling circle replication on a few residual templates to generate head-to-tail multimers (concatemers) with the same sequence as the template circular DNA. The resulting concatemer formation allows for inheritance of a number of mtDNA genome units into sister cells as a single segregation unit and thus stimulates mtDNA-allele segregation toward wild-type and mutant mtDNA homoplasmy through clonal expansion (Figure 7).
FIGURE 7:

Model for ROS-induced segregation of mtDNA alleles. ROS cause a decrease in amounts of intact closed-circular mtDNA monomers, which serve as templates for rolling-circle replication. Rolling-circle replication is initiated by an invading 3′-single-stranded terminus derived from a fragmented mtDNA, as in the case of yeast mitochondria (Ling and Shibata, 2004; Ling et al., 2007, 2011), and generates concatemers consisting of a number of identical sequences. The resulting concatemers allow for inheritance of a number of mtDNA genome units into sister cells as a single segregation unit and thus stimulate mt-allele segregation toward wild-type or mutant mtDNA homoplasmy.
DISCUSSION
In this study, we presented evidence that an optimal level of ROS promoted segregation of heteroplasmic alleles of mtDNA in human cells, and this segregation correlated with the ROS-promoted synthesis of linear tandem multimers (concatemers), which were products of rolling-circle replication. Thus the mechanism for homoplasmy restoration is likely evolutionarily conserved in human mitochondria.
Treatment of human cells with H2O2 causes oxidative damage to DNA bases and mainly results in single-stranded (ss) breaks (Rueff et al., 1993; Villani et al., 2010). Of note, we observed the disappearance of cc mtDNA (Figure 2A) and fragmentation (Figure 3, ii and iii) in H2O2-treated MELAS cells, which contributes to the generation of double-strand breaks (DSBs) in mtDNA molecules. Subsequent processing of newly formed DSBs by a 5′-3′ exonuclease would generate 3′-ssDNA tails, which are known substrates for heteroduplex joint formation directed by a homologous DNA pairing protein. These 3′ ssDNA tails of mtDNA fragments would then be used to initiate rolling-circle replication as in budding yeast (for reviews, see Solieri, 2010; Chen, 2013).
On the other hand, H2O2 treatment causes mtDNA damage, which results in a greatly reduced number of cc monomeric mtDNAs remaining intact (Figures 2A and Figure 3ii). These results suggest that the reduced mtDNA copy number is responsible, at least in part, for inducing mt-allele segregation. Of importance, mathematical modeling predicted that decreasing the number of mtDNA-segregating units to a few copies would promote the segregation of mt-alleles (Birky, 1978a, b). However, human fibroblast cells each contain ≥1000 copies of mtDNA (Lehtinen et al., 2000). Although EtBr treatment reduces mtDNA copy number to 1/10 of the initial level (Figure 6A), ≥100 copies of mtDNA would still remain.
Indeed, we found that treatment with EtBr induced ROS production and promoted mt-allele segregation (Figure 6, A and C). In addition, ROS scavengers such as vitamin C partially but significantly impaired mt-allele segregation in EtBr-treated MELAS cells (Figure 6, Civ and D, and Supplemental Figure S5D). These results suggest that ROS play a role in the observed mt-allele segregation. The results taken together indicate that decreasing copy number alone is not sufficient to explain the observed segregation; in other words, reduction in mtDNA replication templates coupled with concatemer formation contributes to mt-allele segregation.
Rapid segregation of heteroplasmic mtDNA occurs at the genetic bottleneck, which is accompanied by remarkable decreases in mtDNA level during oogenesis and increases in mtDNA level during folliculogenesis (Cree et al., 2008; Khrapko, 2008; Wai et al., 2008). Folliculogenesis is regulated by various hormones, including estrogens such as estradiol (Roche, 1996), which induces ROS production at a high level (Okoh et al., 2011). We infer that ROS-mediated concatemer formation might contribute to increases in mtDNA content during folliculogenesis.
In summary, this study, in conjunction with our previous studies in budding yeast (for reviews, see Solieri, 2010; Ling et al., 2011; Chen, 2013), provides new insights into the mechanism underpinning homoplasmy restoration in mammalian cells.
MATERIALS AND METHODS
Cells, cell culture, and reagents
Primary heteroplasmic fibroblast cell lines containing m.3243A > G mutant mtDNA derived from different MELAS patients were obtained from the fibroblast repository at the National Center of Neurology and Psychiatry (NCNP; Tokyo, Japan) under written informed consent and with the approval of the NCNP Institutional Review Board.
Cells were maintained in DMEM (Wako Pure Chemical Industry, Osaka, Japan) supplemented with 10% fetal bovine serum and penicillin/streptomycin (100 U/ml and 100 mg/ml, respectively) at 37°C in a humidified incubator in an atmosphere containing 5% CO2. Pyruvate (100 μg/ml) and uridine (50 μg/ml) were added to the culture medium to allow growth of rho– or rho0 cells generated after chemical treatment.
DNA plugs from S. cerevisiae, lambda ladder, and 5-kb DNA ladder were purchased from Bio-Rad Laboratories (Tokyo, Japan). Supercoiled DNA ladder and supercoiled DNA marker sets were purchased from Invitrogen and Epicentre, respectively. These DNA size markers were used as references for the sizes and positions of DNA species.
Southern blot analysis for detection of nuclear DNA and mtDNA molecules
Total cellular DNA (∼15 μg) was separated by electrophoresis on a 0.5% agarose gel, run at 4°C for 30 h at 1 V/cm, and transferred to a nylon membrane (Amersham Hybond N Plus; GE Healthcare). Signals for mtDNA were detected using the 32P-labeled mtDNA OH region as a probe, as described (Anderson et al., 1981; Lehtinen et al., 2000). Signals for nuclear DNA were detected using a 32P-labeled DNA fragment of the β-actin gene, ACTB (for nuclear DNA), as a probe. Primers designed for the mtDNA OH region were forward, 5′-TAACCACTCACGGGAGCTCT-3′, and reverse, 5′-AAGGCTAGGACCAAACCTAT-3′. Primers designed for ACTB were forward, 5′-TGCGTGACATTAAGGAGAAGCTGTGC-3′, and reverse, 5′-CTCGTCATACTCCTGCTTGCTGATCC-3′. Signals corresponding to mtDNA and nuclear DNA fragments were quantitated using a Fujifilm BAS-2500 image analyzer (Fujifilm, Tokyo, Japan).
Treatment with chemical compounds and single-cell cloning
Cells were plated at 30–50% confluence 1 d before treatment with chemical compounds. After treatment, cells were allowed to recover in fresh medium for 6 d and then plated at high dilution to create isolated colonies. Colonies derived from single cells were then collected using cloning rings.
Measurement of intracellular ROS
The intracellular ROS level after H2O2 treatment was measured by use of 5-(and-6)-chloromethyl-2,7-dichlorodihydrofluorescein diacetate acetyl ester (CM-H2DCFDA; Molecular Probes, Nacalai Tesque, Kyoto, Japan). Cells (1×10⁵/ml) were first incubated with 10 μM CM-H2DCFDA for 15 min at 37°C and then treated with H2O2 and analyzed kinetically in a SpectraMax microplate reader (Molecular Devices, Sunnyvale, CA).
Measurement of ROS after EtBr treatment was performed by flow cytometer. After EtBr treatment, ∼1 × 10⁶ cells were trypsinized and each cell pellet was resuspended in 1× phosphate- buffered saline (PBS) containing 5 μM MitoSOX (Molecular Probes, M36008). ROS levels were then analyzed by flow cytometry at the Research Resources Center, RIKEN Brain Science Institute (Wako, Japan).
DNA preparation and a PCR-RFLP assay for m.3243A > G-heteroplasmy
The heteroplasmy level was estimated by the m.3243A > G mutant fraction, measured using the PCR-RFLP assay described by Goto et al. (1990). Briefly, a 294–base pair mtDNA region containing np 3243 was amplified by PCR using a forward primer (5′-AGGACAAGAGAAATAAGGCC; nps 3130–3149), a reverse primer (5′-ACGTTGGGGCCTTTGCGTAG; nps 3423–3404), and whole cellular DNA as a template. The ApaI digests (182– and 112–base pair mtDNA fragments) of the purified PCR products were separated on a 2% agarose gel by electrophoresis and detected by Southern hybridization using an [α-32P]dCTP-labeled 294–base pair DNA fragment as a probe. Signals were quantitatively analyzed using a FujiFilm BAS-2500 image analyzer. The m.3243A > G mutant fraction was calculated as the proportion of the signals from the 182– and 112–base pair mtDNA fragments to the total signals from the uncut 294–, 182–, and 112–base pair mtDNA fragments.
Statistical analysis
The F test was used to determine the statistical significance of differences in the distributions of m.3243A > G allele frequency between two independent groups.
DNA extraction and real-time PCR for mtDNA copy-number analysis
Total cellular DNA was extracted using the DNAzol Reagent (Invitrogen). Relative mtDNA copy number was defined as the ratio of mtDNA (represented by the ND1 gene) to nuclear DNA (represented by the β-actin gene). Primers for the ND1 gene were forward, 5′-CCCTAAAACCCGCCACATCT-3′, and reverse, 5′-GAGCGATGGTGAGAGCTAAGGT-3′. Primers for the ACTB gene were as in the Southern blot analysis. Mitochondrial and nuclear primer sets were run for each sample in triplicate. Various dilutions of the template DNA were used in the PCR reaction to ensure that measurements were within the linear range of the assay.
Analyses of mtDNA by PFGE
For preparation of plugs for PFGE, cells were suspended in 100 μl of Tris-EDTA buffer (0.5 M EDTA, 10 mM Tris, pH 7.5) and mixed well by pipetting with 250 μl of 1.6% low–melting point agarose (made in an EDTA/Tris solution containing 50 mM EDTA, 10 mM Tris, pH 7.5). The suspension was added to a DRII sample mold (170-3622; Bio-Rad, Hercules, CA) to form plugs on ice for 10–20 min. Each plug was transferred to a 15 ml of Corning centrifuge tube containing 2 ml of lysis buffer (0.5 M EDTA, 10 mM Tris, 1% N-lauroylsarcosine, pH 9.5) suspended with 2 μg/ml proteinase K (Merck) and incubated at 50°C overnight. Before PFGE, the plugs were washed with EDTA/Tris solution. PFGE was performed with a contour-clamped homogeneous electric field instrument (Bio-Rad CHEF DRII). The running conditions were 6 V/cm at 14°C for 11 h, initial and final intervals 2 and 12 s, respectively, in 0.5× TBE buffer (1× TBE is 0.089 M Tris, 0.089 M boric acid, 0.002 M EDTA).
Labeling of nascent mtDNA
MELAS and ρ0 cells were untreated or treated with 100 μM H2O2 for 0.5 h after incubation with BrdU for 30 min. After washing, the nascent mtDNA was labeled by growing cells for 24 h in fresh medium containing 10 μM BrdU (Sigma-Aldrich). For preparation of each PFGE plug, cells were washed with PBS buffer to remove BrdU, resuspended in 50 μl Tris-EDTA buffer (0.5 M EDTA, 10 mM Tris, pH 7.5), and then mixed well by pipetting with 150 μl of 1.6% low–melting point agarose at 50°C. PFGE plugs were formed by adding the suspension to a Bio-Rad DRII sample mold.
PFGE-coupled 2D gel electrophoretic analyses
After PFGE, the desired DNA-containing gel segment was excised, rotated 90° counterclockwise, and embedded in a newly poured 1% agarose gel. The DNA was then subjected to 2D gel electrophoretic analyses as previously described (Brewer and Fangman, 1987; Ling and Shibata, 2004; Ling et al., 2007). A 5-kbp DNA ladder (Bio-Rad) was used as a size marker. The 2D run was performed at 5 V/cm on a 1% agarose gel or 1% low–melting point gel (for purifying the DNA species) in TBE buffer with 0.3 μg/ml EtBr at 4°C. Signals for mtDNA and nuclear DNA were detected by Southern hybridization using the 32P-labeled mtDNA OH region or the 32P-labeled DNA fragment of the β-actin gene as a probe.
Exonuclease digestion
DNA plugs with dimensions of 1 × 2 × 0.15 cm were prepared from 1 × 10⁷ MELAS cells treated with 100 μM H2O2 for 0.5 h, cultured for 24 h, and then subjected to PFGE. Plugs containing well-bound DNAs were taken from PFGE wells and divided into two smaller plugs (with dimensions of 1 × 0.5 × 0.15 cm). One plug was soaked in 1× ExoIII buffer without addition of the corresponding exonuclease as a control. The remaining plug was soaked in 1× ExoIII buffer. Exonuclease digestion of each smaller plug was performed at 37°C for 15 h (Kusano et al., 1989). ExoIII with attached buffer was purchased from NEB.
Supplementary Material
Acknowledgments
We deeply appreciate Elliot Bradshaw, Chemical Genetics Laboratory, RIKEN, for proofreading the manuscript. This work was supported in part by a Grant-in-Aid for Scientific Research (C) (26440013) from the Ministry of Education, Culture, Sports, Science and Technology of Japan to F.L., an Incentive Research Grant from RIKEN to F.L., a grant from the RIKEN Strategic Research Program, and a grant from the Japan Agency for Medical Research and Development–Core Research for Evolutional Science and Technology to F.L.
Abbreviations used:
- ACTB
nuclear β-actin gene
- BrdU
bromodeoxyuridine
- cc
closed circular
- CM-H2DCFDA
5-(and-6)-chloromethyl-2,7-dichlorodihydrofluorescein diacetate acetyl ester
- concatemers
linear tandem multimers linked by head-to-tail unit-sized mtDNA
- 2D
two-dimensional
- EtBr
ethidium bromide
- ETC
electron transport chain
- ExoIII
exonuclease III
- m.3243A>G
mtDNA mutation of the A-to-G transition at nucleotide position (np) 3243
- MELAS
mitochondrial myopathy, encephalopathy, lactic acidosis, and stroke-like episodes
- mt
mitochondrial
- NAC
N-acetylcysteine
- oc
open-circular
- PBS
phosphate-buffered saline
- PFGE
pulsed-field gel-electrophoresis
- POLG
mtDNA polymerase γ
- ROS
reactive oxygen species
- TAE
Tris-acetate-EDTA
- TBE
Tris-boric-EDTA.
Footnotes
This article was published online ahead of print in MBoC in Press (http://www.molbiolcell.org/cgi/doi/10.1091/mbc.E15-10-0690) on March 23, 2016.
REFERENCES
- Abdel-Salam OM, Khadrawy YA, Mohammed NA, Youness ER. The effect of gabapentin on oxidative stress in a model of toxic demyelination in rat brain. J Basic Clin Physiol Pharmacol. 2012;23:61–68. doi: 10.1515/jbcpp-2012-0004. [DOI] [PubMed] [Google Scholar]
- Anderson S, Bankier AT, Barrell BG, de Bruijn MH, Coulson AR, Drouin J, Eperon IC, Nierlich DP, Roe BA, Sanger F, et al. Sequence and organization of the human mitochondrial genome. Nature. 1981;290:457–465. doi: 10.1038/290457a0. [DOI] [PubMed] [Google Scholar]
- Ashley MV, Laipis PJ, Hauswirth WW. Rapid segregation of heteroplasmic bovine mitochondria. Nucleic Acids Res. 1989;17:7325–7331. doi: 10.1093/nar/17.18.7325. [DOI] [PMC free article] [PubMed] [Google Scholar]
- Bendich AJ. Structural analysis of mitochondrial DNA molecules from fungi and plants using moving pictures and pulsed-field gel electrophoresis. J Mol Biol. 1996;255:564–588. doi: 10.1006/jmbi.1996.0048. [DOI] [PubMed] [Google Scholar]
- Bienert GP, Schjoerring JK, Jahn TP. Membrane transport of hydrogen peroxide. Biochim Biophys Acta. 2006;1758:994–1003. doi: 10.1016/j.bbamem.2006.02.015. [DOI] [PubMed] [Google Scholar]
- Birky CW., Jr Transmission genetics of mitochondria and chloroplasts. Annu Rev Genet. 1978a;12:471–512. doi: 10.1146/annurev.ge.12.120178.002351. [DOI] [PubMed] [Google Scholar]
- Birky CW, Jr, Strausberg RL, Forster JL, Perlman PS. Vegetative segregation of mitochondria in yeast: estimating parameters using a random model. Mol Gen Genet. 1978b;158:251–261. [Google Scholar]
- Brewer BJ, Fangman WL. The localization of replication origins on ARS plasmids in S. cerevisiae. Cell. 1987;51:463–471. doi: 10.1016/0092-8674(87)90642-8. [DOI] [PubMed] [Google Scholar]
- Cao L, Shitara H, Horii T, Nagao Y, Imai H, Abe K, Hara T, Hayashi J, Yonekawa H. The mitochondrial bottleneck occurs without reduction of mtDNA content in female mouse germ cells. Nat Genet. 2007;39:386–390. doi: 10.1038/ng1970. [DOI] [PubMed] [Google Scholar]
- Chen XJ. Mechanism of homologous recombination and implications for aging-related deletions in mitochondrial DNA. Microbiol Mol Biol Rev. 2013;77:476–496. doi: 10.1128/MMBR.00007-13. [DOI] [PMC free article] [PubMed] [Google Scholar]
- Cree LM, Samuels DC, de Sousa Lopes SC, Rajasimha HK, Wonnapinij P, Mann JR, Dahl HH, Chinnery PF. A reduction of mitochondrial DNA molecules during embryogenesis explains the rapid segregation of genotypes. Nat Genet. 2008;40:249–254. doi: 10.1038/ng.2007.63. [DOI] [PubMed] [Google Scholar]
- Fujikura J, Nakao K, Sone M, Noguchi M, Mori E, Naito M, Taura D, Harada-Shiba M, Kishimoto I, Watanabe A, et al. Induced pluripotent stem cells generated from diabetic patients with mitochondrial DNA A3243G mutation. Diabetologia. 2012;55:1689–1698. doi: 10.1007/s00125-012-2508-2. [DOI] [PubMed] [Google Scholar]
- Goto Y, Nonaka I, Horai S. A mutation in the tRNA(Leu)(UUR) gene associated with the MELAS subgroup of mitochondrial encephalomyopathies. Nature. 1990;348:651–653. doi: 10.1038/348651a0. [DOI] [PubMed] [Google Scholar]
- Hauswirth WW, Laipis PJ. Mitochondrial DNA polymorphism in a maternal lineage of Holstein cows. Proc Natl Acad Sci USA. 1982;79:4686–4690. doi: 10.1073/pnas.79.15.4686. [DOI] [PMC free article] [PubMed] [Google Scholar]
- Holt IJ, Harding AE, Morgan-Hughes JA. Deletions of muscle mitochondrial DNA in patients with mitochondrial myopathies. Nature. 1988;331:717–719. doi: 10.1038/331717a0. [DOI] [PubMed] [Google Scholar]
- Ide S, Saka K, Kobayashi T. Rtt109 prevents hyper-amplification of ribosomal RNA genes through histone modification in budding yeast. PLoS Genet. 2013;9:e1003410. doi: 10.1371/journal.pgen.1003410. [DOI] [PMC free article] [PubMed] [Google Scholar]
- Kadowaki T, Kadowaki H, Mori Y, Tobe K, Sakuta R, Suzuki Y, Tanabe Y, Sakura H, Awata T, Goto Y, et al. A subtype of diabetes mellitus associated with a mutation of mitochondrial DNA. N Engl J Med. 1994;330:962–968. doi: 10.1056/NEJM199404073301403. [DOI] [PubMed] [Google Scholar]
- Kamata H, Hirata H. Redox regulation of cellular signalling. Cell Signal. 1999;11:1–14. doi: 10.1016/s0898-6568(98)00037-0. [DOI] [PubMed] [Google Scholar]
- Khrapko K. Two ways to make an mtDNA bottleneck. Nat Genet. 2008;40:134–135. doi: 10.1038/ng0208-134. [DOI] [PMC free article] [PubMed] [Google Scholar]
- Koehler CM, Lindberg GL, Brown DR, Beitz DC, Freeman AE, Mayfield JE, Myers AM. Replacement of bovine mitochondrial DNA by a sequence variant within one generation. Genetics. 1991;129:247–255. doi: 10.1093/genetics/129.1.247. [DOI] [PMC free article] [PubMed] [Google Scholar]
- Kusano K, Nakayama K, Nakayama H. Plasmid-mediated lethality and plasmid multimer formation in an Escherichia coli recBC sbcBC mutant. Involvement of RecF recombination pathway genes. J Mol Biol. 1989;209:623–634. doi: 10.1016/0022-2836(89)90000-4. [DOI] [PubMed] [Google Scholar]
- Lehtinen SK, Hance N, El Meziane A, Juhola MK, Juhola KM, Karhu R, Spelbrink JN, Holt IJ, Jacobs HT. Genotypic stability, segregation and selection in heteroplasmic human cell lines containing np 3243 mutant mtDNA. Genetics. 2000;154:363–380. doi: 10.1093/genetics/154.1.363. [DOI] [PMC free article] [PubMed] [Google Scholar]
- Lewis SC, Joers P, Willcox S, Griffith JD, Jacobs HT, Hyman BC. A rolling circle replication mechanism produces multimeric lariats of mitochondrial DNA in Caenorhabditis elegans. PLoS Genet. 2015;11:e1004985. doi: 10.1371/journal.pgen.1004985. [DOI] [PMC free article] [PubMed] [Google Scholar]
- Ling F, Hori A, Shibata T. DNA recombination-initiation plays a role in the extremely biased inheritance of yeast [rho-] mitochondrial DNA that contains the replication origin ori5. Mol Cell Biol. 2007;27:1133–1145. doi: 10.1128/MCB.00770-06. [DOI] [PMC free article] [PubMed] [Google Scholar]
- Ling F, Mikawa T, Shibata T. Enlightenment of yeast mitochondrial homoplasmy: diversified roles of gene conversion. Genes (Basel) 2011;2:169–190. doi: 10.3390/genes2010169. [DOI] [PMC free article] [PubMed] [Google Scholar]
- Ling F, Shibata T. Recombination-dependent mtDNA partitioning: in vivo role of Mhr1p to promote pairing of homologous DNA. EMBO J. 2002;21:4730–4740. doi: 10.1093/emboj/cdf466. [DOI] [PMC free article] [PubMed] [Google Scholar]
- Ling F, Shibata T. Mhr1p-dependent concatemeric mitochondrial DNA formation for generating yeast mitochondrial homoplasmic cells. Mol Biol Cell. 2004;15:310–322. doi: 10.1091/mbc.E03-07-0508. [DOI] [PMC free article] [PubMed] [Google Scholar]
- Linnane AW, Marzuki S, Ozawa T, Tanaka M. Mitochondrial DNA mutations as an important contributor to ageing and degenerative diseases. Lancet. 1989;333:642–645. doi: 10.1016/s0140-6736(89)92145-4. [DOI] [PubMed] [Google Scholar]
- Neill S, Desikan R, Hancock J. Hydrogen peroxide signalling. Curr Opin Plant Biol. 2002;5:388–395. doi: 10.1016/s1369-5266(02)00282-0. [DOI] [PubMed] [Google Scholar]
- Okamaoto M, Ohsato T, Nakada K, Isobe K, Spelbrink JN, Hayashi J, Hamasaki N, Kang D. Ditercalinium chloride, a pro-anticancer drug, intimately associates with mammalian mitochondrial DNA and inhibits its replication. Curr Genet. 2003;43:364–370. doi: 10.1007/s00294-003-0393-4. [DOI] [PubMed] [Google Scholar]
- Okoh V, Deoraj A, Roy D. Estrogen-induced reactive oxygen species- mediated signalings contribute to breast cancer. Biochim Biophys Acta. 2011;1815:115–133. doi: 10.1016/j.bbcan.2010.10.005. [DOI] [PubMed] [Google Scholar]
- Ozawa T. Genetic and functional changes in mitochondria associated with aging. Physiol Rev. 1997;77:425–464. doi: 10.1152/physrev.1997.77.2.425. [DOI] [PubMed] [Google Scholar]
- Palmeira CM, Rolo AP, Berthiaume J, Bjork JA, Wallace KB. Hyperglycemia decreases mitochondrial function: the regulatory role of mitochondrial biogenesis. Toxicol Appl Pharmacol. 2007;225:214–220. doi: 10.1016/j.taap.2007.07.015. [DOI] [PubMed] [Google Scholar]
- Raap AK, Jahangir Tafrechi RS, van de Rijke FM, Pyle A, Wahlby C, Szuhai K, Ravelli RB, de Coo RF, Rajasimha HK, Nilsson M, et al. Non-random mtDNA segregation patterns indicate a metastable heteroplasmic segregation unit in m.3243A>G cybrid cells. PLoS One. 2012;7:e52080. doi: 10.1371/journal.pone.0052080. [DOI] [PMC free article] [PubMed] [Google Scholar]
- Reardon W, Ross RJ, Sweeney MG, Luxon LM, Pembrey ME, Harding AE, Trembath RC. Diabetes mellitus associated with a pathogenic point mutation in mitochondrial DNA. Lancet. 1992;340:1376–1379. doi: 10.1016/0140-6736(92)92560-3. [DOI] [PubMed] [Google Scholar]
- Robinson KM, Janes MS, Pehar M, Monette JS, Ross MF, Hagen TM, Murphy MP, Beckman JS. Selective fluorescent imaging of superoxide in vivo using ethidium-based probes. Proc Nat Acad Sci USA. 2006;103:15038–15043. doi: 10.1073/pnas.0601945103. [DOI] [PMC free article] [PubMed] [Google Scholar]
- Roche JF. Control and regulation of folliculogenesis—a symposium in perspective. Rev Reprod. 1996;1:19–27. doi: 10.1530/ror.0.0010019. [DOI] [PubMed] [Google Scholar]
- Rueff J, Bras A, Cristovao L, Mexia J, Sa da Costa M, Pires V. DNA strand breaks and chromosomal aberrations induced by H2O2 and 60Co gamma-radiation. Mutat Res. 1993;289:197–204. doi: 10.1016/0027-5107(93)90070-v. [DOI] [PubMed] [Google Scholar]
- Sasaki R, Suzuki Y, Yonezawa Y, Ota Y, Okamoto Y, Demizu Y, Huang P, Yoshida, H, Sugimura K, Mizushina Y. DNA polymerase gamma inhibition by vitamin K3 induces mitochondria-mediated cytotoxicity in human cancer cells. Cancer Sci. 2008;99:1040–1048. doi: 10.1111/j.1349-7006.2008.00771.x. [DOI] [PMC free article] [PubMed] [Google Scholar]
- Smeitink JA, Zeviani M, Turnbull DM, Jacobs HT. Mitochondrial medicine: a metabolic perspective on the pathology of oxidative phosphorylation disorders. Cell Metab. 2006;3:9–13. doi: 10.1016/j.cmet.2005.12.001. [DOI] [PubMed] [Google Scholar]
- Solieri L. Mitochondrial inheritance in budding yeasts: towards an integrated understanding. Trends Microbiol. 2010;18:521–530. doi: 10.1016/j.tim.2010.08.001. [DOI] [PubMed] [Google Scholar]
- Villani P, Eleuteri P, Grollino MG, Rescia M, Altavista P, Spano M, Pacchierotti F, Cordelli E. Sperm DNA fragmentation induced by DNAse I and hydrogen peroxide: an in vitro comparative study among different mammalian species. Reproduction. 2010;140:445–452. doi: 10.1530/REP-10-0176. [DOI] [PubMed] [Google Scholar]
- Wai T, Teoli D, Shoubridge EA. The mitochondrial DNA genetic bottleneck results from replication of a subpopulation of genomes. Nat Genet. 2008;40:1484–1488. doi: 10.1038/ng.258. [DOI] [PubMed] [Google Scholar]
- Wallace DC. Mitochondrial DNA sequence variation in human evolution and disease. Proc Natl Acad Sci USA. 1994;91:8739–8746. doi: 10.1073/pnas.91.19.8739. [DOI] [PMC free article] [PubMed] [Google Scholar]
Associated Data
This section collects any data citations, data availability statements, or supplementary materials included in this article.