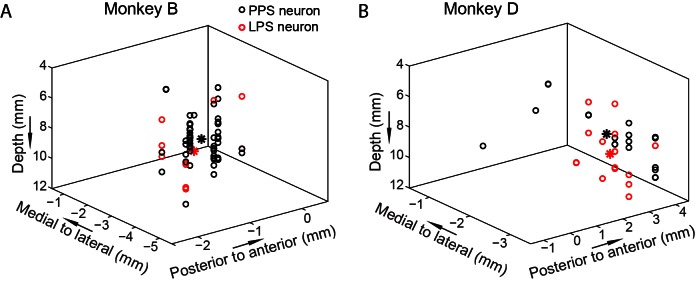
Figure 6. The 3D distribution of the PPS and LPS neurons.
The distributions of two groups of neurons based on recording site are shown for both monkeys (A, B). Each circle represents one single neuron. The black and red stars mark the averaged center positions for PPS and LPS neurons, respectively. The mean distances between the PPS and LPS neurons are 1.78 mm and 1.0727 mm for monkey B and monkey D, respectively. The X and Y coordinates are relative to the center of the recording chamber.

