

Abstract
Purpose
To develop and evaluate motion-compensation and compressed-sensing techniques in 4D flow MRI for anatomical assessment in a comprehensive ferumoxytol-enhanced congenital heart disease (CHD) exam.
Materials and Methods
A Cartesian 4D flow sequence was developed to enable intrinsic navigation and two sampling schemes: VDPoisson and VDRad. Four compressed-sensing methods were developed: A) VDPoisson scan reconstructed using spatial wavelets, B) added temporal total variation to A, C) VDRad scan using the same reconstruction as in B, and D) added motion compensation to C.
With IRB approval and HIPAA compliance, 23 consecutive patients (8 females, mean 6.3 years) referred for ferumoxytol-enhanced CHD 3T MRI were recruited. Images were acquired and reconstructed using methods A–D. Two cardiovascular radiologists independently scored the images on a 5-point scale. These readers performed a paired wall motion and functional assessment between method D and 2D bSSFP CINE for 16 cases.
Results
Method D had higher diagnostic image quality for most anatomical features (mean 3.8–4.8) compared to A (2.0–3.6), B (2.2–3.7), and C (2.9–3.9) with P < 0.05 with good inter-observer agreement (κ ≥ 0.49). Method D had similar or better assessment of myocardial borders and cardiac motion compared to 2D bSSFP (P < 0.05, κ ≥ 0.77). All methods had good internal agreement in comparing aortic with pulmonic flow (BA mean < 0.02%, r > 0.85) and compared to method A (BA mean < 0.13%, r > 0.84) with P < 0.01.
Conclusion
Flow, functional, and anatomical assessment in CHD with ferumoxytol-enhanced 4D flow is feasible and can be significantly improved using motion compensation and compressed sensing.
Keywords: congenital heart disease, 4D flow, compressed sensing, soft-gating, motion
INTRODUCTION
For management of pediatric congenital heart disease (CHD), MRI offers comprehensive evaluation of anatomy, flow, and function. However, CHD MRI exams typically require advanced operator skills to identify optimal scan planes and to optimize imaging parameters. Thus, these exams are often over an hour long and frequently require prolonged deep anesthesia/sedation (1).
A potential solution is contrast-enhanced time-resolved volumetric phase-contrast MRI (4D flow) (2,3) which obviates operator knowledge of CHD. To date, although flow and function assessment (both ventricular and valvular) have been well described with 4D flow (4–8), anatomical assessment has not been performed. Unfortunately, regardless of the prescribed in-plane matrix and slice thickness, spatial resolution for anatomical assessment is partially limited by respiratory motion (9,10). Breath-holds are infeasible given the scan durations of 5–10 min (with modern acceleration techniques). Furthermore, conventional prospective respiratory gating is suboptimal given its approximately three-fold increase in scan time (11). For 4D flow to comprise a truly comprehensive CHD exam, anatomic delineation is required, particularly in evaluating complex CHD anatomical anomalies.
In this work, we developed 4D flow techniques to enable further scan reduction by exploiting data correlation in the cardiac-phase dimension. We also introduced an intrinsic navigation technique that leverages the velocity-encoding gradients at no additional cost. These developments enabled the ability to discard or recover corrupt data for suppressing respiratory-motion image artifacts. The purpose was to develop and evaluate motion-artifact suppression and compressed-sensing techniques in 4D flow to enable anatomical assessment with function and flow for a comprehensive ferumoxytol-enhanced CHD exam.
MATERIALS AND METHODS
We first describe two changes to a standard 4D flow pulse sequence, one that enables temporal acceleration using compressed sensing, and one that enables motion navigation. We then detail our proposed image reconstruction technique that leverages the pulse sequence changes for acceleration and motion-artifact suppression. After establishing our imaging method, we describe the clinical validation.
Data Acquisition: Cartesian View-Ordering and Sampling
Variable-Density Poisson disc sampling (VDPoisson) matches the distribution of k-space energy, achieves minimal distance between each (ky, kz) -sample, and has been shown to work well for combined compressed sensing and parallel imaging algorithms (12,13). This sampling scheme has been shown to be effective in enabling accelerated 4D flow (4,8), and, thus, this approach will be used as a baseline technique for our comparisons. In our setup, a VDPoisson pattern was first generated as a table of encoding indices where each pair of indices correspond to a (ky, kz)-location to be collected. For each RR interval, a user-defined number of samples (views-per-segment) from this sampling pattern was interleaved and acquired. To reduce motion artifacts, samples for each RR interval were selected from different radial regions of k-space with a golden-ratio permutation (14). Though effective, VDPoisson was not designed specifically for motion compensation nor for compressed sensing with temporal constraints.
Therefore, we extended and modified a recently developed Variable-Density sampling and Radial view-ordering (VDRad) design for 4D flow (Figure 1a). This scheme has been shown to provide favorable properties for free-breathing dynamic-contrast-enhanced acquisitions despite motion corruption (15,16). In this approach, (ky, kz)-samples are grouped into variable-density spiral-like spokes. Each spoke samples more densely at the center of k-space and less at the outer k-space. These spokes are acquired according to the golden-ratio ordering (14). As a result, when the acquisition is temporally segmented into different phases, the resulting sampling masks are non-uniformly pseudo-randomly undersampled and are different compared to adjacent temporal phases. These features enable tolerance for higher reduction factors by exploiting spatiotemporal data correlation. Here, we extended VDRad to support cardiac-gated 4D flow imaging: VDRad determined which (ky, kz)-samples to acquire during each RR-interval, and this set of samples was repeated if the RR-interval was longer than anticipated. In this way, data are still collected in a pseudo-random fashion even if the cardiac rate becomes much slower than it was when the sequence was first executed.
Figure 1.
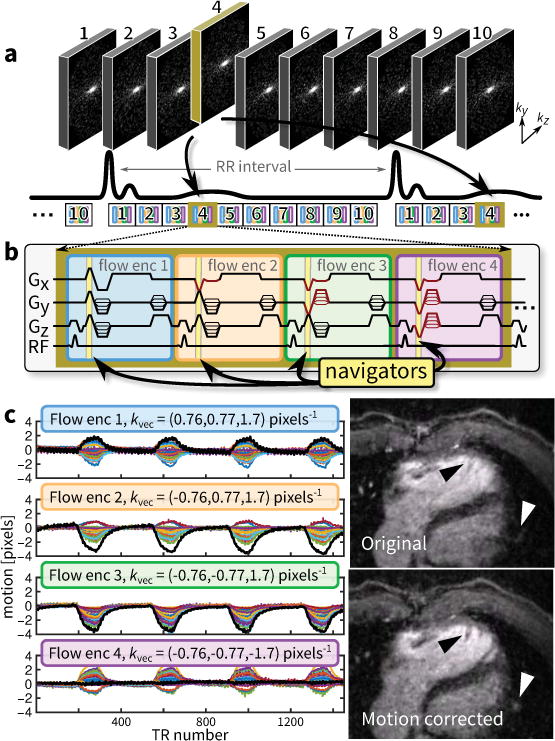
Data acquisition overview for 4D flow. a: Sampling and view-ordering of 10 cardiac phases determined using VDRad that is aligned with the cardiac triggering – for longer RR intervals, patterns are repeated before the next RR interval. b: One flow-encoding unit consisting of four different flow-encoding configurations with built-in Butterfly navigators acquired during the flow-encoding gradients. c: Motion estimated (cardiac motion suppressed with a stop-band filter) from different flow-encodings – each color is from a different channel in a 32-channel cardiac coil receiver. In c, the uncorrected and corrected diastolic phase images (10% acceptance window) from a 4D flow scan using VDRad (9.1 min, R = 23) of a 22-year-old male is shown. To demonstrate the accuracy of the motion estimates, the image is corrected using the linear motion estimate with the largest range (thicker black line in c). The right ventricular trabeculae are sharpened (black triangle); peripheral pulmonary vessels are recovered (white triangle). Because the motion is non-rigid, other portions of the image are blurred. For this work, the motion estimate with the largest range is used to compute weights for the image reconstruction.
Data Acquisition: Motion Estimation using Intrinsic Navigators
Pre-winding gradients in conventional Cartesian sequences can be modified to acquire intrinsic navigators, called Butterfly navigators (17). In this approach, part of the k-space traversal during the pre-winding gradients is repeated for each repetition time (TR). This enables motion detection as well as translation motion estimation. For the original Butterfly navigators, gradient-waveform alterations are necessary and increase scan time. Here, flow imaging provides the opportunity to acquire Butterfly navigators without any gradient-waveform modifications and, therefore, without any overhead. The acquisition window is extended to include the flow-encoding gradients. Each flow-encoding gradient results in a radial k-space trajectory that is already repeated throughout the scan. The acquired data during these flow-encoding gradients can be used in the same way as the original Butterfly navigators to provide intrinsic navigator information.
Four different flow-encoding gradient configurations are typically used to determine three-dimensional flow (Figure 1b). In an unbalanced minimum echo time (TE) flow-encoding setup (18), the four gradient configurations produce four different Butterfly navigators (Figure 1b) where each Butterfly navigator samples a radial spoke in a different k-space quadrant. Motion estimates from four directions are sufficient to estimate translation motion in 3 dimensions for translation motion correction. A simple rigid-body correction can be applied but at the risk of introducing image artifacts at other spatial regions as shown in Figure 1c. To avoid introducing image artifacts and to reduce the reconstruction time in this work, these motion estimates were not used to correct for motion but were used to suppress image artifacts from motion through soft-gating (16) as described in the next section.
Image Reconstruction
A compressed sensing (13,19) and parallel imaging (with ESPIRiT (20)) framework is used to reconstruct undersampled 4D flow scans. The reconstruction is performed by solving the following optimization problem:
| [1] |
where m is the unknown 4D image with 4 flow echoes. A is a linear model that includes ESPIRiT coil-sensitivity maps (20), Fourier transform, and subsampling with reduction factor R. J(m) is a regularization function, and y is the acquired k-space data. W is a diagonal matrix used to weight the data consistency based on the degree of motion that occurred (15,16,21). The entries of W take a value between 0 and 1, and are derived from the Butterfly motion estimates. Data consistency weights for motion-corrupted data will be low compared to data consistency weights for uncorrupted data. In the binary case of assigning weights to be either 0 or 1, the result will be similar to gating. Since the level of corruption is described using the full range between 0 and 1, this scheme is called soft-gating (16). Soft-gating is an additional “relaxed” subsampling operation where the reconstruction will directly use the k-space data if the weights are closer to 1. The reconstruction will recover data that were not originally sampled or that have weights closer to 0.
Based on Ref. (21), the method used to compute the entries of W is described in detail in Ref. (16). Here, an additional pre-processing step is applied for computing the entries in W: the Butterfly motion estimates are first low-pass filtered to remove cardiac motion before computing the weights. This low-pass filter is tuned with a cut-off frequency of 90% the measured cardiac frequency to account for fluctuations in the heart rate during the scan. With the filtered motion estimates, this soft-gating scheme is used primarily for suppressing artifacts from respiratory motion (and, occasionally, bulk patient movement). Each coil element in a multi-channel receiver array produces a spatially-localized motion estimate. Assuming that most of the motion artifacts can be attributed to large movements, the motion estimate with the largest range in motion is selected for computing W. Also, to determine what is considered to be motion-free, each sample of the motion estimate is binned by its magnitude. The motion magnitude based on the largest bin (usually, associated with end-expiration) is used as the reference point with weights computed to be close to 1.
For compressed sensing (13,19), two different regularization terms are considered for Eq. [1]: 1) where Ψx is a spatial wavelet operator that promotes spatial sparsity, and 2) where Dt is a finite difference operator (total variation regularization) in the cardiac-phase dimension that promotes temporal sparsity. Additionally, both terms can be used simultaneously to regularize Eq. [1] – exploiting both spatial sparsity and temporal sparsity.
Implementation
Data were pre-processed using Matlab (Mathworks, Natick, Massachusetts, USA) and were reconstructed by solving Eq. [1] using Alternating Direction Method of Multipliers coded in C1 (22). Reconstruction parameters were experimentally tuned in a few test cases to yield comparable image quality to our current 4D flow acquisition. These parameters were then kept constant for all cases in the study. Coil compression (23) was applied to shorten the reconstruction time. Velocities were corrected for Maxwell phase errors (24) and gradient nonlinearity (25). Background phase errors were characterized by masking out dynamic tissues and by fitting a low order model to the residual phase. The phase errors were then subtracted from the final velocity images. Background phase correction and flow analysis were performed in post-processing software, Arterys (Arterys, San Francisco, California, USA).
Experimental Setup
All 4D flow studies were performed on a GE MR750 3T scanner (GE Healthcare, Waukesha, Wisconsin, USA) using a 32-channel cardiac coil (Invivo, Gainesville, Florida, USA). The sequence consisted of unbalanced minimum TE flow-encoding gradients (18) in a cardiac synchronized 3D Cartesian RF-spoiled gradient echo sequence (GE Healthcare: SPGR). Scan parameters included flip angle of 15°, TE of 1.8–1.9 msec, TR of 3.9–4.3 msec with an additional 5.1 msec for a standard fat-saturation pulse (volumetric spectral 90°-pulse followed by spoiling gradients), and bandwidth of ±83.33 kHz. A velocity encoding range (VENC) of 250 cm/s was used to avoid velocity aliasing in the aortic and pulmonary flows for most pediatric patients (4,8). Scans were performed after injection of 0.1 mL/kg ferumoxytol (Feraheme; AMAG Pharmaceuticals, Waltham, Massachusetts, USA) for blood pool enhancement (26,27). General anesthesia was used in the majority of cases. Population details and other scan parameters are summarized in Table 1 and are described in more detail, including CHD specifics, in Table E1.
Table 1.
Characteristics of the patient population and scan parameters.
| mean ± std | range | ||
|---|---|---|---|
| Patient statistics: | Gender | 15 males, 8 females | |
| Age [years] | 6.3±5.2 | 0–22.1 | |
| Heart rate [beats/min] | 92.1±23.4 | 55–143 | |
| Weight [kg] | 20.3±9.8 | 3–38.9 | |
| Congenital heart defect* | |||
| Congenitally corrected TGA | 17.4% (N = 4) | ||
| Repaired Tetralogy of Fallot | 13.0% (3) | ||
| Heterotaxia | 8.7% (2) | ||
| Bicuspid aortic valve | 4.4% (1) | ||
| Hypoplastic left heart | 4.4% (1) | ||
| Hypoplastic right ventricle | 4.4% (1) | ||
| Coarctation of aorta | 8.7% (2) | ||
| Aortic arch hypoplasia | 4.4% (1) | ||
| Congenital pulmonary stenosis | 4.4% (1) | ||
| Repaired TGA | 4.4% (1) | ||
| Shone’s syndrome | 4.4% (1) | ||
| Other (normal anatomy) | 21.7% (5) | ||
|
| |||
| Scan setup: | Matrix | 320×220×120 | |
| Flip angle [degree] | 15° | ||
| Bandwidth [kHz] | ±83.33 | ||
| Velocity-encoding [cm/sec] | 250 in all 3 axes | ||
| Field of view [cm] | (25.0±2.2, 17.5±1.6, 16.9±1.7) | ||
| TE [msec] | 1.8±0.03 | 1.8–1.9 | |
| TR [msec] | 9.1±0.09 | 9.0–9.4 | |
| Time per TR for fat-saturation [msec] | 5.1 | ||
| Reduction factor (R) | 19.3±3.7 | 15.0–27.5 | |
| 1. VDPoisson: | Scan time [min] | 9.4±1.4 | 6.1–11.6 |
| Views-per-segment | 3.3±0.8 | 2–6 | |
| 2. VDRad: | Scan time [min] | 8.7±1.6 | 5.8–11.3 |
| k-Space center average | 3.0±1.0 | 2–6 | |
| Method A: | Temporal resolution [msec] | 121.7±28.8 | 72.9–225.6 |
| Methods B–D: | Temporal resolution [msec] | 36.5±0.35 | 36.0–37.5 |
Values are mean ± standard deviation and range if applicable.
A summary of the different congenital heart defects is also described with percentage of total patients and number of patients in parenthesis. TGA = transposition of the great arteries.
For each study, two Cartesian 4D flow scans were performed: a control scan using VDPoisson (scan time of 6.1–11.3 min), and a scan using VDRad (6.2–11.6 min). A constant reduction factor R of 10.6 was first set for method A. This factor was selected to consider parallel imaging capabilities of the 32-channel receiver coil-array and the additional factor enabled by compressed sensing. With the prescribed views-per-segment in method A and the different heart rates, the actual reduction factor R ranged from 15.0 to 27.5. VDRad scans were prescribed to match this factor. Due to the long half-life (14–15 hrs) of ferumoxytol (27), no noticeable difference in blood pool contrast was observed between the two scans; this enabled fair comparisons for image evaluation. The same imaging parameters were prescribed for both scans. The scan using VDRad was slightly longer (by ~10%) because VDRad was designed to re-sample the center of k-space for increasing robustness to motion and for enabling motion compensation techniques (16).
Four different methods were applied to reconstruct 20 cardiac phases:
VDPoisson scan reconstructed with spatial wavelets to promote spatial sparsity,
Total variation regularization in the cardiac-phase dimension added to method A,
VDRad scan reconstructed using the same reconstruction as in B, and
Soft-gating added to method C for suppressing artifacts from motion.
Since no temporal constraint was used for method A, data collected were interpolated to 20 cardiac phases. In all other methods, data were binned to the nearest cardiac phase resulting in a higher temporal resolution (Table 1). For RR intervals shorter than the average by 10%, arrhythmia was assumed to have occurred and the data from that particular interval were rejected and immediately reacquired.
Method A provided a starting point that has been previously validated in terms of flow and ventricular function quantification (4,8,28). Altering only one component between each method allowed for the analysis of the effectiveness of each step:
A–B: focuses on the effect of including the temporal constraint,
B–C: focuses on the effect of using VDRad instead of VDPoisson, and
C–D: focuses on the effect of including soft-gating for suppressing image artifacts from motion.
A 2D multi-slice short-axis CINE stack acquired using balanced steady-state free precession (bSSFP) (GE Healthcare: FIESTA) was used for reference. Cases with 2D CINE bSSFP acquired in the same exam were retrospectively identified. Scan parameters included TR of 3.4 msec, TE of 1.5 msec, flip angle of 60°, views-per-segment of 14, and 3 signal averages. These scans had a mean temporal resolution of 47.6 msec; this is similar to method D with a mean of 36.5 msec. These images were also acquired post ferumoxytol administration.
Subjects and Image Evaluation
With IRB approval, HIPAA compliance, and patient informed assent/consent, patients referred for ferumoxytol-enhanced cardiac MRI for evaluation of CHD between May and September 2014 were recruited. The population (mean, 6.3 years; range, 2 days – 22.1 years) included 15 males (mean, 6.3 years; range, 2 days – 22.1 years) and 8 females (mean, 6.2 years; range, 8 months – 17.8 years). All evaluations were performed retrospectively from the prospectively acquired data.
Two cardiovascular radiologists (S. S. V. and K. H. with 8 and 2 years of experience, respectively) independently evaluated the magnitude data for the four sets of images according to the following features: a) overall image quality, b) motion ghosting, c) hepatic vessels, d) aortic valve, e) tricuspid valve, and f) coronary arteries on a scale of 1 (nondiagnostic) to 5 (excellent). The scoring criteria for each feature are described in detail in Table E2. In MATLAB, image sharpness was also calculated using gradient entropy, a metric highly correlated with observed image sharpness (29). To eliminate bias introduced when selecting arbitrary regions of interest, the gradient entropy metric was computed for the entire image volume and averaged across the different cardiac phases. Additionally, each reader performed a side-by-side comparison between methods C and D on an ordinal scale of -2 (greater delineation in C) to 2 (greater delineation in D).
The readers also evaluated the diagnostic performance of method D in standard segmental and anatomical analysis for CHD anatomy: superior/inferior vena cava connection, atrial situs, atrioventricular concordance, ventriculoarterial concordance, branch pulmonary artery stenosis, pulmonary vein connections and stenosis, arch vessel origins and stenosis, and coronary origins. The readers independently diagnosed each feature as being abnormal or normal, and they scored their confidence in their diagnosis on a scale from 0 (guessing) to 3 (definite). The interpretations were compared with the full patient medical record that included MRI report, echocardiography, and operative notes.
For functional assessment, a side-by-side comparison between method D (magnitude images reformatted to the short-axis orientation) and 2D bSSFP scan was performed. Each reader scored the paired assessment for myocardial borders and cardiac motion on an ordinal scale of -2 (greater depiction in the 2D bSSFP) to 2 (greater depiction in method D).
Measured flow through the aorta and pulmonary arteries in methods B–D were compared to measured flow in the control method A. For each method, internal controls were also used: the total aortic flow should be equal to the pulmonary flow, and the total flow in the main pulmonary artery should be equal to the sum of the flow in the right pulmonary branch and the flow in the left pulmonary branch. In subjects with anomalies in these arteries, flow was measured in equivalent circuits. Subjects were excluded from this analysis if they had shunts and had no equivalent flow circuits.
Statistical Methods
A paired Wilcoxon test evaluated the null hypothesis that there was no significant difference in scores between different methods. For paired comparison evaluations, a Wilcoxon signed rank test evaluated the null hypothesis that there was no significant preference of one method over the other. Sensitivity and specificity were calculated for the segmental anatomical assessment. Inter-observer agreement was evaluated by weighted kappa coefficient (κ). The agreement between any two flow measurements was evaluated using both Bland-Altman analysis and Pearson correlation coefficient (r). P < 0.05 was considered statistically significant. Relevant statistical values were computed in R (30).
RESULTS
Image Evaluation and Image Sharpness
A summary of the image evaluation is shown in Figure 2 and Table 2. The two readers had moderate to almost perfect agreement for all criteria (κ ≥ 0.46, Table E3). Representative images are shown in Figures 3 and 4.
Figure 2.
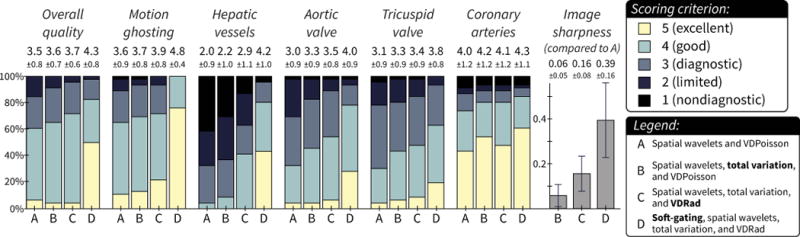
Image assessments with relative image sharpness (computed using gradient entropy metric). See supplementary material for specific scoring criteria for each feature. Each bar represents the percentage of cases with the same score from both readers. The mean ± standard deviation is denoted above each bar. The majority of cases had diagnostic quality with each reconstruction, but method D had significantly improved scores for most features. A larger improvement was observed for features sensitive to respiratory motion (motion ghosting and hepatic vessels). The relative image sharpness compared to method A had a similar progression: method D had the most significant difference in improved scores.
Table 2.
Image assessment: P values of the Wilcoxon signed rank test (reader 1/reader 2) with mean and standard deviation of difference for image sharpness.
| A vs. B | A vs. C | B vs. C | A vs. D | B vs. D | C vs. D | |
|---|---|---|---|---|---|---|
| Overall | 0.32/0.16 | 0.32/<0.05 | 0.32/<0.05 | <0.05/<0.05 | <0.05/<0.05 | <0.05/<0.05 |
| Motion ghosts | 0.16/0.08 | 0.06/<0.05 | 0.18/0.18 | <0.05/<0.05 | <0.05/<0.05 | <0.05/<0.05 |
| Hepatic vessels | <0.05/0.16 | <0.05/<0.05 | <0.05/<0.05 | <0.05/<0.05 | <0.05/<0.05 | <0.05/<0.05 |
| Aortic valve | <0.05/<0.05 | <0.05/<0.05 | 0.48/<0.05 | <0.05/<0.05 | <0.05/<0.05 | <0.05/<0.05 |
| Tricuspid valve | <0.05/0.10 | <0.05/<0.05 | 1.00/<0.05 | <0.05/<0.05 | <0.05/<0.05 | <0.05/<0.05 |
| Coronary | 0.32/<0.05 | 1.00/<0.05 | 0.41/0.56 | 0.16/<0.05 | 0.32/0.10 | 0.16/0.06 |
| Image sharpness | <0.05 (0.06±0.05) | <0.05 (0.15±0.08) | <0.05 (0.10±0.07) | <0.05 (0.39±0.17) | <0.05 (0.36±0.17) | <0.05 (0.24±0.13) |
A = VDPoisson scan reconstructed using spatial wavelets; B = VDPoisson scan reconstructed using spatial wavelets and temporal total variation; C = VDRad scan reconstructed using spatial wavelets and temporal total variation; D = soft-gating added to C. Gradient entropy is used to estimated image sharpness. Statistically significant P values are bolded (P < 0.05).
Figure 3.
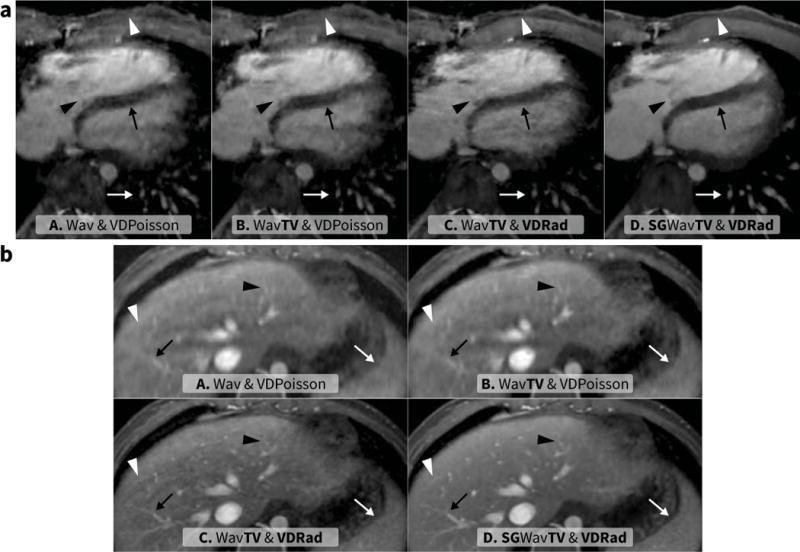
Representative image comparisons – a: 22-year-old male with congenital pulmonary stenosis, post ventricular septal defect repair, and right ventricle to pulmonary artery conduit placement; b: 3.8-year-old male with coarctation and an anomalous origin of the left subclavian artery. The following 4D methods were used: method A consisted of compressed sensing and parallel imaging reconstruction with spatial wavelets using VDPoisson scan (6.8 min and R = 23 for a, 9.0 min and R = 17.1 for b), method B had temporal constraint using total variation added to A, method C consisted of the same reconstruction as B using VDRad scan (9.1 min and R = 23 for a, 10.1 min and R = 17.1 for b), and method D had soft-gating added to C. In a, an axial slice depicts a sharpened chest wall (white triangle), tricuspid valve septal leaflet (black triangle), interventricular septum (black arrow), and pulmonary vessels (white arrow). In b, the features highlighted include hepatic vessels (black arrow and black triangle), spleen (white arrow), and motion ghosting (white triangle most apparent in C).
Figure 4.
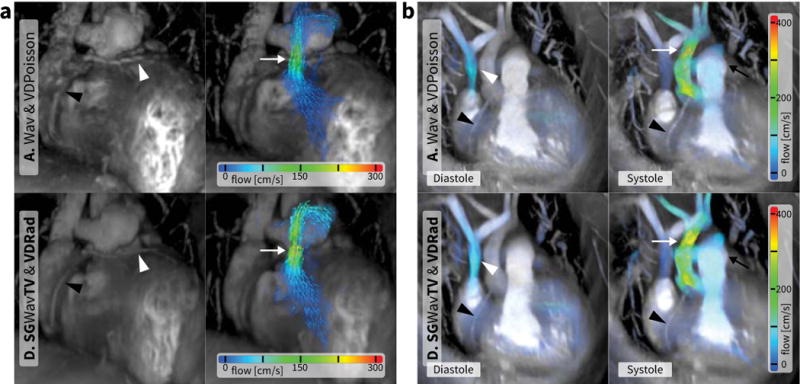
4D flow scans – a: 7.5-year-old male with aortic arch hypoplasia, b: 2.1-year-old male with Shone’s syndrome after coarctation repair. Results from method A (spatial Wavelet and VDPoisson; 7.9 min and R = 19.6 for a, 6.1 min and R = 27.2 for b) are shown in the top row. Results from method D (include total variation, soft-gating, and VDRad; 7.9 min and R = 19.6 for a, 6.2 min and R = 27.2 for b) are shown in the bottom row. In the left column of a, surface renderings of the most motion-quiescent cardiac phase depict the coronary arteries (triangles) with an anomalous coronary wrapping around the pulmonary artery (white triangle). In the right column of a, the systolic phases are surface rendered with overlaid color velocity vectors. The flow can be seen going through the pulmonary artery (white arrow). With reduced artifacts from motion, the renderings from method D (bottom) more clearly delineate the coronary arteries and the recirculating flow in the left pulmonary artery. In b, both diastole (left) and systole (right) are surface rendered with velocity color overlay. In diastole, the flow into the right atrium and right ventricle can be seen (white triangle). In systole, the flow through both the aorta (white arrow) and the pulmonary arteries (black arrow) are visualized. High spatial resolution can be appreciated through the depiction of the right coronary artery (black triangle) in b for both methods. With minimal respiratory motion in the small patient, artifacts from motion are not substantial. Since soft-gating adds an additional reduction factor, the reduction of motion artifacts comes at the cost of SNR.
Compared to the control method, no significant difference in scores was observed with use of a temporal constraint (method B) and VDRad (method C). With the addition of soft-gating (method D), the improvement in overall image quality was statistically significant with a mean score of 4.3 compared to 3.5 from both readers. Furthermore, for method D, over 95% of the cases were evaluated as at least diagnostic quality with respect to overall image quality.
The two features most sensitive to respiratory motion, motion ghosting and hepatic vessel delineation, benefited the most from soft-gated reconstruction as seen in Figure 3. For motion ghosting, a statistically significant improvement was observed with soft-gating with a mean score of 4.8 compared to the other methods (A: 3.6, B: 3.7, and C: 3.9) with P < 0.05. A greater improvement was observed for hepatic vessel delineation with means of 2.0 for method A, 2.2 for B, and 2.9 for C compared to a mean of 4.2 for method D (P < 0.05).
For the assessment of the aortic and the tricuspid valves (Figure 3a), significantly better delineation of both valves was observed with method D (mean of 4.0 and 3.8 for the aortic valve and tricuspid valve, respectively) compared to method A (mean of 3.0 and 3.1), B (3.3 and 3.3), and C (3.5 and 3.4) with P < 0.05.
Less dramatic improvement for visualization of the coronary arteries was observed with the additional steps of data acquisition and image reconstruction. Example images depicting the coronary arteries are shown in Figure 4. The mean score for method D was 4.3 compared to 4.0 for A, 4.2 for B, and 4 for C.
The results for the calculated image sharpness are summarized in Figure 2 and Table 2. Relative to method A, both B and C resulted in significantly improved image sharpness with an average increase of 0.06 and 0.15 with P < 0.05. The improvement in image sharpness was even greater for method D compared to method A (average difference of 0.39), B (0.36), and C (0.24) with P < 0.05.
Paired Image Assessment: Non-Soft-Gated and Soft-Gated Reconstruction
Both readers scored the soft-gated reconstruction (method D) as aesthetically better or with greater delineation in the majority of cases compared to method C (P < 0.05). Even though there was no statistically significant improvement in depiction of the coronary arteries between methods C and D, greater preference was given to D in the side-by-side comparison (P < 0.05). A summary of the paired assessment is described in Figure 5.
Figure 5.
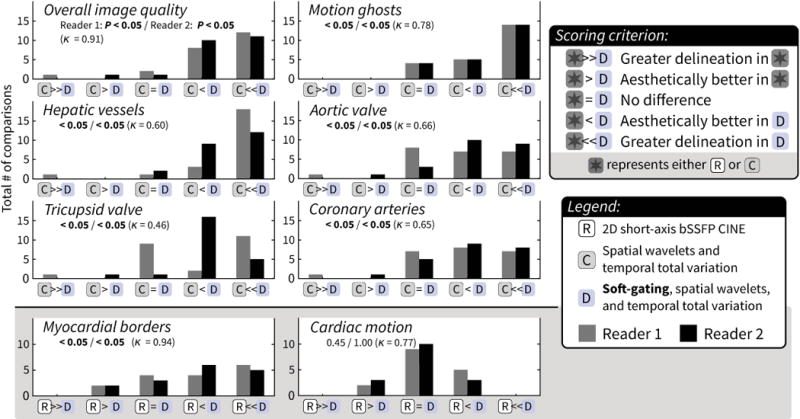
Histograms of paired assessments – top: between methods C and D to evaluate impact of motion-compensation through soft-gating, bottom: between method D and reference 2D bSSFP (R) to evaluate functional quality in method D. P values from both readers and the inter-observer agreement (κ) are annotated in each plot. For most features, both readers rated the soft-gated reconstruction (D) as being aesthetically better or having greater delineation when compared to the non-soft-gated reconstruction (C) with P < 0.05. An outlier case was observed where C was preferred; most likely, too much data were discarded when soft-gating was applied. A slightly longer scan time may have been necessary. Method D was also preferred for myocardial borders compared to 2D bSSFP (P < 0.05). This method had similar results to 2D bSSFP in regards to cardiac motion.
Segmental Anatomical Assessment
In assessing cardiac anatomy with method D, both readers had high sensitivity (≥ 0.86) as compared with the patient record (Table 3). Due to the low frequency of some anatomical feature abnormalities, the 95% confidence interval for specificity was wider. Nevertheless, both readers had high specificity (1.00) for 9 out of the 10 anatomical features. The readers had substantial inter-observer agreement (κ = 0.66) for identifying the presence of an abnormality for each patient and almost perfect inter-observer agreement (κ = 0.85) when comparing the results for all features together. Lower confidence for the diagnosis of coronary origins was in accordance with the lower image assessment scores given to the coronary arteries. Also, poor inter-observer agreement was observed for the analysis of branch pulmonary artery stenosis.
Table 3.
Sensitivity and specificity (with 95% confidence interval in parenthesis) of segmental anatomical assessment of method D as compared with the full patient chart (reader 1/reader 2).
| Anatomical feature | # of abnormal (N = 23) | Sensitivity | Specificity | Confidence* |
|---|---|---|---|---|
| Superior vena cava connection | 4 | 1.00 (0.8, 1.0)/1.00 (0.8,1.0) | 1.00 (0.3,1.0)/1.00 (0.3,1.0) | 3.0±0.0/3.0±0.2 |
| Inferior vena cava connection | 2 | 0.95 (0.8,1.0)/1.00 (0.8,1.0) | 1.00 (0.1,1.0)/1.00 (0.1,1.0) | 3.0±0.0/3.0±0.2 |
| Atrial situs | 2 | 1.00 (0.8,1.0)/1.00 (0.8,1.0) | 1.00 (0.1,1.0)/1.00 (0.1,1.0) | 3.0±0.0/2.8±0.6 |
| Atrioventricular concordance | 5 | 1.00 (0.7,1.0)/0.94 (0.7,1.0) | 1.00 (0.4,1.0)/1.00 (0.4,1.0) | 3.0±0.2/2.8±0.5 |
| Ventriculoarterial concordance | 7 | 1.00 (0.8,1.0)/1.00 (0.7,1.0) | 1.00 (0.5,1.0)/1.00 (0.5,1.0) | 3.0±0.2/3.0±0.2 |
| Branch pulmonary artery stenosis | 2 | 1.00 (0.8,1.0)/0.86 (0.6,1.0) | 0.50 (0.0,1.0)/0.50 (0.0,1.0) | 3.0±0.0/2.4±0.8 |
| Pulmonary veins entry/stenosis | 2 | 1.00 (0.8,1.0)/0.95 (0.8,1.0) | 1.00 (0.1,1.0)/1.00 (0.1,1.0) | 3.0±0.0/2.8±0.5 |
| Aortic arch stenosis | 2 | 1.00 (0.8,1.0)/1.00 (0.8,1.0) | 1.00 (0.1,1.0)/1.00 (0.1,1.0) | 3.0±0.0/3.0±0.2 |
| Arch vessel stenosis/anomaly | 0 | 1.00 (0.8,1.0)/1.00 (0.8,1.0) | N/A | 3.0±0.0/2.9±0.4 |
| Coronary origins | 2 | 1.00 (0.8,1.0)/1.00 (0.8,1.0) | 1.00 (0.1,1.0)/1.00 (0.1,1.0) | 2.3±1.1/2.0±1.1 |
Reader confidence is scored as 0 = guessing, 1 = moderate, 2 = high, and 3 = definite. Confidence is displayed as mean ± standard deviation. +Inter-observer agreements of κ = 0.85 for each anatomical feature individually, and κ = 0.66 for each patient as a whole.
Paired Functional Assessment: Soft-gated Reconstruction and 2D bSSFP
For 16 cases, the 2D short-axis bSSFP CINE acquisition was also performed. Comparing method D with this 2D approach, method D was significantly preferred by both readers for the depiction of the myocardial borders (P < 0.05, κ = 0.94). In regards to the depiction of cardiac motion, both readers (κ = 0.77) had no notable preference for either method. This paired assessment is summarized in Figure 5, and a representative example is shown in Figure 6.
Figure 6.
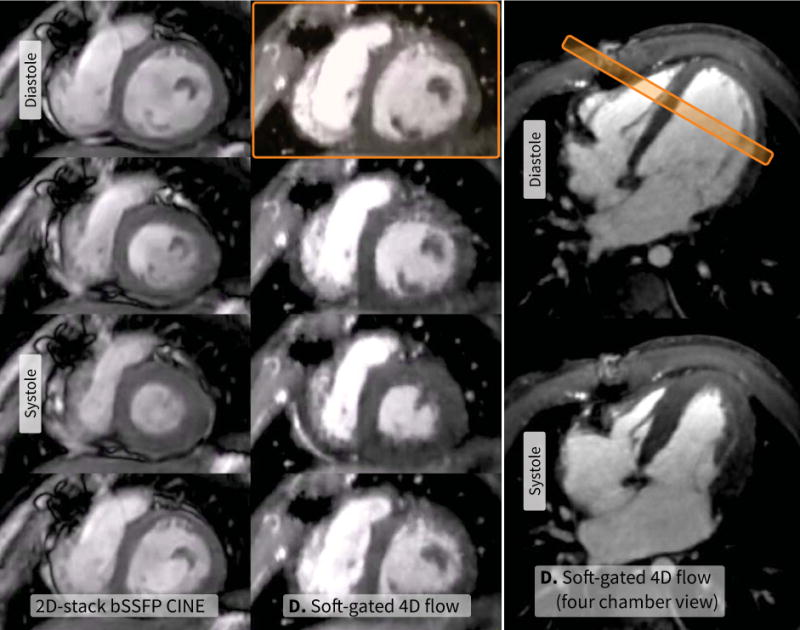
Short-axis 2D multi-slice bSSFP CINE scan (left, 3.1 min, resolution of 0.55×0.55 mm2 with 7-mm-thick slices) and a 4D flow scan with method D (middle: short-axis reformat, right: four-chamber reformat, R = 18.5, 9.4 min, resolution of 0.75×0.65×1.4 mm3) of a 4.0-year-old female with a hypoplastic right ventricle. Result from the reference 2D scan is shown on the left. Four of 20 cardiac phases are displayed including end diastole and end systole. Even though 4D flow had lower spatial resolution and lower SNR that was further reduced with a high reduction factor, no significant preference for the two acquisitions was given for myocardial borders and cardiac motion.
Flow Analysis
A summary of the flow analysis (N = 20) is shown in Table 4. One case was excluded from flow quantification due to the inability to accurately measure flow in the right pulmonary artery: the patient had a surgical pulmonary band that resulted in signal dephasing from highly turbulent flow. For all methods, high correlation was observed between aortic and pulmonary flows (r: 0.85–0.95, P < 0.01). There was little bias with a Bland-Altman mean less than 0.03% and a 95% confidence interval of all within ±0.38%. Even higher correlation between total flow in the main pulmonary artery and the sum of flows in the right and left pulmonary arteries was observed (r: 0.96–0.98, P < 0.01). This comparison had little bias with a Bland-Altman mean less than 0.03% and a 95% confidence interval all within ±0.24%. Representative images are shown in Figure 4.
Table 4.
Flow analysis for N = 20 using Bland-Altman (mean ± 1.96 standard deviation) and Pearson correlation coefficient (r). All r results had P < 0.01.
| Internal controls | Compared to method A | |||||||||||
|---|---|---|---|---|---|---|---|---|---|---|---|---|
| Aortic = PA flow | PA flow: main = right + left | Aortic flow | Main PA flow | Right PA flow | Left PA flow | |||||||
| BAb [%] | r | BAc [%] | r | BA [%] | r | BA [%] | r | BA [%] | r | BA [%] | r | |
| A | 0.02±0.25 | 0.95 | −0.01±0.17 | 0.97 | – | – | – | – | – | – | – | – |
| B | 0.00±0.31 | 0.91 | 0.02±0.17 | 0.96 | −0.04±0.28 | 0.95 | −0.05±0.29 | 0.96 | −0.04±0.31 | 0.94 | −0.03±0.32 | 0.96 |
| C | 0.02±0.32 | 0.85 | −0.01±0.24 | 0.98 | −0.06±0.45 | 0.91 | −0.07±0.74 | 0.91 | −0.13±0.49 | 0.87 | 0.00±0.48 | 0.97 |
| D | −0.01±0.38 | 0.89 | 0.00±0.23 | 0.97 | −0.03±0.33 | 0.90 | −0.05±0.42 | 0.88 | −0.06±0.52 | 0.84 | −0.08±0.64 | 0.89 |
PA = pulmonary artery; A = VDPoisson scan reconstructed using spatial wavelets; B = VDPoisson scan reconstructed using spatial wavelets and temporal total variation; C = VDRad scan reconstructed using spatial wavelets and temporal total variation; D = soft-gating added to C.
Bland-Altman values as a percentage of aortic flow.
Bland-Altman values as a percentage of main PA flow.
For methods B–D, net flow through the aorta, right and left pulmonary branches, and the main pulmonary artery demonstrated high correlation compared to control method A (r: 0.84–0.97, P < 0.01). Additionally, high agreement was observed from the Bland-Altman analysis with a mean less than 0.14% and a 95% confidence interval of all within ±0.74%.
DISCUSSION
Typical CHD MRI exams consist of a lengthy, complex protocol of multiple 2D sequences in multiple planes to assess blood flow, ventricular function, segmental anatomy, and extra-cardiac vascular stenoses. As an alternative to 2D phase contrast MRI, 4D flow has been proposed and has been investigated as a method of comprehensive flow and function evaluation. However, to be truly comprehensive as a single sequence, the sequence must also provide anatomical assessment. Here, we have developed a combination of k-space ordering, intrinsic navigation, and compressed sensing to achieve a comprehensive single sequence protocol with contrast-enhancement. We found that anatomical assessment was significantly improved without compromising function or flow assessment. Further work will be required to delineate the coronary arteries.
We were able to draw several conclusions about our proposed techniques. First, for the compressed sensing reconstruction, the addition of total variation in the cardiac-phase dimension (comparing method A to B) did not significantly improve image assessment for most features. More importantly, aortic and pulmonary flow analyses were not impacted. Second, a minor improvement in certain features was observed when VDRad was used instead of VDPoisson (comparing method B to C). For VDPoisson, collecting different k-space samples for each RR interval unintentionally resulted in a degree of incoherence in the temporal dimension; this was helpful for compressed sensing. VDRad was designed to improve upon this feature by purposely introducing sampling incoherence in the temporal dimension through a pseudo-random scheme. Lastly, motion artifact suppression (method D) was determined to be the most important factor in improving diagnostic image quality.
To focus our study, we evaluated the impact of incrementally adding components to the current 4D flow technique. Soft-gating can also be added to either method A or B, both with VDPoisson. As an additional relaxed subsampling operation, the performance of soft-gating relies on the accelerated image reconstruction, and thus, we infer that either the added temporal constraint or lower reduction factors are necessary. Furthermore, without re-sampling the center of k-space, soft-gating can potentially result in too high of a reduction factor for the k-space center; this impacts the parallel imaging reconstruction and creates a non-ideal situation for compressed sensing (13,19). The re-sampling of the k-space center can be adopted for VDPoisson; however, this modification does not generate sampling patterns that are different for each cardiac phase. Thus, the acquisition cannot fully leverage compressing sensing with a temporal constraint. We believe that the performance and reliability of soft-gating depends on both VDRad and additional compressed sensing constraints.
The proposed approaches enabled anatomical assessment in 4D flow. An alternative approach is acquiring separate high-resolution CINE scans in multiple oblique planes in addition to the 4D flow acquisition. This anatomical assessment can also be obtained with a separate black blood imaging sequence. Similar to CINE scans, these sequences are performed in multiple oblique planes and may require breath holds, or suspended respiration for patients under anesthesia. A single comprehensive time-resolved volumetric scan enables a short exam, ~10 min, whereas conventional cardiac MRI exams are much longer. No knowledge of CHD variant anatomy is required by the MR technologist, as no oblique planes need to be prescribed.
The total time for the compressed-sensing-based reconstruction (including reading/writing of the large dataset) is approximately 1 hour on our server with four GPU’s, two 10-core CPU’s, and 128-GB of memory. The reconstruction is highly parallelizable and has the potential to be shortened significantly with cluster-based computing (31). In the paradigm of simplifying the CHD exam with a single 4D flow sequence, we separate the necessity of a specially trained radiologist with executing the MR exam. Thus, the high-resolution dataset does not need to be immediately reconstructed. A simple time-averaged reconstruction can be easily performed quickly (< 5 min), and such a reconstruction is sufficient for operator feedback to verify successful contrast administration and proper scan prescription. Interpretation can be performed later offline.
Non-Cartesian and echo-planar imaging variants of 4D flow have been demonstrated to reduce scan time through time-efficient k-space sampling trajectories (32–34). The techniques developed here are not limited to Cartesian imaging. The Butterfly navigators can be integrated into other phase-contrast sequences and have minimal impact to the acquisition compared to alternate navigated approaches (35,36). Accurate motion measurements would enable sophisticated motion correction techniques such as autofocusing (17) that have been shown to be more effective in improving diagnostic image quality compared to soft-gating alone (16).
Though not included in the CHD image evaluation, an increase in sharpness was observed in the pulmonary vessels when soft-gating was included in the reconstruction. This finding suggests that 4D flow has potential for evaluating pulmonary vascular disease with flow quantification. The same will be true for assessing renal arteries and other regions particularly sensitive to respiratory motion. For finer vessels such as the coronary arteries, lower reduction factors may be necessary to maintain sufficient signal-to-noise ratio (SNR). Also, a lower VENC (<100 cm/s) will be needed to accurately quantify slower flows in smaller vessels. The larger velocity-encoding gradients needed will either lengthen the scan or decrease the temporal resolution from extending the TE and TR. The proposed techniques should be directly applicable with the added benefit of more data samples for Butterfly navigators from the larger velocity-encoding gradients.
We demonstrated our methods with ferumoxytol enhancement. The long half-life of ferumoxytol minimized signal modulation from the decaying contrast concentration within one scan; this should have reduced associated image artifacts that would otherwise be exacerbated with pseudo-random view-ordering schemes. The long half-life also allows us to perform a fair comparison between two different 4D flow acquisitions for each subject. One major consideration for ferumoxytol is the shortening of T2* (27), a concern for longer TE’s required for lower VENC’s. In our study, we observed that the majority of scans had diagnostic image quality as a result of sufficient delineation between blood pool and myocardium.
Care must be taken for off-label use of ferumoxytol for contrast enhancement as potential risks include anaphylaxis resulting in hypotension. Especially after recent revised FDA box warnings (37), the risks associated with ferumoxytol must be balanced with the benefits of reducing exam durations, reducing breath-holding requirements, and minimizing the duration and depth of anesthesia for pediatric patients. A possible alternative is gadofosveset trisodium (Ablavar; Lantheus Medical Imaging, N. Billerica, Massachusetts, USA). Future work includes tuning the imaging parameters and contrast dose for optimal enhancement with ferumoxytol and applying the proposed methods with other contrast agents.
We demonstrated the benefit of incorporating a method for suppressing artifacts from respiratory motion to improve diagnostic image quality. Though the improved diagnostic image quality should result in a more accurate diagnosis (4,8), a limitation of this study was that it did not show whether the improvement in image quality will impact patient management. Another limitation was that we were unable to conclude whether the improved image quality from suppressing motion artifacts also improves flow quantification accuracy. Internal controls were used for the flow analysis to evaluate internal consistencies, and flow was compared to a previously reported and verified setup, method A (4,8,28). The purpose of this work is to enable and to demonstrate anatomical assessment with 4D flow. The impact of higher reduction factors on flow quantification accuracy will be investigated in future studies. Lower reduction factors may be required to maintain accurate flow features such as peak velocities. Lowering reduction factors will also benefit anatomical assessment, which we have shown here to be feasible even with high reduction factors. Additionally, the shortening of T1 and T2* from ferumoxytol enhancement results in “hyper-enhancement” in bSSFP (38). Alternatively, ferumoxytol-enhanced 2D gradient echo CINE or non-contrast-enhanced 2D bSSFP CINE can be used as a reference for image comparison. In our experience, ferumoxytol-enhanced bSSFP has higher SNR and has very good blood-pool myocardial contrast. Thus, the use of ferumoxytol biased the study in favor of bSSFP over 4D flow. Despite the in-flow enhancement in conventional 2D sequences and the different contrast mechanisms, 4D flow was found to be comparable to the 2D reference in myocardial borders and wall motion with high inter-observer agreement. Additional readers may be necessary to assess whether the different contrast mechanism impacts diagnosis. In our setup, the diagnosis of each feature from method D was compared to the full patient report which, at times, lacked true external validation. Even so, the study provided data in validating 4D flow for anatomical assessment instead of conventional MR sequences that require additional scan time and operator expertise. Lastly, a limitation in the segmental anatomical assessment of method D was the limited number of cases – especially since these cases were retrospectively identified. This led to a small number of abnormal cases that resulted in wide 95%-confidence intervals for specificity. Also, a degree of bias was observed in the diagnosis of branch pulmonary artery stenosis due to differing judgment on where the main pulmonary branch ends. A representative image is shown in Figure E1 where high flow velocities were observed in the pulmonary artery near the lower lobe. Fortunately, the readers had substantial inter-observer agreement for all other CHD features in the segmental anatomical assessment.
In conclusion, we have developed motion-compensation techniques for 4D flow: intrinsic navigation with Butterfly navigators, pseudo-random sampling and view-ordering using VDRad, and soft-gated compressed-sensing reconstruction. With the assessment of function and flow, motion-compensated accelerated imaging enables and significantly improves anatomical assessment in 4D flow with ferumoxytol enhancement to achieve a comprehensive CHD exam.
Acknowledgments
Grant Support: Child Health Research Institute, Lucile Packard Foundation for Children’s Health (UL1 TR001085), NIH R01-EB009690, NIH P41-EB015891, NIH R01-EB019241, AHA 12BGIA9660006, Sloan Research Fellowship, and GE Healthcare
APPENDIX
Figure E1.
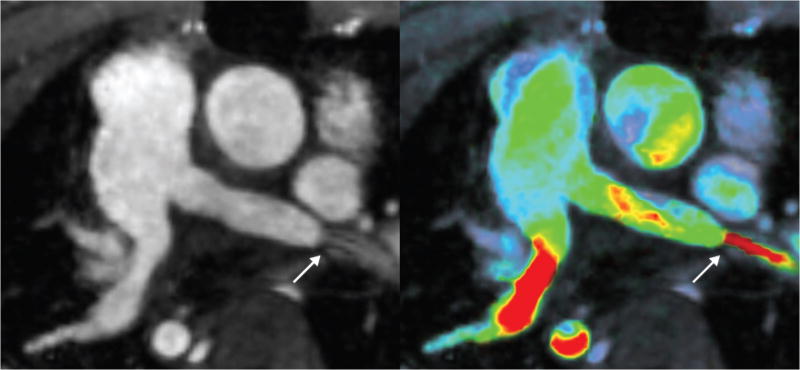
A 4.1-year-old male with diffuse ateriopathy (post-repair) imaged using 4D flow with method D: magnitude only (left) and magnitude with velocity overlay (right). The original echocardiography reported a mild stenosis. Here, the stenosis in the left pulmonary artery is emphasized by high flow velocities (arrow). Since the location of the stenosis is near the lower lobe, the two readers interpreted the finding differently for the segmental anatomical assessment: one reader interpreted it as normal main branch pulmonary artery with stenosis in the lower lobe area and another as stenosis in the branch pulmonary artery.
Table E1.
Scan parameters and patient characteristics.
| #a | Age [yrs] |
Sex | HRb [bpm] |
Weight [kg] |
FOV (x,y,z) [cm] | VDPoisson | VDRad | Shunt | Clinical indicationc | ||
|---|---|---|---|---|---|---|---|---|---|---|---|
| R | Time [min] |
R | Time [min] |
||||||||
| 1 | 10.8 | M | 58 | 26.4 | (26.0,18.2,19.2) | 14.6 | 11.3 | 15.9 | 11.6 | Aortic coarctation | |
| 2 | 22.1 | M | 97 | 33.3 | (26.0,18.2,21.6) | 23.0 | 6.8 | 23.0 | 9.1 | Congenital pulmonary stenosis; post VSD repair, RV to PA conduit | |
| 3 | 17.8 | F | 71 | 38.9 | (26.0,18.2,16.8) | 17.7 | 9.2 | 17.7 | 9.3 | Hypoplastic left heart | |
| 4 | 7.5 | M | 55 | 23.5 | (26.0,18.2,16.8) | 19.6 | 7.9 | 19.6 | 7.9 | Aortic arch hypoplasia, right ventricular outflow tract stenosis. | |
| 5 | 4.0 | M | 98 | 21.5 | (26.0,18.2,16.8) | 25.1 | 6.6 | 25.1 | 7.0 | Post cardiac arrest | |
| 6* | 0.0 | M | 120 | 3.4 | (26.0,18.2,16.8) | 24.3 | 7.2 | 24.3 | 7.3 | Y | Delineate complex congenital heart anatomy |
| 7* | 6.9 | M | 89 | 25.0 | (26.0,18.2,16.8) | 15.8 | 9.7 | 16.7 | 9.4 | Kawasaki syndrome | |
| 8 | 2.1 | M | 143 | 16.3 | (22.0,15.4,16.8) | 27.2 | 6.1 | 27.2 | 6.2 | Shone’s syndrome status post coarctation repair as infant | |
| 9* | 3.7 | M | 105 | 14.4 | (22.0,15.4,16.8) | 18.3 | 8.4 | 18.3 | 9.4 | Y | L-TGA, VSD, pulmonary stenosis, post Glenn and PAB |
| 10* | 4.1 | M | 91 | 15.7 | (26.0,18.2,16.8) | 17.4 | 9.5 | 17.3 | 9.7 | Diffuse aortopathy, supravalvar aortic stenosis and hypoplasia of the aortic arch; post-repair | |
| 11 | 5.0 | F | 86 | 17.5 | (26.0,18.2,16.8) | 15.4 | 10.1 | 15.4 | 10.6 | Dilated aorta seen on echo; possible acute aortic dissection. | |
| 12 | 1.8 | F | 109 | 9.9 | (22.0,15.4,14.4) | 19.9 | 7.8 | 20.8 | 10.0 | L-TGA; post PAB | |
| 13 | 0.7 | F | 126 | 8.3 | (20.0,14.0,12.0) | 27.0 | 5.8 | 27.5 | 8.4 | Y | CCTGA and dextrocardia; post PAB |
| 14 | 5.5 | F | 95 | 16.8 | (26.0,18.2,16.8) | 17.0 | 9.1 | 18.1 | 9.6 | ToF, post-repair; severe PR w/RV dilation. | |
| 15 | 9.6 | F | 98 | 28.7 | (26.0,18.2,16.8) | 20.2 | 7.4 | 20.1 | 8.9 | ToF, post-repair, asymmetric lung perfusion (note: no GA) | |
| 16 | 8.4 | M | 66 | 35.3 | (28.0,19.6,19.2) | 13.5 | 11.2 | 16.6 | 10.9 | CCTGA; post PAB | |
| 17* | 5.6 | F | 78 | 16.3 | (24.0,16.8,16.8) | 16.2 | 10.9 | 16.6 | 11.1 | Genetic vasculopathy (ACTA-2 mutation), post-repair | |
| 18 | 3.8 | M | 83 | 14.8 | (24.0,16.8,16.8) | 17.1 | 9.0 | 17.1 | 10.1 | Coarctation; assess LSCA. | |
| 19* | 0.0 | M | 136 | 3.0 | (24.0,16.8,16.8) | 17.5 | 8.2 | 17.5 | 9.7 | Y | Treacher-Collins with heterotaxia |
| 20* | 4.0 | F | 89 | 16.0 | (24.0,16.8,16.8) | 18.5 | 8.5 | 18.5 | 9.4 | Y | Hypoplastic RV (note: small ASD) |
| 21 | 8.0 | M | 74 | 34.2 | (30.0,21.0,16.8) | 15.0 | 10.0 | 15.0 | 10.9 | Bicuspid aortic valve | |
| 22 | 8.3 | M | 85 | 25.2 | (22.0,15.4,16.8) | 16.7 | 8.6 | 17.7 | 9.6 | ToF, post-repair | |
| 23 | 6.8 | M | 67 | 22.3 | (26.0,18.2,16.8) | 14.9 | 10.9 | 17.5 | 11.0 | Myxoma | |
Underline indicates subjects excluded from flow analysis due to flow dephasing or shunt with no equivalent flow circuit; asterisk indicates subjects with no bSSFP comparison.
HR = heart rate.
Acronyms used: ASD = atrial septal defect; CCTGA = congenitally corrected transposition of the great arteries; LSCA = left subclavian artery; L-TGA = L-transposition of the great arteries; PA = pulmonary artery; PAB = pulmonary artery banding; ToF = Tetralogy of Fallot; VSD = ventricular septal defect.
Table E2.
Scoring criteria for image assessment.
| Score | Overall image quality | Motion ghosts | Hepatic vessels | Aortic & Tricuspid valves | Coronary arteries |
|---|---|---|---|---|---|
| 5 (excellent) | Sharp delineation of all structures with high SNR and no motion artifacts | No detectable ghosts | Branches visualized to within 1 cm of periphery | Sharp on all phases | Both seen to one half of the distance |
| 4 (good) | All structures can be assessed | Minimally detectable ghosts | Sharp second order branches | Sharp on some phases | One seen to one half of the distance |
| 3 (diagnostic) | All but 1–2 structures can be assessed | Coherent ghosting limiting assessment of 1–2 structures | Sharp first order branches | Blurred on all phases | Both origin seen |
| 2 (limited) | Limited assessment of several structures | Coherent ghosting limiting assessment of several structures | First order branches blurred | Partially seen | One origin seen |
| 1 (nondiagnostic) | Nondiagnostic assessment of all structures | Coherent ghosts limiting assessment of most structures | Main vessels blurred | Not seen | Not seen |
Table E3.
Inter-observer agreement results using weighted kappa coefficient between reader 1 and 2.
| A | B | C | D | C vs. D | |
|---|---|---|---|---|---|
| Overall | Substantial (0.69) | Substantial (0.66) | Substantial (0.71) | Almost perfect (0.87) | Almost perfect (0.91) |
| Motion ghosts | Substantial (0.63) | Substantial (0.61) | Substantial (0.68) | Substantial (0.64) | Substantial (0.78) |
| Hepatic vessels | Moderate (0.49) | Moderate (0.58) | Substantial (0.68) | Substantial (0.71) | Moderate (0.6) |
| Aortic valve | Substantial (0.79) | Substantial (0.70) | Substantial (0.75) | Substantial (0.76) | Substantial (0.66) |
| Tricuspid valve | Substantial (0.78) | Almost perfect (0.82) | Substantial (0.73) | Substantial (0.79) | Moderate (0.46) |
| Coronary | Almost perfect (0.81) | Almost perfect (0.84) | Almost perfect (0.88) | Almost perfect (0.90) | Substantial (0.65) |
A = spatial Wavelets with VDPoisson; B = temporal total variation and spatial Wavelet with VDPoisson; C = temporal total variation and spatial Wavelet with VDRad; D = soft-gating, temporal total variation, and spatial Wavelet with VDRad.
Footnotes
Berkeley Advanced Reconstruction Toolbox (BART) version 0.2.04, doi:10.5281/zenodo.12495
References
- 1.Serafini G, Zadra N. Anaesthesia for MRI in the paediatric patient. Current opinion in anaesthesiology. 2008;21:499–503. doi: 10.1097/ACO.0b013e328304115b. [DOI] [PubMed] [Google Scholar]
- 2.Buonocore MH, Bogren HG. Analysis of flow patterns using MRI. International Journal of Cardiac Imaging. 1999;15:99–103. doi: 10.1023/a:1006205206534. [DOI] [PubMed] [Google Scholar]
- 3.Markl M, Chan FP, Alley MT, et al. Time-resolved three-dimensional phase-contrast MRI. J Magn Reson Imaging. 2003;17:499–506. doi: 10.1002/jmri.10272. [DOI] [PubMed] [Google Scholar]
- 4.Hsiao A, Lustig M, Alley MT, et al. Rapid pediatric cardiac assessment of flow and ventricular volume with compressed sensing parallel imaging volumetric cine phase-contrast MRI. AJR Am J Roentgenol. 2012;198:W250–259. doi: 10.2214/AJR.11.6969. [DOI] [PMC free article] [PubMed] [Google Scholar]
- 5.Nordmeyer S, Riesenkampff E, Crelier G, et al. Flow-sensitive four-dimensional cine magnetic resonance imaging for offline blood flow quantification in multiple vessels: a validation study. J Magn Reson Imaging. 2010;32:677–683. doi: 10.1002/jmri.22280. [DOI] [PubMed] [Google Scholar]
- 6.Frydrychowicz A, Wieben O, Niespodzany E, Reeder SB, Johnson KM, François CJ. Quantification of thoracic blood flow using volumetric magnetic resonance imaging with radial velocity encoding: in vivo validation. Invest Radiol. 2013;48:819–825. doi: 10.1097/RLI.0b013e31829a4f2f. [DOI] [PMC free article] [PubMed] [Google Scholar]
- 7.Westenberg JJM, Danilouchkine MG, Doornbos J, et al. Accurate and reproducible mitral valvular blood flow measurement with three-directional velocity-encoded magnetic resonance imaging. Journal of Cardiovascular Magnetic Resonance. 2004;6:767–776. doi: 10.1081/jcmr-200036108. [DOI] [PubMed] [Google Scholar]
- 8.Hsiao A, Lustig M, Alley MT, Murphy MJ, Vasanawala SS. Evaluation of valvular insufficiency and shunts with parallel-imaging compressed-sensing 4D phase-contrast MR imaging with stereoscopic 3D velocity-fusion volume-rendered visualization. Radiology. 2012;265:87–95. doi: 10.1148/radiol.12120055. [DOI] [PMC free article] [PubMed] [Google Scholar]
- 9.Markl M, Harloff A, Bley TA, et al. Time-resolved 3D MR velocity mapping at 3T: improved navigator-gated assessment of vascular anatomy and blood flow. J Magn Reson Imaging. 2007;25:824–831. doi: 10.1002/jmri.20871. [DOI] [PubMed] [Google Scholar]
- 10.Han F, Rapacchi S, Khan S, et al. Four-dimensional, multiphase, steady-state imaging with contrast enhancement (MUSIC) in the heart: A feasibility study in children. Magn Reson Med. 2014 doi: 10.1002/mrm.25491. in press. [DOI] [PubMed] [Google Scholar]
- 11.Ehman RL, McNamara MT, Pallack M, Hricak H, Higgins CB. Magnetic resonance imaging with respiratory gating: techniques and advantages. AJR Am J Roentgenol. 1984;143:1175–1182. doi: 10.2214/ajr.143.6.1175. [DOI] [PubMed] [Google Scholar]
- 12.Vasanawala SS, Alley MT, Hargreaves BA, Barth RA, Pauly JM, Lustig M. Improved pediatric MR imaging with compressed sensing. Radiology. 2010;256:607–616. doi: 10.1148/radiol.10091218. [DOI] [PMC free article] [PubMed] [Google Scholar]
- 13.Lustig M, Donoho D, Pauly JM. Sparse MRI: The application of compressed sensing for rapid MR imaging. Magn Reson Med. 2007;58:1182–1195. doi: 10.1002/mrm.21391. [DOI] [PubMed] [Google Scholar]
- 14.Winkelmann S, Schaeffter T, Koehler T, Eggers H, Doessel O. An optimal radial profile order based on the Golden Ratio for time-resolved MRI. IEEE Trans Med Imaging. 2007;26:68–76. doi: 10.1109/TMI.2006.885337. [DOI] [PubMed] [Google Scholar]
- 15.Zhang T, Cheng JY, Potnick AG, et al. Fast pediatric 3D free-breathing abdominal dynamic contrast enhanced MRI with high spatiotemporal resolution. J Magn Reson Imaging. 2015;41:460–473. doi: 10.1002/jmri.24551. [DOI] [PMC free article] [PubMed] [Google Scholar]
- 16.Cheng JY, Zhang T, Ruangwattanapaisarn N, et al. Free-breathing pediatric MRI with nonrigid motion correction and acceleration. Journal of Magnetic Resonance Imaging. 2015;42:407–420. doi: 10.1002/jmri.24785. [DOI] [PMC free article] [PubMed] [Google Scholar]
- 17.Cheng JY, Alley MT, Cunningham CH, Vasanawala SS, Pauly JM, Lustig M. Nonrigid motion correction in 3D using autofocusing with localized linear translations. Magn Reson Med. 2012;68:1785–1797. doi: 10.1002/mrm.24189. [DOI] [PMC free article] [PubMed] [Google Scholar]
- 18.Bernstein MA, Shimakawa A, Pelc NJ. Minimizing TE in moment-nulled or flow-encoded two- and three-dimensional gradient-echo imaging. J Magn Reson Imaging. 1992;2:583–588. doi: 10.1002/jmri.1880020517. [DOI] [PubMed] [Google Scholar]
- 19.Feng L, Srichai MB, Lim RP, et al. Highly accelerated real-time cardiac cine MRI using k - t SPARSE-SENSE. Magnetic Resonance in Medicine. 2013;70:64–74. doi: 10.1002/mrm.24440. [DOI] [PMC free article] [PubMed] [Google Scholar]
- 20.Uecker M, Lai P, Murphy MJ, et al. ESPIRiT-an eigenvalue approach to autocalibrating parallel MRI: Where SENSE meets GRAPPA. Magn Reson Med. 2014;71:990–1001. doi: 10.1002/mrm.24751. [DOI] [PMC free article] [PubMed] [Google Scholar]
- 21.Johnson KM, Block WF, Reeder SB, Samsonov A. Improved least squares MR image reconstruction using estimates of k-space data consistency. Magn Reson Med. 2012;67:1600–1608. doi: 10.1002/mrm.23144. [DOI] [PMC free article] [PubMed] [Google Scholar]
- 22.Uecker M, Ong F, Tamir JI, et al. Berkeley Advanced Reconstruction Toolbox. Proceedings of the 23rd Annual Meeting of ISMRM; Toronto, Ontario, Canada. 2015. (abstract 2486) [Google Scholar]
- 23.Zhang T, Pauly JM, Vasanawala SS, Lustig M. Coil compression for accelerated imaging with Cartesian sampling. Magn Reson Med. 2013;69:571–582. doi: 10.1002/mrm.24267. [DOI] [PMC free article] [PubMed] [Google Scholar]
- 24.Bernstein MA, Zhou XJ, Polzin JA, et al. Concomitant gradient terms in phase contrast MR: analysis and correction. Magn Reson Med. 1998;39:300–308. doi: 10.1002/mrm.1910390218. [DOI] [PubMed] [Google Scholar]
- 25.Markl M, Bammer R, Alley MT, et al. Generalized reconstruction of phase contrast MRI: analysis and correction of the effect of gradient field distortions. Magn Reson Med. 2003;50:791–801. doi: 10.1002/mrm.10582. [DOI] [PubMed] [Google Scholar]
- 26.Prince MR, Zhang HL, Chabra SG, Jacobs P, Wang Y. A pilot investigation of new superparamagnetic iron oxide (ferumoxytol) as a contrast agent for cardiovascular MRI. Journal of X-ray science and technology. 2003;11:231–240. [PubMed] [Google Scholar]
- 27.McCullough BJ, Kolokythas O, Maki JH, Green DE. Ferumoxytol in clinical practice: implications for MRI. J Magn Reson Imaging. 2013;37:1476–1479. doi: 10.1002/jmri.23879. [DOI] [PubMed] [Google Scholar]
- 28.Tariq U, Hsiao A, Alley M, Zhang T, Lustig M, Vasanawala SS. Venous and arterial flow quantification are equally accurate and precise with parallel imaging compressed sensing 4D phase contrast MRI. J Magn Reson Imaging. 2013;37:1419–1426. doi: 10.1002/jmri.23936. [DOI] [PMC free article] [PubMed] [Google Scholar]
- 29.McGee KP, Manduca A, Felmlee JP, Riederer SJ, Ehman RL. Image metric-based correction (autocorrection) of motion effects: analysis of image metrics. Magn Reson Imaging. 2000;11:174–181. doi: 10.1002/(sici)1522-2586(200002)11:2<174::aid-jmri15>3.0.co;2-3. [DOI] [PubMed] [Google Scholar]
- 30.R Core Team. R: A Language and Environment for Statistical Computing. R Foundation for Statistical Computing; Vienna Austria: 2013. 0. [Google Scholar]
- 31.Xue H, Inati S, Sørensen TS, Kellman P, Hansen MS. Distributed MRI reconstruction using Gadgetron-based cloud computing. Magn Reson Med. 2015;73:1015–1025. doi: 10.1002/mrm.25213. [DOI] [PMC free article] [PubMed] [Google Scholar]
- 32.Gu T, Korosec FR, Block WF, et al. PC VIPR: A high-speed 3D phase-contrast method for flow quantification and high-resolution angiography. American Journal of Neuroradiology. 2005;26:743–749. [PMC free article] [PubMed] [Google Scholar]
- 33.Sigfridsson A, Petersson S, Carlhäll C-J, Ebbers T. Four-dimensional flow MRI using spiral acquisition. Magn Reson Med. 2012;68:1065–1073. doi: 10.1002/mrm.23297. [DOI] [PubMed] [Google Scholar]
- 34.Basha TA, Akçakaya M, Goddu B, Berg S, Nezafat R. Accelerated three-dimensional cine phase contrast imaging using randomly undersampled echo planar imaging with compressed sensing reconstruction. NMR in biomedicine. 2014;28:30–39. doi: 10.1002/nbm.3225. [DOI] [PubMed] [Google Scholar]
- 35.Uribe S, Beerbaum P, Sørensen TS, Rasmusson A, Razavi R, Schaeffter T. Four-dimensional (4D) flow of the whole heart and great vessels using real-time respiratory self-gating. Magn Reson Med. 2009;62:984–992. doi: 10.1002/mrm.22090. [DOI] [PubMed] [Google Scholar]
- 36.Akçakaya M, Gulaka P, Basha TA, Ngo LH, Manning WJ, Nezafat R. Free-breathing phase contrast MRI with near 100% respiratory navigator efficiency using k-space-dependent respiratory gating. Magn Reson Med. 2014;71:2172–2179. doi: 10.1002/mrm.24874. [DOI] [PMC free article] [PubMed] [Google Scholar]
- 37.U.S. Food and Drug Administration. Feraheme (ferumoxytol): Drug Safety Communication – Warnings Strengthened and Prescribing Instructions Changed. 2015 Mar 30; Retrieved from http://www.fda.gov/Safety/MedWatch/SafetyInformation/SafetyAlertsforHumanMedicalProducts/ucm440479.htm.
- 38.Yilmaz A, Dengler MA, Van Der Kuip H, et al. Imaging of myocardial infarction using ultrasmall superparamagnetic iron oxide nanoparticles: A human study using a multi-parametric cardiovascular magnetic resonance imaging approach. European Heart Journal. 2013;34:462–475. doi: 10.1093/eurheartj/ehs366. [DOI] [PubMed] [Google Scholar]