Abstract
Although sorafenib is expected to have a chemopreventive effect on hepatocellular carcinoma (HCC) recurrence, there are limitations to its use because of adverse effects, including effects on liver function. We have reported that the iron chelator, deferoxamine can prevent liver fibrosis and preneoplastic lesions. We investigated the influence of administering a new oral iron chelator, deferasirox (DFX), on the effects of sorafenib. We used the choline-deficient l-amino acid-defined (CDAA) diet-induced rat liver fibrosis and HCC model. We divided rats into four groups: CDAA diet only (control group), CDAA diet with sorafenib (sorafenib group), CDAA diet with DFX (DFX group), and CDAA diet with DFX and sorafenib (DFX + sorafenib group). Liver fibrosis and development of preneoplastic lesions were assessed. In addition, we assessed adverse effects such as changes in body and liver weight, skin damage (eruption, dryness, and hair loss), which is defined as hand-foot skin syndrome, in the sorafenib and DFX + sorafenib groups. The combination of DFX + sorafenib markedly prevented liver fibrosis and preneoplastic lesions better than the other treatments. Furthermore, the combination therapy significantly decreased adverse effects compared with the sorafenib group. In conclusion, the combination therapy with DFX and sorafenib may be a useful adjuvant therapy to prevent recurrence after curative treatment of HCC.
Keywords: hand-foot skin syndrome, liver cancer, liver fibrosis, deferasirox, sorafenib
Introduction
Hepatocellular carcinoma (HCC) is the fifth most common cancer and the second leading cause of cancer-related deaths worldwide.(1) The most common problem associated with HCC is the high risk of intrahepatic recurrence despite radical treatment. HCC has an annual recurrence rate of approximately 15–20%, with the 5-year recurrence rate reaching 80–90%.(2) For HCC patients with hepatitis B virus or hepatitis C virus, antiviral therapies such as nucleoside analogs and interferon after curative treatment of HCC have potential to reduce HCC recurrence.(3,4)
In recent years, the HCC type categorized as negative for hepatitis B surface antigen and antibody to hepatitis C virus (NBNC-HCC) has gradually been increasing in Japan.(5) As antiviral therapies are not indicated for NBNC-HCC patients, other therapies are required for chemoprevention of HCC recurrence. The multikinase inhibitor sorafenib may prevent HCC recurrence.(2,6) However, sorafenib has limitations because it is generally used to treat patients with preserved liver function (Child-Pugh A) and has several adverse effects, such as hand-foot skin syndrome (HFS).
Iron is essential for cellular metabolism, including DNA synthesis.(7) It is also required for the proliferation of cancer cells before initiation of DNA synthesis.(8) Iron chelators, which are commonly used for treating iron overload disease, have shown antiproliferative effects in both in vitro and in vivo studies of HCC.(9,10) We performed a pilot study of deferoxamine (DFO) therapy in advanced HCC patients for the first time, and reported the efficacy of this iron chelator.(11) We have also reported that DFO can prevent both liver fibrosis and development of preneoplastic lesions in rats.(12–14) However, DFO cannot be administered orally, thus limiting its clinical application.
Recently, deferasirox (DFX), a newly developed oral iron chelator, was shown to have a powerful antiproliferative effect in human hepatoma cell culture.(15) However, there have been few in vivo studies of DFX on hepatocarcinogenesis.(16) We conducted an in vivo study to assess whether DFX can prevent liver fibrosis and hepatocarcinogenesis as well as DFO can. In addition, we compared the effects of the combination of DFX and sorafenib with those of sorafenib alone.
Material and Methods
Animals
Animal care was performed in accordance with the animal ethics requirements at Yamaguchi University School of Medicine, and the experimental protocol was approved (approval ID 10-074). Six-week-old male Wister rats (140–160 g) were purchased from Nippon SLC (Shizuoka, Japan) and housed in a room under controlled temperature (25°C) and lighting (12-h light, 12-h dark) at the Animal Experiment Facility of Yamaguchi University School of Medicine. The rats were fed a choline-deficient l-amino acid-defined (CDAA) diet in powdered form (Dyets Inc.; Bethlehem, PA; product numbers 518753 and 518754).
Experimental protocol
The total study periods were either 16 or 20 weeks except for the study of survival. The rats were divided into four groups (n = 10 per group): CDAA diet only (control group), CDAA diet with DFX (DFX group), CDAA diet with sorafenib (sorafenib group), and CDAA diet with DFX and sorafenib (DFX + sorafenib group). DFX at 20 mg/kg per day and/or sorafenib at 16 mg/kg per day were administered orally for 16 or 20 weeks from commencement of the CDAA diet. To equalize the total food intakes in all groups, additional food was not supplied until all food had been consumed. Food intakes were measured in each group.
Serum marker measurement
Serum samples were obtained from the abdominal aorta as the rats were killed. In all experiments, serum total protein, total bilirubin, albumin, alanine aminotransferase, and aspartate aminotransferase (AST) were measured using an analyzer for clinical chemistry (SPOTCHEM EZ SP-4430; Arkray, Kyoto, Japan).
Histology and immunohistochemical examination
Sections (3 mm thick) of the right lobe of whole rat liver were fixed in 4% paraformaldehyde (Muto; Tokyo, Japan) for 24 h and embedded in paraffin. The sections were processed for Sirius Red staining, and α-smooth muscle actin (α-SMA) (for the detection of activated stellate cells), and lesions for glutathione S-transferase placental form (GST-P) (as preneoplastic lesions) were assessed immunohistochemically using the avidin–biotin–peroxidase complex method, as described previously.(17)
Briefly, 3-µm-thick tissue sections were deparaffinized in xylene and rehydrated serially with alcohol and water. Endogenous peroxidase was blocked with fresh 0.3% hydrogen peroxide in methanol for 30 min at room temperature, followed by microwave antigen retrieval for 6 min at 95°C in 10 mM sodium citrate buffer (pH 6.0). Normal goat serum (Vector Laboratories; Burlingame, CA) was applied for 20 min and removed. Sections were incubated with rabbit anti-GST-P monoclonal antibody (Code No. 311 Medical & Biological Laboratories; Nagoya, Japan) and rabbit anti-α-SMA (ab5694; Abcam; Cambridge, MA) polyclonal antibody at a dilution of 1:200 overnight at 4°C in a moist chamber. After being washed three times in phosphate-buffered saline (PBS), sections were incubated with biotinylated secondary antibody for 1 h at room temperature. Bound antibody was detected using the avidin–biotin complex immunoperoxidase method (Vector Laboratories).
Sirius Red staining-positive, α-SMA-positive, and GST-P-positive areas in the liver were quantified using a Keyence BIOREVO BZ9000 microscope (Osaka, Japan) and Provis microscope (Olympus; Tokyo, Japan) equipped with a charge-coupled device (CCD) camera. We used computer-assisted image analysis with MetaMorph software (Universal Imaging Corporation; Downingtown, PA). The Sirius Red staining-positive area and α-SMA-positive area were expressed as the percentage of the total area of the specimen. The size and numbers of GST-P-positive lesions were counted in each specimen using a Keyence BIOREVO BZ9000 microscope.
Real-time quantitative polymerase chain reaction (PCR)
Expression of type I procollagen, tumor growth factor beta1 (TGF-β1), α-SMA, tissue inhibitor of metalloproteinase 1 (TIMP-1), tissue inhibitor of metalloproteinase-2 (TIMP-2), and tumor necrosis factor alpha (TNFα) mRNA was evaluated by real-time PCR as described previously.(17) Briefly, RNA extraction was performed according to a protocol using an RNeasy Mini kit (Qiagen GmbH; Hilden, Germany). The primers used were as follows: Rat type 1 procollagen primers: sense (5'-AGCGGTGAAGAAGGAAAGAGAGG-3'), antisense (5'-CAATAGGACCAGAAGGACCAGCA-3'); Rat TIMP-1 primers: sense (5'-ACAGGTTTCCGGTTCGCCTAC-3'), antisense (5'-CTGCAGGCAGTGATGTGCAA-3'); Rat TIMP-2 primers: sense (5'-GACACGCTTAGCTCACCCAGA-3'), antisense (5'-CTGTGACCCAGTCCATCCAGAG-3'); Rat TNF-α primers: sense (5'-TCCGTCCCTCTCATACACTGG-3'), antisense (5'-GAGCCCATTTGGGAACTTCT-3'); Rat TGF-β1 primers: sense (5'-TGCGCCTGCAGAGATTCAAG-3'), antisense (5'-AGGTAACGCCAGGAATTGTTGCT-3'); Rat GAP-DH primers: sense (5'-GGCAAGTTCAACGGCACAGTC-3'), antisense (5'-AGCACCAGCATCACCCCATTT-3').
8-Hydroxy-2-deoxyguanosine (8-OHdG) enzyme-linked immunosorbent assay (ELISA)
A DNA extractor TIS kit (Wako, Saitama, Japan), which is able to inhibit the oxidation of DNA, was used to extract DNA from 200 mg deep-frozen rat liver per sample. The 8-OHdG assay was prepared to reduce the variation of the enzyme reaction by using each reagent in the sample DNA and this assay was used stable results for the marker of oxidative stress. The 8-OHdG levels in the liver were analyzed by the 8-OHdG ELISA assay kit (Japan Institute for the Control of Aging; Shizuoka, Japan).
Adverse events and survival
We analyzed adverse events and survival in four groups: control group, DFX group, sorafenib group, and DFX + sorafenib group (n = 16 per group). The rats were fed a CDAA diet and the same dose of DFX and/or sorafenib was administered over approximately 1 year from commencement of the CDAA diet. Sorafenib has several adverse effects, with HFS being the most common. We defined skin damage including eruption, dryness, and hair loss as HFS in rats.(18) We analyzed adverse effects such as changes in body and liver weight, and HFS in each treatment group at 16 weeks after commencement of the CDAA diet. We used the Kaplan–Meier estimator of survival, and verified the survival function against lifetime data.
Statistical analysis
Statistical significance was determined using the Student’s t test or analysis of variance (ANOVA) for biochemical and histological results, and the log-rank test for the survival analysis. Results are expressed as the mean ± SD, and differences with p<0.05 were considered significant.
Results
Histological and immunohistochemical analysis of liver fibrosis
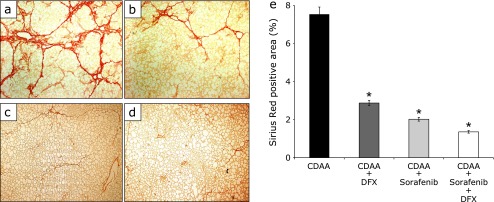
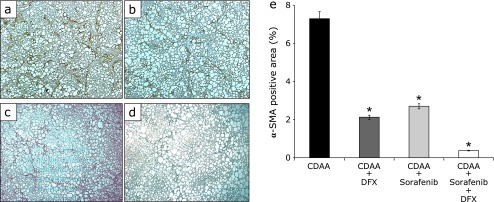
After 16 weeks, the histological and immunohistochemical examination of the liver showed the presence of liver fibrosis in all groups (Fig. 1a–d and 2a–d). Liver fibrosis was measured by estimating extracellular matrix deposition with Sirius Red staining. In the three groups administered DFX and/or sorafenib, the positive area of Sirius Red staining was significantly lower compared with the control group (Fig. 1a–e, p<0.01; each group vs control group). The combination therapy of DFX + sorafenib more strongly inhibited liver fibrosis compared with the other groups (Fig. 1e). The α-SMA stain showed marked proliferation of active stellate cells in the livers of rats fed a CDAA diet (Fig. 2a–d). The three treatment groups showed significantly decreased α-SMA-positive areas compared with the control group (Fig. 2a–e, p<0.01; each group vs control group), and the combination therapy most strongly inhibited activated stellate cells. In the histological and immunohistochemical analysis of fibrosis at 20 weeks after commencement of the CDAA diet, similar findings were obtained (data not shown).
Fig. 1.
Histological analysis of liver fibrosis. Paraffin-embedded liver sections from rats with Sirius Red staining (original magnification 40×). Choline-deficient l-amino acid (CDAA)-only treatment rat group (a), CDAA + 20 mg/kg deferasirox per day treatment rat group (b), CDAA + 16 mg/kg sorafenib per day treatment rat group (c), CDAA + 20 mg/kg deferasirox + 16 mg/kg sorafenib per day treatment rat group (d). Image analysis of Sirius Red-positive areas (e). Data are shown as means ± SD. *p<0.01 vs CDAA-only group.
Fig. 2.
Immunohistochemistry of alpha-smooth muscle actin (α-SMA) expression in liver fibrosis. Paraffin-embedded liver sections were immunostaining for α-SMA (original magnification 40×). Choline-deficient l-amino acid (CDAA)-only treatment rat group (a), CDAA + 20 mg/kg deferasirox per day treatment rat group (b), CDAA + 16 mg/kg sorafenib per day treatment rat group (c), CDAA + 20 mg/kg deferasirox + 16 mg/kg sorafenib per day treatment rat group (d). Image analysis of α-SMA-positive areas (e). Data are shown as means ± SD. *p<0.01 vs CDAA-only group.
Serum biochemical markers of liver function. Table 1 shows the levels of serum biochemical markers of liver function after 16 weeks. The DFX group and the DFX + sorafenib group had significantly higher levels of serum total protein and albumin than the control group (p<0.01, each group vs control group). In addition, the DFX + sorafenib group had significantly lower serum AST levels than the control group (p<0.05). These results indicate that DFX improved liver function in rats fed CDAA despite the administration of sorafenib.
Table 1.
Comparison of serum data in the four groups at 16 weeks
| T protein (g/dl) | Albumin (g/dl) | T-bil (mg/dl) | AST (IU/L) | ALT (IU/L) | |
|---|---|---|---|---|---|
| CDAAa | 4.7 ± 0.02 | 2.6 ± 0.4 | 1.4 ± 0.2 | 546.0 ± 88.0 | 376.2 ± 18.2 |
| CDAA + Sorafenibb | 5.6 ± 0.1 | 3.4 ± 0.2** | 0.8 ± 0.4 | 480.2 ± 30.4 | 300.2 ± 50.8 |
| CDAA + Deferasiloxc | 5.9 ± 0.2** | 3.9 ± 0.1** | 0.9 ± 0.1 | 381.0 ± 56.0 | 315.1 ± 19.1 |
| CDAA + Sorafenib + Deferasiloxd | 6.1 ± 0.2** | 4.0 ± 0.3** | 0.5 ± 0.3** | 360.4 ± 15.2* | 304.1 ± 35.2 |
aCDAA-only treatment rat group; bCDAA + 20 mg/kg deferasirox per day treatment group; cCDAA + 16 mg/kg sorafenib per day treatment rat group; dCDAA + 20 mg/kg deferasirox + 16 mg/kg sorafenib per day treatment rat group. Abbreviations: CDAA, choline-deficient l-amino acid-defined; T protein, total protein; T-bil, total bilirubin; AST, aspartate aminotransferase; ALT, alanine aminotransferase. Data are means ± SD. *p<0.05 vs CDAA only. **p<0.01 vs CDAA only.
Gene expression effect of liver fibrosis
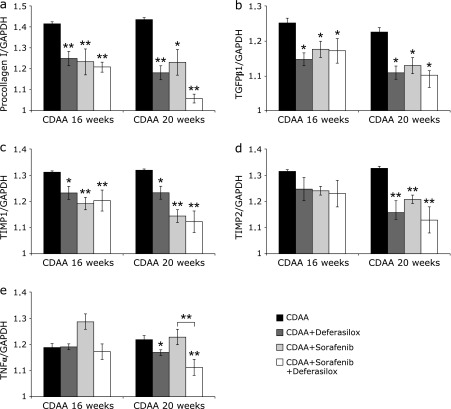
We analyzed the mRNA expression of type I procollagen, TGF-β1, TIMP-1, TIMP-2, and TNF-α in the liver after 16 and 20 weeks. Type I procollagen, TGF-β1, and TIMP-1 mRNA expression levels were significantly lower in groups treated with DFX and/or sorafenib compared with the control group at both time points (Fig. 3a–c). TIMP-2 mRNA expression was significantly lower compared with the control group at 20 weeks (Fig. 3d). Compared with the individual treatments, the combination therapy of DFX + sorafenib showed a more potent inhibitory effect on the expression of type I procollagen, TGF-β1, TIMP-1, and TIMP-2 mRNA, but the difference was not significant.
Fig. 3.
Real-time quantitative PCR analysis of type I procollagen (a), tumor growth factor beta (TGF-β1) (b), tissue inhibitor of metalloproteinase 1 (TIMP-1), (c) TIMP-2 (d), and tumor necrosis factor alpha (TNF-α) (e) in the liver. Data are means ± SD. *p<0.05 vs choline-deficient l-amino acid (CDAA)-only group. **p<0.01 vs CDAA-only group.
TNF-α mRNA expression was not significantly lower in the sorafenib group. DFX inhibited TNF-α mRNA expression compared with the control group (p<0.05) (Fig. 3e). There was a significant difference between the sorafenib group and the DFX + sorafenib group; DFX + sorafenib significantly inhibited TNF-α mRNA expression compared with the control group and the sorafenib group (p<0.01) (Fig. 3e).
Expression of preneoplastic liver lesions and oxidative stress
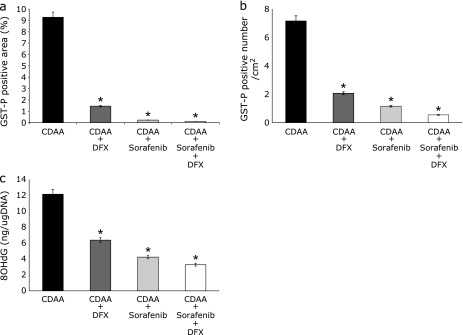
Preneoplastic liver lesions were caused by the CDAA diet. Upon immunohistological staining, GST-P-positive areas (markers for preneoplastic lesions in rats) were scattered in the control group but were significantly less common in the DFX, sorafenib, and DFX + sorafenib groups at 16 weeks after commencement of the CDAA diet. The total focal area (p<0.01) and the number of foci (p<0.01) were significantly lower compared with the control group (Fig. 4a and b). In particular, the combination therapy exerted a stronger inhibitory effect compared with a single agent. In the quantitative analysis of 8-OHdG, which is one of the most abundant products of DNA oxidation, the result of 8-OHdG was similar to the result of the preneoplastic lesions; the combination therapy of DFX + sorafenib exerted a stronger inhibitory effect than either single agent (Fig. 4c). In the expression of preneoplastic liver lesions and oxidative stress at 20 weeks after commencement of the CDAA diet, similar findings were obtained (data not shown).
Fig. 4.
Glutathione S-transferase placental form (GST-P)-positive nodules in livers from rats in the four treatment groups after 16 weeks. (a, b) Image analysis of GST-P-positive areas (a) and numbers (b). Columns represent number per square centimeter of GST-P-positive nodules. (c) Average 8-hydroxy-2'-deoxyguanosine (8OHdG) content (nanograms) in DNA isolated from the liver. Data are shown as means ± SD. *p<0.01 vs choline-deficient l-amino acid (CDAA)-only group.
Adverse effects of each treatment
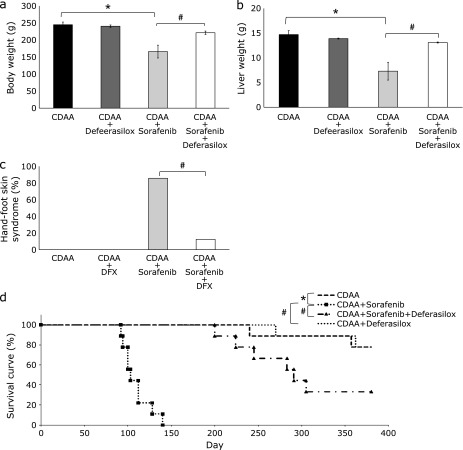
The body weight (Fig. 5a) and liver weight (Fig. 5b) in the sorafenib group were significantly lower compared with the control group (p<0.01). However, there were no significant differences in both weights between the DFX group and the control group. Interestingly, the body weight and liver weight of rats that received the combination therapy of DFX + sorafenib were higher; there were no significant differences between the DFX + sorafenib group and the control group. The rats treated with sorafenib also showed severe HFS, but the rats treated with DFX + sorafenib were normal. There was no HFS in the control group and DFX groups. The incidence of HFS was 12/14 in the sorafenib group, but was only 2/16 in the DFX + sorafenib group (Fig. 5c).
Fig. 5.
Analysis of average weight of rats from each treatment group (a) and liver weight of rats from each treatment group (b). Data are shown as means ± SD. *p<0.01 vs choline-deficient l-amino acid (CDAA)-only group. The analysis of the ratio of hand-foot skin syndrome (HFS) in rats from the four treatment groups (c). #p<0.01 vs CDAA + sorafenib treatment group. The Kaplan–Meier survival curves for the four groups (d).
Survival time in the sorafenib group was significantly shorter than that in the control group (p<0.01), but the combination therapy of DFX + sorafenib significantly improved survival (p<0.01) (Fig. 5d).
Discussion
Hepatic iron accumulation is a frequent cause of liver damage and has been associated with the risk of developing HCC,(19,20) particularly in patients with chronic hepatitis C.(21) During iron overload, divalent iron reacts with hydrogen peroxide to generate hydroxyl radicals, the most toxic reactive oxygen species (ROS), which produce liver damage and hepatocarcinogenesis.(22) It has been reported that hepatic iron overload increases the risk of HCC development in transgenic mice expressing the hepatitis C polyprotein.(23) In a clinical study, the rate of HCC was significantly lower in patients with chronic hepatitis C who were treated with phlebotomy.(24) Therefore, iron regulation may have an important effect in HCC therapy. Iron chelators are commonly used for treating patients with iron overload disease. Although iron chelators are not classified as anticancer drugs, they nonetheless exert antiproliferative effects in several cancers, including HCC.(9,10,25,26)
The multikinase inhibitor, sorafenib is recommended as the current standard care for patients with advanced HCC.(27) One expected effect of sorafenib is chemoprevention of HCC recurrence, and a clinical trial is now ongoing (STOM trial).(5,6) However, there are limitations to the use of sorafenib because of adverse effects, including effects on liver function. Therefore, other alternative therapies are required for chemoprevention of HCC recurrence.
Given this background, in the present study, we aimed to evaluate the effects of DFX, a new oral iron chelator, on hepatocarcinogenesis and liver fibrosis. In addition, we investigated the influence of administering DFX on the effects of sorafenib.
We used a CDAA-fed rat model in our in vivo study. The CDAA diet causes ROS-related hepatocyte damage leading to hepatic fibrosis, and then results in the production of preneoplastic lesions.(12) We previously reported that DFO prevents the expression of activated hepatic stellate cells,(14) reducing liver fibrosis as well as reducing the development of preneoplastic lesions in the same CDAA-fed rat model.(12) In the present study, we showed that DFX inhibited liver fibrosis concurrently with down-regulation of collagen I, TGF-β1, TIMP-1, and TIMP-2 mRNA levels and a reduction of α-SMA-positive activated hepatic stellate cells in the liver. In addition, DFX prevented preneoplastic lesions with a reduction in 8-OHdG, an indicator of ROS-mediated DNA damage. Therefore, DFX, like DFO, may have therapeutic potential in the treatment of liver fibrosis and hepatocarcinogenesis.
On the other hand, previous studies reported that sorafenib reduces the number of hepatic stellate cells and improves liver fibrosis.(28–30) We demonstrated the same result in the CDAA-fed rat model using sorafenib. Sorafenib inhibited liver fibrosis and strong hepatocarcinogenesis through the suppression of hepatic stellate cells and ROS. However, sorafenib treatment induced significantly more adverse effects such as weight loss and HFS compared with the control and the DFX groups (Fig. 5). In addition, the sorafenib group had the lowest liver weights among the four groups. Furthermore, survival time for the sorafenib group was shorter than that of the control group (Fig. 5).
We also investigated the influence of administering DFX on the effects of sorafenib. The combination of DFX and sorafenib markedly prevented liver fibrosis and development of preneoplastic lesions with a synergistic effect. It is striking that the combination therapy produced significantly fewer adverse effects compared with the treatment of sorafenib alone (Fig. 5). To our knowledge, this is the first report to demonstrate reduced adverse effects with this combination therapy. Importantly, HFS is the most frequent adverse effect related to sorafenib in Asia,(31) and it is important to control these reactions to avoid dose reduction or treatment discontinuation. However, the pathogenesis of HFS is uncertain. It has been reported that single-nucleotide polymorphisms (SNPs) of TNF-α, vascular endothelial growth factor (VEGF), and uridine diphosphate glucuronosyltransferase 1A9 (UGT1A9) were associated with developing high-grade HFS.(31) In addition, high-grade HFS develops more frequently in patients with high serum TNF-α levels after sorafenib therapy.(32) On the other hand, it has been reported that DFO reduces serum TNF-α levels in a murine model of sepsis.(33) In our study, we showed that the DFX + sorafenib group had significantly lower TNF-α mRNA levels compared with the control group (Fig. 3e). Thus, we consider that the combination of DFX + sorafenib may prevent HFS via down-regulation of TNF-α. Some previous studies have described TNF-α as a double-edged sword that can be either pro- or anti-tumorigenic.(34) In this study, the combination of DFX + sorafenib markedly prevented preneoplastic lesions. In addition, it has been reported that either DFX or sorafenib suppresses VEGF-mediated neovascularization in the CDAA rat model.(16,35) However, further studies are needed to elucidate the exact mechanism of this phenomenon.
We demonstrated that the combination of DFX and sorafenib markedly inhibited liver fibrosis and hepatocarcinogenesis in CDAA-fed rats. This combination therapy significantly reduced the adverse effects of sorafenib therapy. As sorafenib and DFX are already clinically used in advanced HCC and in patients with iron overload disease, respectively, this combination therapy may provide a new chemopreventive strategy against HCC recurrence after curative treatment of HCC in the near future.
Acknowledgments
We thank Mrs. Mariko Yamada, Mrs. Ihoko Fuzimoto, and Mrs. Hiromi Kurose for technical assistance and support. And this study was supported by Grants-in-Aid for Scientific Research from the Japan Society for the Promotion of Science (23590978 and 24590978), the Japan Science and Technology Agency, and the Ministry of Health, Labor, and Welfare.
Abbreviations
- α-SMA
α-smooth muscle actin
- AST
aspartate aminotransferase
- CDAA
choline-deficient l-amino acid
- DFX
deferasirox
- DFO
deferoxamine
- ELISA
enzyme-linked immunosorbent assay
- GST-P
glutathione S-transferase placental form
- HFS
hand-foot skin syndrome
- HCC
hepatocellular carcinoma
- 8-OHdG
8-hydroxy-2-deoxyguanosine
- PCR
real-time quantitative polymerase chain reaction
- ROS
reactive oxygen species
- SNPs
single-nucleotide polymorphisms
- TGF-β1
tumor growth factor beta1
- TIMP-1
tissue inhibitor of metalloproteinase 1
- TIMP-2
tissue inhibitor of metalloproteinase 2
- TNFα
tumor necrosis factor alpha
- UGT1A9
uridine diphosphate glucuronosyltransferase 1A9
- VEGF
vascular endothelial growth factor
Conflicts of Interest
No potential conflicts of interest were disclosed.
References
- 1.GLOBOCAN 2012 http://globocan.iarc.fr/Default.aspx http://globocan.iarc.fr/Default.aspx
- 2.Kudo M. Adjuvant therapy after curative treatment for hepatocellular carcinoma. Oncology. 2011;81:50–55. doi: 10.1159/000333259. [DOI] [PubMed] [Google Scholar]
- 3.Tan ZM, Sun BC. Effects of antiviral therapy on preventing liver tumorigenesis and hepatocellular carcinoma recurrence. World J Gastroenterol. 2013;19:8895–8901. doi: 10.3748/wjg.v19.i47.8895. [DOI] [PMC free article] [PubMed] [Google Scholar]
- 4.Sun P, Yang X, He RQ, et al. Antiviral therapy after curative treatment of hepatitis B/C virus-related hepatocellular carcinoma: a systematic review of randomized trials. Hepatol Res. 2014;44:259–269. doi: 10.1111/hepr.12115. [DOI] [PubMed] [Google Scholar]
- 5.Nagaoki Y, Hyogo H, Aikata H, et al. Recent trend of clinical features in patients with hepatocellular carcinoma. Hepatol Res. 2012;42:368–375. doi: 10.1111/j.1872-034X.2011.00929.x. [DOI] [PubMed] [Google Scholar]
- 6.Printz C. Clinical trials of note. Sorafenib as adjuvant treatment in the prevention of disease recurrence in patients with hepatocellular carcinoma (HCC) (STORM) Cancer. 2009;115:4646. doi: 10.1002/cncr.24673. [DOI] [PubMed] [Google Scholar]
- 7.Andrews NC. Disorders of iron metabolism. N Engl J Med. 1999;341:1986–1995. doi: 10.1056/NEJM199912233412607. [DOI] [PubMed] [Google Scholar]
- 8.Brodie C, Siriwardana G, Lucas J, et al. Neuroblastoma sensitivity to growth inhibition by deferrioxamine: evidence for a block in G1 phase of the cell cycle. Cancer Res. 1993;53:3968–3975. [PubMed] [Google Scholar]
- 9.Hann HW, Stahlhut MW, Rubin R, Maddrey WC. Antitumor effect of deferoxamine on human hepatocellular carcinoma growing in athymic nude mice. Cancer. 1992;70:2051–2056. doi: 10.1002/1097-0142(19921015)70:8<2051::aid-cncr2820700806>3.0.co;2-1. [DOI] [PubMed] [Google Scholar]
- 10.Kicic A, Chua AC, Baker E. Effect of iron chelators on proliferation and iron uptake in hepatoma cells. Cancer. 2001;92:3093–3110. doi: 10.1002/1097-0142(20011215)92:12<3093::aid-cncr10107>3.0.co;2-b. [DOI] [PubMed] [Google Scholar]
- 11.Yamasaki T, Terai S, Sakaida I. Deferoxamine for advanced hepatocellular carcinoma. N Engl J Med. 2011;365:576–578. doi: 10.1056/NEJMc1105726. [DOI] [PubMed] [Google Scholar]
- 12.Sakaida I, Hironaka K, Uchida K, Okita K. Iron chelator deferoxamine reduces preneoplastic lesions in liver induced by choline-deficient l-amino acid-defined diet in rats. Dig Dis Sci. 1999;44:560–569. doi: 10.1023/a:1026661508553. [DOI] [PubMed] [Google Scholar]
- 13.Sakaida I, Kayano K, Wasaki S, Nagatomi A, Matsumura Y, Okita K. Protection against acetaminophen-induced liver injury in vivo by an iron chelator, deferoxamine. Scand J Gastroenterol. 1995;50:61–67. doi: 10.3109/00365529509093237. [DOI] [PubMed] [Google Scholar]
- 14.Jin H, Terai S, Sakaida I. The iron chelator deferoxamine causes activated hepatic stellate cells to become quiescent and to undergo apoptosis. J Gastroenterol. 2007;42:475–484. doi: 10.1007/s00535-007-2020-5. [DOI] [PubMed] [Google Scholar]
- 15.Chantrel-Groussard K, Gaboriau F, Pasdeloup N, et al. The new orally active iron chelator ICL670A exhibits a higher antiproliferative effect in human hepatocyte cultures than O-trensox. Eur J Pharmacol. 2006;541:129–137. doi: 10.1016/j.ejphar.2006.05.001. [DOI] [PubMed] [Google Scholar]
- 16.Kaji K, Yoshiji H, Kitade M, et al. Combination treatment of angiotensin II type I receptor blocker and new oral iron chelator attenuates progression of nonalcoholic steatohepatitis in rats. Am J Physiol Gastrointest Liver Physiol. 2011;300:G1094–G1104. doi: 10.1152/ajpgi.00365.2010. [DOI] [PubMed] [Google Scholar]
- 17.Saeki I, Terai S, Fujisawa K, et al. Bortezomib induces tumor-specific cell death and growth inhibition in hepatocellular carcinoma and improves liver fibrosis. J Gastroenterol. 2013;48:738–750. doi: 10.1007/s00535-012-0675-z. [DOI] [PubMed] [Google Scholar]
- 18.Yokomichi N, Nagasawa T, Coler-Reilly A, et al. Pathogenesis of Hand-Foot Syndrome induced by PEG-modified liposomal Doxorubicin. Hum Cell. 2013;26:8–18. doi: 10.1007/s13577-012-0057-0. [DOI] [PMC free article] [PubMed] [Google Scholar]
- 19.Asare GA, Mossanda KS, Kewa MC, Peterson AC, Kahler-Venter CP, Siziba K. Hepatocellular carcinoma caused by iron overload: a possible mechanism of direct hepatocarcinogenicity. Toxicology. 2006;219:41–52. doi: 10.1016/j.tox.2005.11.006. [DOI] [PubMed] [Google Scholar]
- 20.Kew MC, Asare GA. Dietary iron overload in the African and hepatocellular carcinoma. Liver Int. 2007;27:735–741. doi: 10.1111/j.1478-3231.2007.01515.x. [DOI] [PubMed] [Google Scholar]
- 21.Fujita N, Horiike S, Sugimoto R, et al. Hepatic oxidative DNA damage correlates with iron overload in chronic hepatitis C patients. Free Radic Biol Med. 2007;42:353–362. doi: 10.1016/j.freeradbiomed.2006.11.001. [DOI] [PubMed] [Google Scholar]
- 22.Takami T, Sakaida I. Iron regulation by hepatocytes and free radicals. J Clin Biochem Nutr. 2011;48:103–106. doi: 10.3164/jcbn.10-76. [DOI] [PMC free article] [PubMed] [Google Scholar]
- 23.Furutani T, Hino K, Okuda M, et al. Hepatic iron overload induces hepatocellular carcinoma in transgenic mice expressing the hepatitis C virus polyprotein. Gastroenterology. 2006;130:2087–2098. doi: 10.1053/j.gastro.2006.02.060. [DOI] [PubMed] [Google Scholar]
- 24.Kato J, Miyanishi K, Kobune M, et al. Long-term phlebotomy with low-iron diet therapy lowers risk of development of hepatocellular carcinoma from chronic hepatitis C. J Gastroenterol. 2007;42:830–836. doi: 10.1007/s00535-007-2095-z. [DOI] [PubMed] [Google Scholar]
- 25.Yu Y, Gutierrez E, Kovacevic Z, et al. Iron chelators for the treatment of cancer. Curr Med Chem. 2012;19:2689–2702. doi: 10.2174/092986712800609706. [DOI] [PubMed] [Google Scholar]
- 26.Torti SV, Torti FM. Iron and cancer: more ore to be mined. Nat Rev Cancer. 2013;13:342–355. doi: 10.1038/nrc3495. [DOI] [PMC free article] [PubMed] [Google Scholar]
- 27.Bruix J, Sherman M, ; Practice Guidelines Committee, American Association for the Study of Liver Diseases Management of hepatocellular carcinoma. Hepatology. 2005;42:1208–1236. doi: 10.1002/hep.20933. [DOI] [PubMed] [Google Scholar]
- 28.Wang Y, Gao J, Zhang D, Zhang J, Ma J, Jiang H. New insights into the antifibrotic effects of sorafenib on hepatic stellate cells and liver fibrosis. J Hepatol. 2010;53:132–144. doi: 10.1016/j.jhep.2010.02.027. [DOI] [PubMed] [Google Scholar]
- 29.Thabut D, Routray C, Lomberk G, et al. Complementary vascular and matrix regulatory pathways underlie the mechanism of action of sorafenib in liver fibrosis. Hepatology. 2011;54:573–585. doi: 10.1002/hep.24427. [DOI] [PMC free article] [PubMed] [Google Scholar]
- 30.Deng YR, Ma HD, Tsuneyama K, et al. STAT3-mediated attenuation of CCl4-induced mouse liver fibrosis by the protein kinase inhibitor sorafenib. J Autoimmun. 2013;46:25–34. doi: 10.1016/j.jaut.2013.07.008. [DOI] [PubMed] [Google Scholar]
- 31.Cheng AL, Kang YK, Chen Z, et al. Efficacy and safety of sorafenib in patients in the Asia-Pacific region with advanced hepatocellular carcinoma: a phase III randomized, double-blind, placebo-controlled trial. Lancet Oncol. 2009;10:25–34. doi: 10.1016/S1470-2045(08)70285-7. [DOI] [PubMed] [Google Scholar]
- 32.Lee JH, Chung YH, Kim JA, et al. Genetic predisposition of hand-foot skin reaction after sorafenib therapy in patients with hepatocellular carcinoma. Cancer. 2013;119:136–142. doi: 10.1002/cncr.27705. [DOI] [PubMed] [Google Scholar]
- 33.Vulcano M, Meiss RP, Isturiz MA. Deferoxamine reduces tissue injury and lethality in LPS-treated mice. Int J Immunopharmacol. 2000;22:635–644. doi: 10.1016/s0192-0561(00)00026-6. [DOI] [PubMed] [Google Scholar]
- 34.Wang X, Lin Y. Tumor necrosis factor and cancer, buddies or foes? Acta Pharmacol Sin. 2008;29:1275–1288. doi: 10.1111/j.1745-7254.2008.00889.x. [DOI] [PMC free article] [PubMed] [Google Scholar]
- 35.Yoshiji H, Noguchi R, Namisaki T, et al. Combination of sorafenib and angiotensin-II receptor blocker attenuates preneoplastic lesion development in a non-diabetic rat model of steatohepatitis. J Gastroenterol. 2014;49:1421–1429. doi: 10.1007/s00535-013-0906-y. [DOI] [PubMed] [Google Scholar]


