Abstract
Glioblastomas are the most common primary brain tumors, highly vascularized, infiltrating, and resistant to current therapies. This cancer leads to a fatal outcome in less than 18 months. The aggressive behavior of glioblastomas, including resistance to current treatments and tumor recurrence, has been attributed to glioma stemlike/progenitor cells. The transcription factor EGR1 (early growth response 1), a member of a zinc finger transcription factor family, has been described as tumor suppressor in gliomas when ectopically overexpressed. Although EGR1 expression in human glioblastomas has been associated with patient survival, its precise location in tumor territories as well as its contribution to glioblastoma progression remain elusive. In the present study, we show that EGR1-expressing cells are more frequent in high grade gliomas where the nuclear expression of EGR1 is restricted to proliferating/progenitor cells. We show in primary cultures of glioma stemlike cells that EGR1 contributes to stemness marker expression and proliferation by orchestrating a PDGFA-dependent growth-stimulatory loop. In addition, we demonstrate that EGR1 acts as a positive regulator of several important genes, including SHH, GLI1, GLI2, and PDGFA, previously linked to the maintenance and proliferation of glioma stemlike cells.
Keywords: cancer biology, cancer stem cells, cell proliferation, cell signaling, transcription factor
Introduction
Glioblastomas (GBM)4 are the most common form of primary brain tumors afflicting adult patients of all ages (1). These highly vascularized, infiltrating tumors are resistant to current therapies and most often lead to a fatal outcome in less than 18 months. The aggressive behavior of GBM, including resistance to current treatments and tumor recurrence, has been attributed, at least in part, to glioma stemlike cells (GSCs). According to the cancer stem cell hypothesis, these cells with long-term self-renewal and differentiation potential are resistant to treatment and are responsible for the initiation, growth, and heterogeneity of tumors by providing progenitors, differentiated tumor cells, and endothelial cells and pericytes (2–4). To better understand the molecular and cellular processes involved in GBM initiation and progression, we sought to identify and decipher the molecular pathways that govern GSC maintenance and proliferation. In that context, we have previously demonstrated a positive regulatory feed-forward control between ERK and NOTCH pathways, which relies on miR-18a*-mediated repression of delta-like 3 protein expression, a ligand inhibitor of NOTCH (5). In this mechanism, activated NOTCH1 is required for sustained ERK activation, which is necessary to turn on the SHH (sonic hedgehog)-GLI-NANOG signaling network, essential for the maintenance of GSC proliferation (5–7). However, other key factors, which might be ERK effectors for the regulation of this regulatory circuitry, remain to be identified.
The transcription factor EGR1 (early growth response 1), also known as NGFI-A, KROX-24, ZIF268, and TIS8, is a sequence-specific DNA-binding protein, a member of a zinc finger transcription factor family comprising EGR2, EGR3, and EGR4. The EGR1 gene belongs to the immediate early response gene family, strongly and rapidly induced by many environmental signals, such as growth and differentiation factors, neurotransmitters, hormones, and hypoxic, oxidative, and genotoxic stresses (8). Its biological role has been linked to several key cellular functions, such as proliferation, apoptosis, DNA repair, and migration (8). The reported role of EGR1 in cancer is quite disparate because it is described as either a tumor suppressor or an oncogene, depending on the type of tumor cells and their environment. Although EGR1 expression in human GBM has been associated with increased patient survival (9), detailed characterization of its tumoral localization and contribution to GBM progression remain to be determined.
We report here that EGR1-positive cells are frequent in glioblastomas. In these tumors, nuclear localization of EGR1 is restricted to proliferating cells and strongly associated with OLIG2+ stemlike or progenitor cells. In non-mitotic tumor cells, EGR1, when expressed, is widely excluded from the nucleus and remains in the cytoplasm. Using several independent patient-derived GSCs, we show that EGR1 contributes to stemness marker expression and proliferation by orchestrating a PDGFA-dependent growth stimulatory loop. We show in addition its contribution for the direct regulation of a panel of genes, such as SHH, GLI1, GLI2, and PDGFA, previously associated with stemness and cell proliferation.
Materials and Methods
Primary Cell Culture
The patient-derived primary GSC cultures TG1, TG6, and GB8 were isolated from surgical resections of human glioblastoma, as described previously (10). GB8 cells express stemness markers, including OLIG2, NANOG, NESTIN, and SOX1/2. They display a clonal efficiency of ∼60% and amplification of chromosome 7, including the EGFR gene. They display a full deletion of chromosomes 6 and 10 and a partial deletion of chromosome 9, including the CDKN2A gene. Cells were grown in neurospheres in modified DMEM/F-12 medium containing EGF and basic FGF (DMEM/F-12 (1:1), glutamine (10 mm), Hepes (10 mm), sodium bicarbonate (0.025%), N2, G5, and B27), referred to as “defined medium.” Cells were incubated at 37 °C in a humidified 5% CO2 incubator. To induce cell differentiation, EGF and basic FGF were replaced by 2% fetal calf serum (FCS) (DMEM/F-12 (1:1), glutamine (10 mm), Hepes (10 mm), sodium bicarbonate (0.025%), 2% FCS). When indicated, cells were treated with either a 15 μm concentration of an inhibitor of ERK activation (U0126) or its inactive form (U0124), with DMSO or AG1296, a specific inhibitor of PDGFR (5 μm), or with human recombinant PDGFA (150 μm).
EGR1 shRNA Assays
293T cells were seeded in 10-cm dishes coated with collagen. The next day, cells were transfected with shControl or shEGR1 constructs (GeneCopoeia) along with the packaging vectors with Lipofectamine 2000 reagent (Life Technologies, Inc.) as described previously (11). After 48 h, the supernatant was collected. After diluting 10 times the viral supernatant, TG1 and TG6 were infected as described elsewhere (11). TG1 and TG6 cells stably expressing the shControl (shCtl) or the shEGR1 were selected in medium containing 0.5 μg/ml puromycin for at least 15 days.
Small Interfering RNA Cell Transfection
Cells were seeded in 6-well plates at a density of 0.5 × 10⁶ cells/well and transiently transfected by using Lipofectamine® 2000 reagent (Life Technologies) according to the manufacturer's instructions. Briefly, a 10 nm concentration of Silencer® RNAi (Life Technologies) was diluted in 50 μl of Opti-MEM medium, and 1 μl of Lipofectamine® was diluted in 50 μl of Opti-MEM medium. After 5 min of incubation, the diluted Silencer® RNAi and the diluted Lipofectamine were combined, mixed gently, and incubated for 20 min at room temperature prior to adding the complexes to cells. After 48 h of incubation, a second transfection was performed. Cells were lysed, and RNA or proteins were extracted for experiments.
Quantitative Real-time Reverse Transcription Polymerase Chain Reaction
RNA was extracted using TRIzol reagent (Invitrogen). Quantity and quality of RNA were checked by spectrophotometry and electrophoresis on agarose gels. Micro-RNA and mRNA expression levels were quantified by two-step RT-qPCR. Reverse transcription was performed with the High Capacity cDNA reverse transcription kit (catalog no. 4368813, Applied Biosystems) and the Taqman microRNA reverse transcription kit (catalog no. 4366597, Applied Biosystems) for mRNA and microARN, respectively, following the manufacturer's instructions. Real-time qPCR was performed using universal Taqman PCR Master Mix (catalog no. 4444557, Applied Biosystems). Gene expression levels were calculated by the 2ΔΔCT method, and TBP or GAPDH genes and U54 or U44 snoRNA were used for normalization.
Immunoblotting
Total proteins were extracted from GSCs by using a lysis buffer containing 50 mm Tris-HCl, pH 7.6, 150 mm NaCl, 5 mm EDTA, 1% Nonidet P-40, and Complete protease inhibitor mixture (Roche Applied Science). The protein concentration was determined using the Bradford protein assay (Bio-Rad).
Total proteins from each sample were separated by SDS-PAGE in appropriate acrylamide gels and transferred onto a nitrocellulose membrane. After blocking, blots were incubated with rabbit polyclonal antibodies to EGR1 (sc-110, Santa Cruz Biotechnology, Inc.), PDGFA (sc-128, Santa Cruz Biotechnology), ERK (sc-093, Santa Cruz Biotechnology), or mouse monoclonal antibodies to α-tubulin (catalog no. 32-2500, Life Technologies), and activated phosphorylated ERK (M8159, Sigma-Aldrich) and HRP-conjugated secondary antibody. Immunoblots were revealed by chemiluminescence using ECL (GE Healthcare) and exposed to a Fusion FX7 CCD camera (Vilbert Lourmat). When required, quantification of several experiments was performed using ImageJ software (12).
Immunohistochemistry/TMA Construction and Analysis/Statistical Analysis
All patients were informed and signed their consent for the use of all human samples. Immunolabeling was performed using a DAKO automat with the following primary antibodies: anti-EGR1 (sc-110, Santa Cruz Biotechnology) diluted 1:100, anti-MIB-1 (IR62661, DAKO, catalog no. IR62661) diluted 1:1000. Deparaffinization, rehydration, and antigen retrieval were performed using the pretreatment module PTlink (Dako). Five-μm sections of formalin-fixed paraffin-embedded tissue in tumor microarrays were tested for the presence of EGR1, using a Benchmark Ventana autostainer (Ventana Medical Systems SA, Illkirch, France). All tumor microarray slides were simultaneously immunostained in order to avoid intermanipulation variability. Immunostaining was scored by a pathologist (D. F. B.).
Immunofluorescence
Cells were seeded on polylysine-coated glass slides in cell culture medium. Cells were fixed with 4% paraformaldehyde for 15 min at room temperature. Cells were washed three times and then incubated 30 min at room temperature with phosphate-buffered saline (PBS) containing 0.1% Triton X-100. Cells were blocked with PBS containing 3% FCS and stained with the following primary antibodies: rabbit polyclonal antibodies to EGR1 (sc-110, Santa Cruz Biotechnology, dilution 1:50), phosphorylated histone 3 serine 10 (antibody 5176-100, Abcam; dilution 1:100), Sox1 (antibody 15766, Millipore; dilution 1:50), or goat polyclonal Nanog (AF 1997, R&D Systems; 1:50), SHH (sc-1195, Santa Cruz Biotechnology; dilution 1:50). After 1 h of incubation at room temperature, cells were washed two times with PBS and incubated with species-specific fluorophore-coupled antibodies. At the same time, nuclei were stained with Hoechst 33342 (1:2000 dilution). After 1 h of incubation at room temperature, the slides were washed two times with PBS and mounted with gel/mount. Fluorescence was observed through a ×60 objective on a Nikon Eclipse Ti inverted microscope equipped with a Hamamatsu camera. Image acquisition and quantification were performed with NIS software (Nikon).
Clonogenic Assay
Neurospheres were dissociated by gentle pipetting in their defined medium to obtain individual cells. A serial dilution was performed to obtain one single cell per well in 96-well plates. Immediately after seeding, the presence of one cell/well was verified. After 1 month, the wells containing one neurosphere were counted.
ChIP Assays
Cells were treated with a cross-linking solution of 1% formaldehyde for 10 min at room temperature. The cross-link reaction was stopped by adding 125 mm glycine for 5 min at room temperature. After three washes with cold PBS, cells were lysed with buffer containing a protease inhibitor mixture. Lysates were then sonicated on ice, and the chromatin was sheared to obtain fragments between 150 and 500 bp. Immunoprecipitation steps were performed using a modified protocol from Upstate. Briefly, 3 μg of anti-EGR1 antibody (sc-189X, Santa Cruz Biotechnology) was bound to protein G magnetic beads overnight at 4 °C under rotation. The sheared chromatin was precleared by incubation with beads for 30 min at 4 °C under rotation. The beads were pelleted, and the precleared chromatin supernatant was then immunoprecipitated with the antibody coupled to the beads overnight at 4 °C under rotation. The beads were washed six times with wash buffer, one time with TE buffer containing 50 mm NaCl, and one time with TE buffer. The antibody-protein-DNA complexes were eluted twice in 200 μl of elution buffer by vortexing for 1 h at room temperature. Protein-DNA cross-linking was reversed at 65 °C for no more than 18 h in the presence of 200 mm NaCl. After RNase A and proteinase K digestions, the DNA fragments were purified by phenol/chloroform/isoamyl alcohol extraction. The input fraction was used as a negative control. ChIP-qPCR was performed using the primers listed in supplemental Table S1.
Electrophoretic Mobility Shift Assay
The 293T cell line was transiently transfected with 5 μg of an EGR1 expression vector by using Lipofectamine® 2000 reagent (Life Technologies) according to the manufacturer's instructions. Nuclear proteins were extracted 48 h after transfection. Nuclear extracts were incubated for 20 min at room temperature with biotin-labeled probes. Probe sequences are shown in supplemental Table S2.
ChIP-Sequencing (ChIP-seq) and Bioinformatics Analysis
Immunoprecipitated purified DNA was used to prepare a fragment library according to the ChIP-seq kit guide from the manufacturer and the library preparation guide (Applied Biosystems). Sequence reads of 50 nucleotides were produced with a SOLiDTM 4 sequencer, according to standard manufacturer protocols. The sequence reads were analyzed with the BioScopeTM software suite. After sequence read mapping to the Hg19 human genome version, only reads mapping once to the genome were retained for subsequent analyses, to prevent spurious calls in repetitive regions or amplification artifacts. The peak calling was performed with the Picor tool developed at TAGC UMR_S1090. This algorithm uses the principle of two slide windows, one on each DNA strand, separated by a distance of 100–200 nucleotides. The windows scan the genome to search read enrichments, which should be in the same order of magnitude. This correlation is evaluated by Spearman's correlation coefficient. The aligned read files were then analyzed using several bioinformatic tools, including the Integrative Genomics Viewer and Peak-motifs from the RSAT suite (13). The functional annotation was performed by using GREAT software (14).
Results
Nuclear Expression of EGR1 Is Frequent in GBM and Restricted to Proliferating/Progenitor Cells
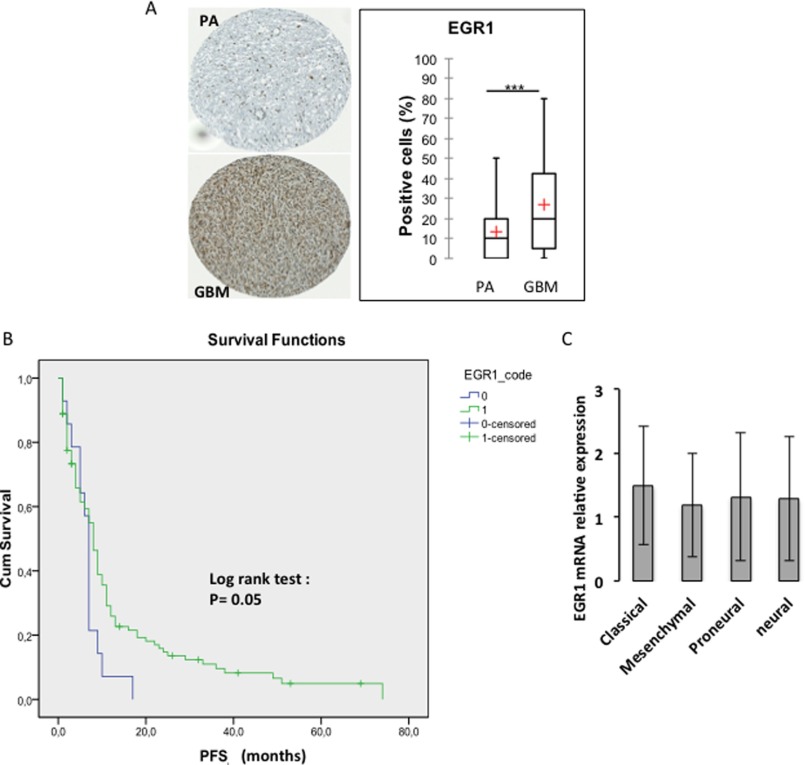
To assess whether EGR1 might be associated with features of infiltration and malignancy of glial tumors, we sought to compare its expression between pilocytic astrocytomas (PA), a non-infiltrating slow growing tumor considered benign, and GBM, aggressive tumors, always infiltrating and fast growing. We performed immunohistochemical analysis of EGR1 expression in tissue microarrays composed of 110 PA and 139 GBM (Fig. 1A and Table 1). These assays revealed that the percentage of EGR1-positive cells was significantly (p = 0.0001) higher in GBM as compared with PA with an average of 27 and 13%, respectively (Fig. 1A). Therefore, the frequency of EGR1 expression is strongly associated with infiltrating and malignant glial tumors. In addition, the quantification of tissue microarrays revealed that EGR1 is expressed in a majority of GBM, almost 82% of the cases (Table 2). Kaplan-Meier analysis using this cohort confirmed that EGR1 expression provided a better patient outcome when the progression-free survival is considered (Fig. 1B). However, according to the The Cancer Genome Atlas (TCGA) database, no significant difference for EGR1 expression was observed between the different GBM subtypes (Fig. 1C).
FIGURE 1.
EGR1 expression profile in human glioblastoma tissues. A, tissue microarray analysis showing EGR1 expression in 139 GBM and 110 PA samples (***, p < 0.01; Student's t test). B, Kaplan-Meier analysis of the progression-free survival (PFS) showing a better patient outcome for the EGR1-positive subgroup (1) (at the protein level) as compared with the EGR1-negative subgroup (0). C, levels of EGR1 transcripts in the four molecular subclasses of GBM defined by the Verhaak molecular GBM classification. The histogram is based on The Cancer Genome Atlas data. Error bars, S.D.
TABLE 1.
Summary of clinical data of patients grouped in glioblastoma (n = 139) or pilocytic astrocytoma (n = 110) cohorts
| Glioblastoma cohort (n = 139) | Pilocytic astrocytoma cohort (n = 110) | |
|---|---|---|
| Mean age at diagnosis (years) | 59.5 ± 10.9 | 7.8 ± 4.6 |
| Sex (%) | ||
| Male | 58.2 | 47.8 |
| Female | 41.8 | 52.2 |
| Sex ratio (male/female) | 1.4 | 0.9 |
| Extent of surgery (%) | ||
| Biopsy | 31.5 | 31.2 |
| Surgery | 68.5 | 68.8 |
| Postoperative treatment (%) | ||
| Radiotherapy | 6 | 0.05 |
| Chemotherapy | 65.5 | 0.08 |
| STUPP regimen | 28.5 |
TABLE 2.
Quantification of cells expressing EGR1 on 139 GBM samples
The third line shows the mean percentage of EGR1-positive cells for the three classes (EGR1 = 0, no EGR1-positive cells; EGR1 < 10%, <10% EGR1-positive cells; EGR1 > 10%, >10% EGR1-positive cells).
| n = 139 | EGR1 = 0 | EGR1 < 10% | EGR1 > 10% |
|---|---|---|---|
| No. of GBM | 18 | 18 | 103 |
| Percentage of GBM | 12.9 | 12.9 | 74.1 |
| Percentage of EGR1+ cells | 0 | 4.5 ± 0.85 | 35.5 ± 23.8 |
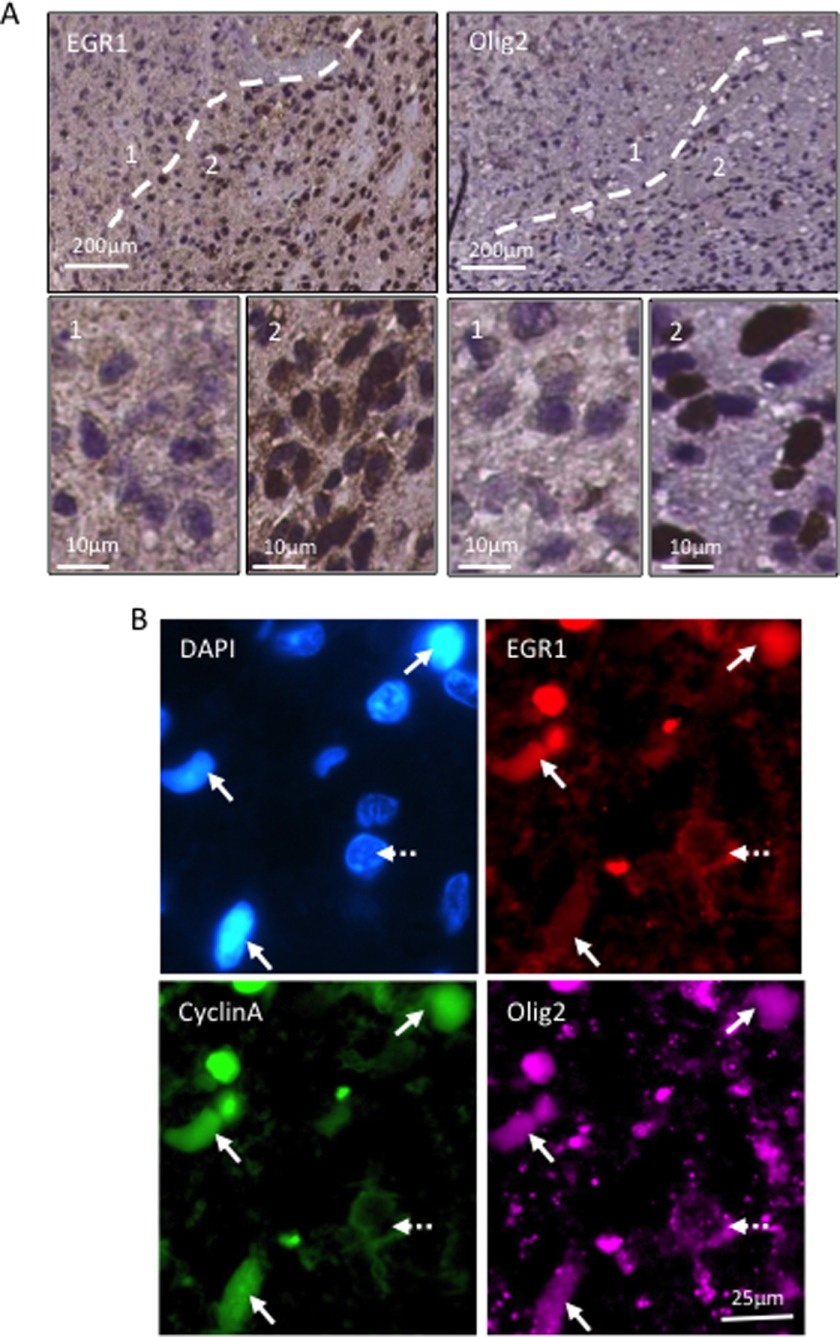
To gain insight into the association of EGR1 expression with mitotic stem/progenitor cells in tumors, we sought to compare it with those of known stem/progenitor markers (OLIG2) (15, 16) and proliferation (KI67) by immunohistochemistry on serial slices of human GBM samples (10 independent cases) (Table 3). As shown in Fig. 2A, the OLIG2 staining defined two zones of either rare (zone 1) or frequent (zone 2) staining. Quantitative analysis revealed that only an average of 10 and 7.7% of cells belonging to zone 1 expressed OLIG2 and KI67, respectively. Conversely, a majority of cells, 71.3 and 55%, respectively, expressed OLIG2 and KI67 in zone 2 (Table 3). Interestingly, EGR1 nuclear expression is observed almost exclusively in cells located in territories enriched in OLIG2-positive cells (Fig. 2A) with an average of 21.9% of EGR1-positive cells compared with only 0.7% in zone 1 (Table 3). To confirm the strict correlation between EGR1 nuclear profile and mitotic progenitor cells, we performed a co-staining of EGR1, cyclin A, and OLIG2 by immunofluorescence on the same GBM samples (10 different cases). The results showed that almost all cyclin A+/OLIG2+ cells (96%) were also positive for nuclear EGR1 (Fig. 2B and Table 4). Taken together, these results demonstrate that EGR1 nuclear expression is frequent in GBM and is strictly restricted to proliferating/progenitor cells.
TABLE 3.
EGR1 expression profile in human glioblastoma samples
The percentages of OLIG2-, KI67-, or nuclear EGR1-positive cells were counted in 10 independent glioblastoma samples.
| Zone 1 |
Zone 2 |
|||||
|---|---|---|---|---|---|---|
| OLIG2 | KI67 | Nuclear EGR1 | OLIG2 | KI67 | Nuclear EGR1 | |
| % | % | % | % | % | % | |
| GBM1 | 0 | 5 | 0 | 0 | 80 | 10 |
| GBM2 | 30 | 3 | 0 | 80 | 50 | 20 |
| GBM3 | 7 | 25 | 0 | 70 | 50 | 2 |
| GBM4 | 12 | 10 | 0 | 60 | 20 | 12 |
| GBM5 | 8 | 10 | 0 | 80 | 80 | 25 |
| GBM6 | 3 | 5 | 0 | 70 | 50 | 5 |
| GBM7 | 0 | 5 | 0.5 | 60 | 55 | 50 |
| GBM8 | 0 | 7 | 2 | 95 | 40 | 20 |
| GBM9 | 20 | 2 | 5 | 98 | 45 | 25 |
| GBM10 | 20 | 5 | 0 | 100 | 80 | 50 |
| Average | 10 ± 10.3 | 7.7 ± 6.6 | 0.7 ± 1.7 | 71.3 ± 29 | 55 ± 19.7 | 21.9 ± 16.7 |
FIGURE 2.
Nuclear EGR1 expression is a feature of mitotic progenitor cells in GBM tissues. Experiments were performed on 10 biological replicates (10 different patients). A, immunohistochemistry analysis showing EGR1 and OLIG2 expression in serial slices of human GBM. The dashed line separates two territories enriched either in OLIG2-negative cells (1) or in OLIG2-positive cells (2). Scale bars are shown. B, immunofluorescence staining showing EGR1 (red), cyclin A (green), and OLIG2 (purple) co-expression in sections from formalin-fixed paraffin-embedded human GBM. The nuclei were stained with DAPI. Arrows, cells positive for three markers. Dashed arrow, a negative cell. Scale bars are shown.
TABLE 4.
Correlation between EGR1 nuclear profile and mitotic progenitor cells
Top quantification of cells either positive for Cyclin A, EGR1, or OLIG2; or double-positive for Cyclin A/EGR1, Cyclin A/OLIG2, or EGR1/OLIG2; or triple positive for Cyclin A/EGR1/OLIG2. Bottom persentage of cells that are EGR1+ or EGR1− among the Cyclin A+, OLIG2+ or Cyclin A+/OLIG2+ cells in 10 different human GBMs. P values were calculated using the student's t test.
EGR1 Contributes to Expression of Stemness Markers and GSC Clonal Proliferation
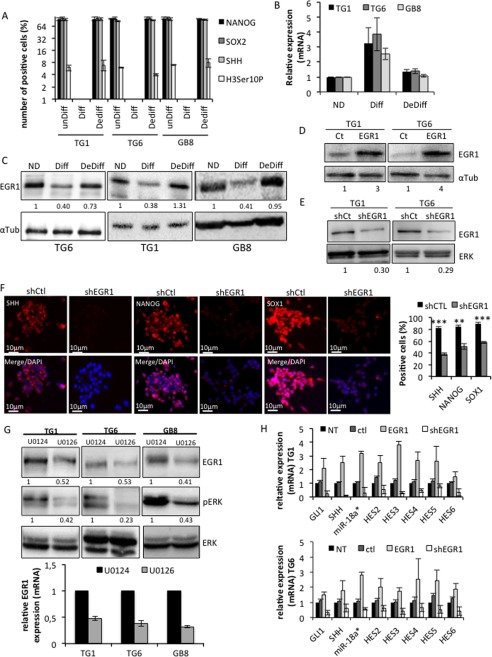
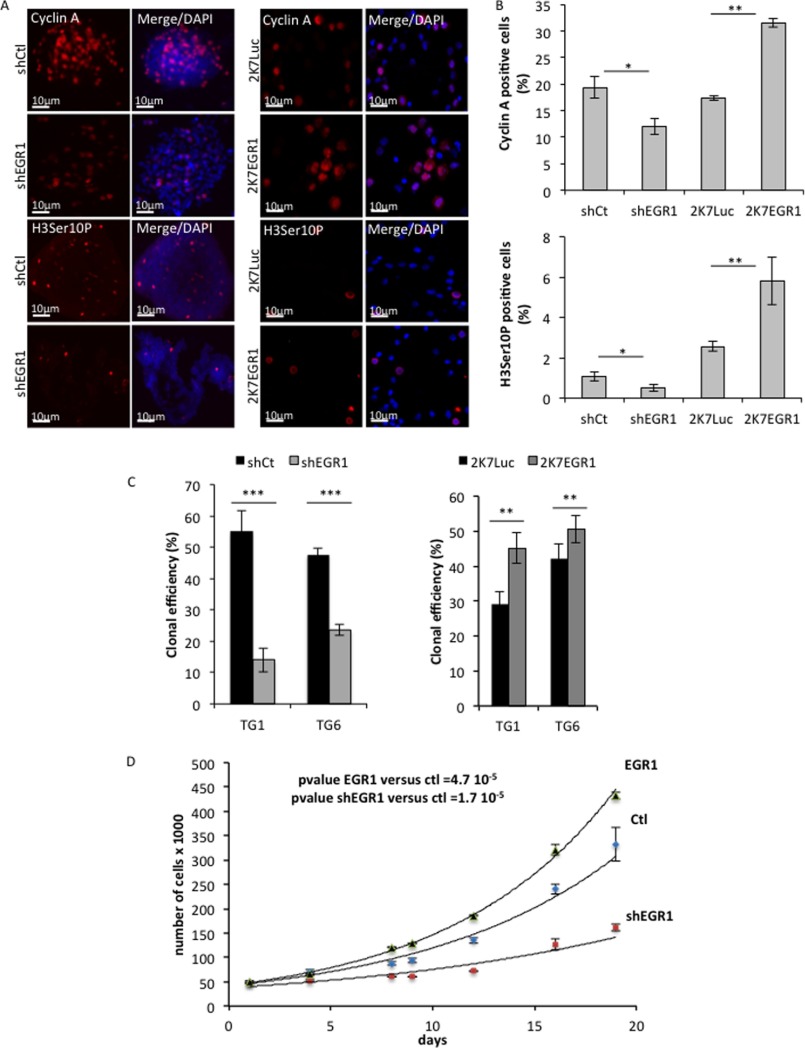
GSCs are a subpopulation of tumor cells that display stemlike characteristics and play unique roles in tumor biogenesis and progression. We previously showed that primary cultures of GSC are able to differentiate and dedifferentiate in vitro according to their environment (5, 11). To characterize EGR1 in GSC, we first assessed its expression during cell differentiation and dedifferentiation. Three independent primary cultures of GSCs (TG1, TG6, and GB8) were cultured either in defined medium to maintain their self-renewal properties, in 2% serum-containing medium (3 days) to promote their differentiation, or in serum-containing medium (3 days) and then defined medium (48 h) to trigger their dedifferentiation (5) (Fig. 3A). Contrasting with its expression in self-renewing cells, the level of EGR1 protein was strongly repressed upon cell differentiation, despite the induction of its transcripts (Fig. 3, B and C). Interestingly, EGR1 protein expression resumed upon dedifferentiation (Fig. 3C). These results demonstrate that EGR1 expression correlates with stemness and suggest that it contributes to stemness maintenance. To address this issue, EGR1 was stably overexpressed in GSC using an expression vector (Fig. 3D) and subsequently inhibited with an EGR1-targeted shRNA (Fig. 3E). EGR1 silencing led to a drastic repression of proliferation and stem/progenitor markers, such as SHH, SOX1, and NANOG, as well as a significant drop in the number of positive cells (Fig. 3F). We previously described that activated ERK plays a major role in clonal proliferation by turning on the SHH-GLI1-NANOG network through a miR-18A*-dependent gene regulatory network (5). Prevention of ERK phosphorylation, using U0126 in self-renewing GSC, led to a decrease in EGR1 expression (Fig. 3G). On the other hand, EGR1 silencing led to a significant repression of most of the miR-18a* pathway members, including miR-18a* and NOTCH target genes, whereas its overexpression increased their expression (Fig. 3H). Accordingly, the number of proliferating/mitotic cells, assessed by cyclin A and histone H3 phospho-Ser-10 staining and cell counting, and the self-renewal potential, assessed by a single cell colony-forming assay, were significantly decreased when EGR1 was repressed while being enhanced by its overexpression (Fig. 4, A–D). Taken together, these results demonstrate that EGR1 constitutes an ERK effector, at least in the miR-18a*-dependent network, for the maintenance of GSC stemness and self-renewal.
FIGURE 3.
EGR1 is associated with stemness and contributes to the regulation of the ERK/miR-18a* network. TG1, TG6, and GB8 cells (from three different patients) were cultured in defined medium (unDiff), in serum (Diff), or in serum and then switched to defined medium for 4 days (DeDiff). A, the efficiency of differentiation (Diff) or dedifferentiation (Dediff) of TG1, TG6, and GB8 cells was assessed by the expression of SHH, NANOG, and SOX2 used as stemness markers and the number of mitotic cells (Histone H3-phospho-Ser-10-positive cells (H3Ser10P)). The result is the mean of three independent experiments. B, the relative expression of EGR1 mRNA was assessed by RT-qPCR using a TAQMAN probe. The result is the mean of three independent experiments. C, EGR1 protein expression in TG1, TG6, and GB8 cells was assessed by immunoblotting. Antibody specific to α-tubulin was used as loading control. Numbers below each Western blot correspond to the relative quantification of the bands. D and E, EGR1 protein expression was assessed by immunoblotting in TG1, TG6, and GB8 cells after stable infection with either an EGR1 expression vector (D) or an EGR1-targeting shRNA (shEGR1) (E). Specific antibodies to ERK or to α-tubulin were used as a loading control. Numbers below the blots correspond to the relative quantification. F, immunofluorescence staining showing the SHH, NANOG, and SOX1 expression on TG6 cells expressing an EGR1-targeting (shEGR1) or control (shCtl) shRNA and cultured in defined medium. Nuclei were stained with DAPI. Scale bars are shown. Quantification of positive cells for each marker is shown on the right. Five independent fields for each condition have been counted (**, p < 0.01; ***, p < 0.001; Student's t test). G, immunoblotting and QPCR showing EGR1 expression and ERK phosphorylation in TG1, TG6, and GB8 cells treated with U0126 or the U0124 inactive analog. A specific antibody to total ERK was used as a loading control. Quantification is shown below the blots. H, relative expression of GLI1, SHH, miR-18a*, and HES genes assessed by RT-qPCR in untreated (NT) TG1 (top bar chart) and TG6 (bottom bar chart) cells or stably expressing a control vector (ctl), an expression vector (EGR1), or a specific shRNA (shEGR1). Data correspond to the mean of three independent experiments. Error bars, S.E.
FIGURE 4.
Impact of EGR1 inhibition or overexpression on GSC proliferation. A, immunofluorescence staining showing the expression of cell proliferation markers,cyclin A and Ser-10 phosphohistone 3 (H3Ser10P) in TG6 cells depleted for EGR1 (shEGR1) or overexpressing EGR1 (2K7EGR1) compared with the control cells (shCt or 2K7Luc). Nuclei were stained with DAPI. Scale bars are shown. B, quantification of cyclin A or Ser-10 phosphohistone 3-positive cells. Five independent fields for each condition were counted (*, p < 0.05; **, p < 0.01; Student's t test). C, evaluation of TG1 and TG6 clonal efficiency following efficient transduction by either shEGR1 or 2K7EGR1 compared with the control condition, shCt, or 2K7Luc, respectively. Single cells were seeded in 96-well plates. Clonal efficiency of 100% corresponds to 1 colony/well for 100 wells. Three hundred wells were counted (**, p < 0.01; ***, p < 0.001; Student's t test). D, cell proliferation of TG6 cells efficiently transduced with either an EGR1 expression vector or a specific shRNA and compared with the control condition. Counting was performed over 20 days. Error bars, S.D.
Identification of EGR1 Direct Target Genes
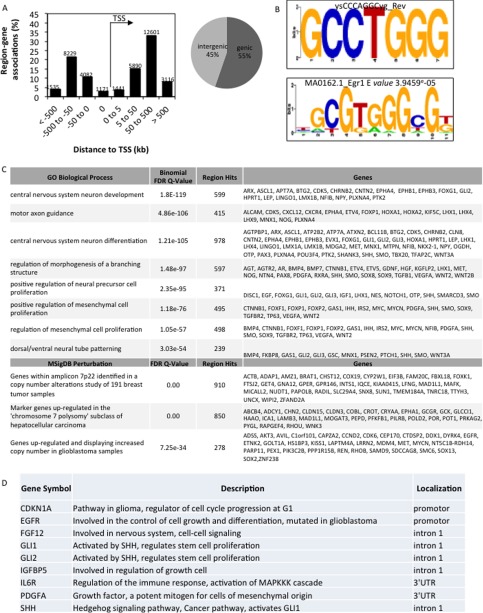
To gain molecular insights into the mechanism by which EGR1 contributes to the GSC phenotype, we performed a ChIP-seq assay to identify its genomic binding sites, using self-renewing TG6 cells grown in defined medium (supplemental Fig. S1). Using Picor, a stringent custom-designed peak-caller software developed in the TAGC laboratory,5 we identified 21,944 peaks, distributed from −500 to +500 kb around transcription start sites (TSS); among them, 45% were located in intergenic regions as defined by GREAT gene association rules (Fig. 5A). Motif discovery using the Peak-motifs algorithm (13, 17) revealed that the five most significant motifs are GC-rich. The alignment of these motifs against the core vertebrate JASPAR database carried out with the Web server STAMP (18, 41) highlighted that these five GC-rich motifs are significantly related to the known EGR1 binding site (Fig. 5B). Altogether, these analyses confirmed the validity of our ChIP-seq assay.
FIGURE 5.
EGR1 targets identified by ChIP-seq assay in proliferating GSC. A, bar chart showing the distribution of DNA sequence tags around the transcription start site (TSS) generated by GREAT software. The pie chart shows the percentage of peaks located in genic and intergenic regions. B, the top panel shows the most significant motif identified with the RSAT Peak-motifs pipeline for discovering motifs in massive ChIP-seq peak sequences. The bottom panel shows the output of the Web server STAMP, which reports the best similarity match between the motifs newly discovered by Peak-motifs and motifs known in the JASPAR database; in this case, the motif corresponds to a canonical EGR1 binding site (p = 3.9 × 10⁻⁵). C, functional annotation enrichments generated with Web server GREAT from genomic regions identified by the EGR1 peak data set generated by the ChIP-seq assay. D, candidate gene subset potentially regulated by EGR1. The nine genes were selected among the list of EGR1 targets identified by the ChIP-seq assay, in light of their importance for proliferation and GBM biology.
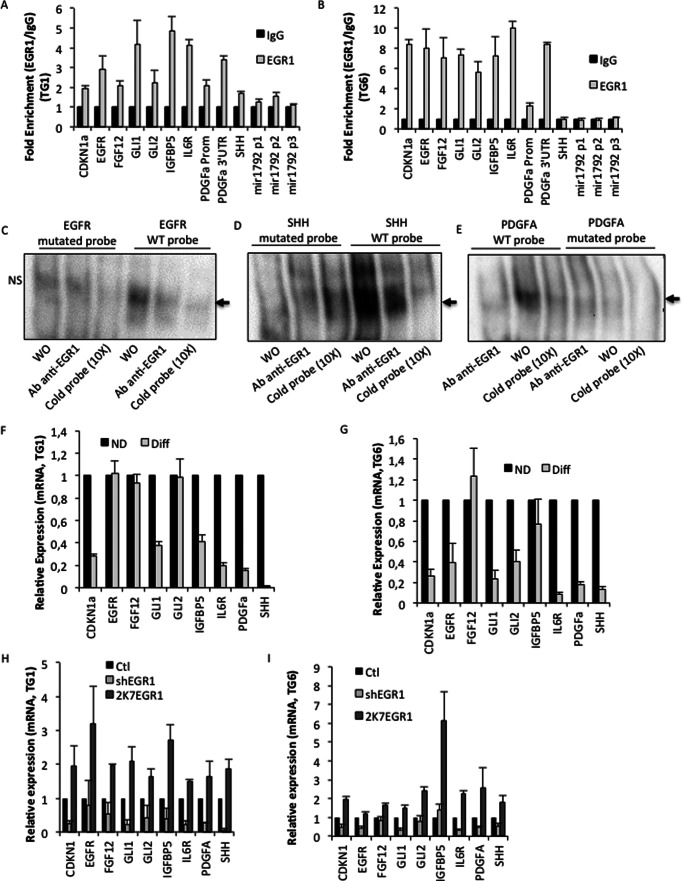
In agreement with the chromosome 7 rearrangement in TG6 cells (5), functional annotation analysis of genes located at the position the closest to the identified peaks revealed candidates either up-regulated/amplified in GBM or involved in central nervous system development, differentiation, and regulation of neural precursor cell proliferation (Fig. 5C). Interestingly, a subset of peaks were located either in the core promoter, in the first intron, or in the 3′-UTR sequences of genes, such as EGFR, FGF12, GLI1, GLI2, IGFBP5, IL6R, PDGFA, and SHH, particularly involved in the control of cell growth or GSC self-renewal (Fig. 5D and supplemental Fig. S2). To confirm EGR1 recruitment in vivo, we performed ChIP-qPCR assays in TG1 and TG6 cells using primers spanning these genomic regions. As expected, EGR1 binding was significantly increased in the putative regulatory sequence of almost all of these genes in both cell lines (Fig. 6, A and B). However, it was bound to the SHH regulatory sequence only in TG1 cells (Fig. 6A). The ChIP-seq analysis revealed a strong enrichment of sequences located in the 3′-UTR of the PDGFA gene, whereas several functional EGR1 binding sites were located in its core promoter (19). ChIP assays targeting both the core promoter and the 3′-UTR sequence confirmed enrichment of both regulatory regions but displayed much more enrichment for the sequence located in the 3′-UTR (Fig. 6, A and B). The miR-18a* regulatory sequences were not revealed by the ChIP-seq analysis. However, a previous report showed efficient EGR1 binding to miR-18a* regulatory sequences upon PMA treatment (20). Accordingly, we found a possible EGR1 recruitment in TG1 cells (Fig. 6A). The fact that EGR1 did not bind the miR-18a* promoter in TG6 (Fig. 6B) indicates that two different EGR1-dependent mechanisms, involving direct or indirect binding, occur to regulate miR-18a* expression, as seen in Fig. 3G. Specific EGR1 binding to identified sites located in promoter, 3′-UTR, or intronic regions have been further confirmed by electrophoretic mobility shift assays, where EGR1-specific protein-DNA complexes were only revealed with wild-type probes and efficiently blocked by EGR1 antibody (Fig. 6, C–E).
FIGURE 6.
Validation of the regulation by EGR1 of its targets in proliferating GSC. A and B, EGR1 direct binding within the putative regulatory regions of the nine selected EGR1 target genes and of the miR-17–92 in TG1 and TG6 cells assessed by ChIP qPCR assays (*, p < 0.05 for enrichment obtained with miR-17–92 p2; Student's t test). C–E, electrophoretic mobility shift assays using wild-type probes containing a putative EGR1 binding site for three EGR1 target genes, EGFR, SHH, and PDGFA. Mutated probes where the putative EGR1 binding site has been disrupted have been used. The black arrow on the right side of panels indicates the EGR1-specific protein-DNA complex. F and G, relative expression of nine selected EGR1 target genes assessed by RT-qPCR in differentiated TG1 and TG6 cells. H and I, relative expression of nine selected EGR1 target genes assessed by RT-qPCR in TG1 and TG6 cells cultured in defined medium and efficiently infected with a control vector (Ctl), or a specific shRNA (shEGR1), or an expression vector (2K7EGR1). The data represent the average of three independent experiments. Error bars, S.E.
Interestingly, TG1 and TG6 differentiation, which induced a strong decrease of EGR1 protein levels (Fig. 3C), as well as EGR1 silencing using shRNA led to the down-regulation of most of the direct EGR1 targets, especially CDKN1a, GLI1, IL6R, and PDGFA, whereas EGR1 overexpression led to their induction (Fig. 6, F–I). Taken together, these results demonstrate that in self-renewing GSCs, EGR1 directly binds and tightly regulates an important set of genes, including PDGFA and SHH signaling components, involved in the control of cell proliferation and stemness.
A Positive Feed-forward Control Associating PDGFA and EGR1 Is Necessary for GSC Stemness and Proliferation
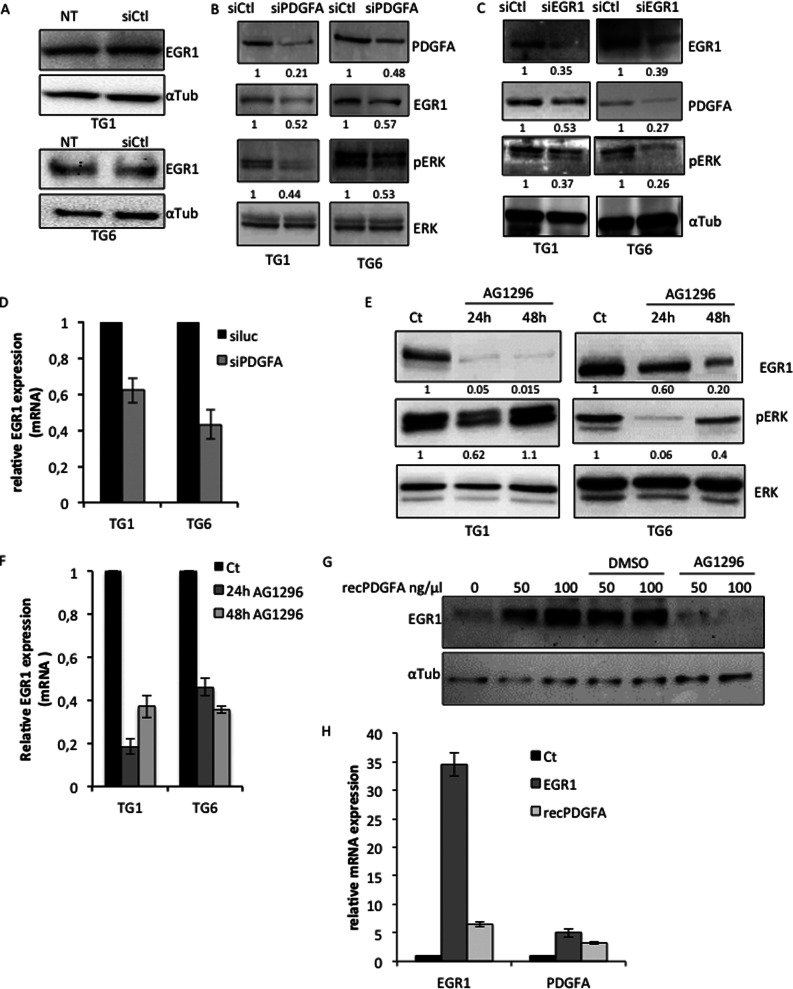
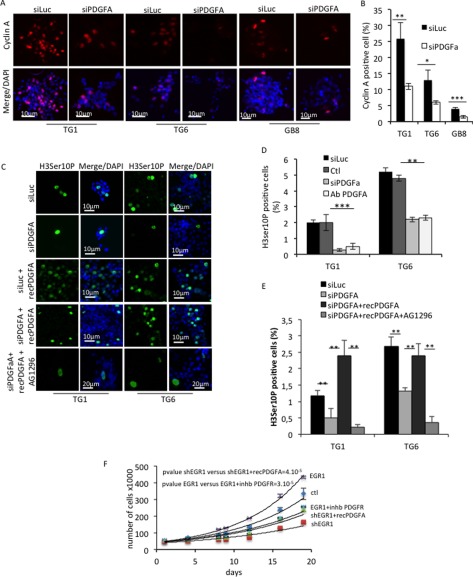
Among the direct EGR targets identified above, we focused on PDGFA. Indeed, this growth factor is widely known for activating the ERK pathway (8), which is necessary for EGR1 expression (Fig. 3G) as well as GSC proliferation (5). To further analyze the functional interaction between PDGFA and EGR1, we performed a series of assays illustrated in Fig. 7. Whereas a non-relevant siRNA control had no effect on EGR1 expression in both TG1 and TG6 cells (Fig. 7A), a PDGFA-specific siRNA led to a decrease of 56 and 47% of ERK phosphorylation in TG1 and TG6 cells, respectively (Fig. 7B). Interestingly, EGR1 silencing, which led to decreased PDGFA expression, produced a similar effect on ERK phosphorylation (Fig. 7C). EGR1 expression was also affected by PDGFA depletion (Fig. 7, B and D), confirming the requirement of activated ERK to maintain its expression. These results indicate that PDGFA is required for ERK activation and subsequent expression of EGR1 in GSC. In full agreement, blocking its receptor with a PDGFR-specific pharmacological inhibitor (AG1296) repressed both EGR1 expression and ERK activation in self-renewing GSC (Fig. 7, E and F). The stimulation of EGR1 protein expression by this growth factor was further confirmed by treating the cells with increasing amounts of a recombinant form of PDGFA (recPDGFA) that was completely inhibited by AG1296 (Fig. 7, G and H). Accordingly and as a consequence of PDGFA silencing, the percentage of cyclin A (Fig. 8, A and B) and histone H3 (phospho-Ser-10)-positive cells dropped drastically, thus revealing a deep impact on cell proliferation and mitosis (Fig. 8, A–F). PDGFA restoration in a similar context, using recombinant PDGFA directly added to the culture medium, totally rescued the mitotic activity revealed by H3 (Ser-10) phosphorylation (Fig. 8, C–E). However, inhibition of PDGFRα/β prevented the rescue of cell mitosis when PDGFA expression was restored (Fig. 8, C–E). As illustrated in the graph, stable EGR1 overexpression strongly activated TG6 cell proliferation that was very efficiently inhibited by shEGR1-mediated knockdown (Fig. 8F). In parallel, inhibition of the PDGF pathway by the chemical compound significantly reduced EGR1-induced cell proliferation, whereas the addition of recPDGFA partially restored cell proliferation following EGR1 silencing (Fig. 8F).
FIGURE 7.
PDGFA signaling contributes to the maintenance of EGR1 expression in GSC. A, immunoblotting showing the unaffected EGR1 expression in TG1 and TG6 cells transfected with a non-relevant control siRNA (siCtl). This expression is compared with the basal EGR1 expression in untreated cells (NT). A specific antibody to α-tubulin was used as loading control. B and C, immunoblotting showing the effects of siRNA-mediated PDGFA- and EGR1-specific inhibition (siPDGFA and siEGR1) on phosphorylation of ERK in TG1 and TG6 cells. Antibodies specific to total ERK or α-tubulin were used as loading control. D, QPCR showing EGR1 mRNA levels in TG1 and TG6 in response to siPDGFA or siLuc treatment. E and F, immunoblotting (E) and qPCR (F) showing the effect of PDGFR chemical inhibitor AG1296 on EGR1 expression and ERK phosphorylation in TG1 and TG6 cells. Cells were treated for 24 or 48 h. A specific antibody to total ERK was used as loading control. Quantification is shown below each blot. G, immunoblotting showing EGR1 expression in untreated cells or cells treated with increasing amounts of recPDGFA in the presence of DMSO, used as control, or AG1296. A specific antibody to α-tubulin was used as a loading control. H, relative expression of EGR1 and PDGFA in untreated (Ct) or EGR1-expressing (EGR1) cells or cells treated with recPDGFA (recPDGFA). Error bars, S.E.
FIGURE 8.
PDGFA is involved in the GSC proliferation. A, immunofluorescence staining showing cyclin A expression in TG1, TG6, and GB8 cells transfected with a control siRNA (siLuc) or a siRNA to PDGFA (siPDGFA). Nuclei were stained with DAPI. Scale bars are shown. B, quantification of cyclin A-positive cells in each primary culture. Five independent fields were counted. *, p < 0.05; **, p < 0.01; ***, p < 0.001; Student's t test). C, immunofluorescence staining showing mitotic cells assessed by the Ser-10 phosphohistone 3 expression in TG1 and TG6 cells cultured in defined medium. Cells were transiently transfected with a control siRNA (siLuc) or a PDGFA-targeting siRNA (siPDGFA) in the presence or absence of recombinant PDGFA protein (recPDGFa) to rescue the PDGFA signaling. When indicated, cells were treated with AG1296. Nuclei were stained with DAPI. Scale bars are shown. D, quantification of mitotic cells by counting the Ser-10 phosphohistone 3-positive cells for untreated (Ctl) TG1 and TG6 cells or transiently transfected with a non-relevant siRNA (siCtl), siPDGFA, or treated with a PDGFA-blocking antibody (Ab PDGFA) (**, p < 0.01; Student's t test). E, quantification of mitotic cells assessed by Ser-10 phosphohistone 3 staining in TG1 and TG6 treated as shown in C by counting the Ser-10 phosphohistone 3-positive cells for TG1 and TG6 cells with siLuc or siPDGFA or treated with a blocking PDGFA antibody (**, p < 0.01; Student's t test). F, cell proliferation of TG6 cells efficiently transduced with either an EGR1 expression vector or a specific shRNA and compared with the control condition. When indicated, cells were treated with a PDGFR chemical inhibitor or a recombinant PDGFA protein. The count was performed over 20 days. Error bars, S.E.
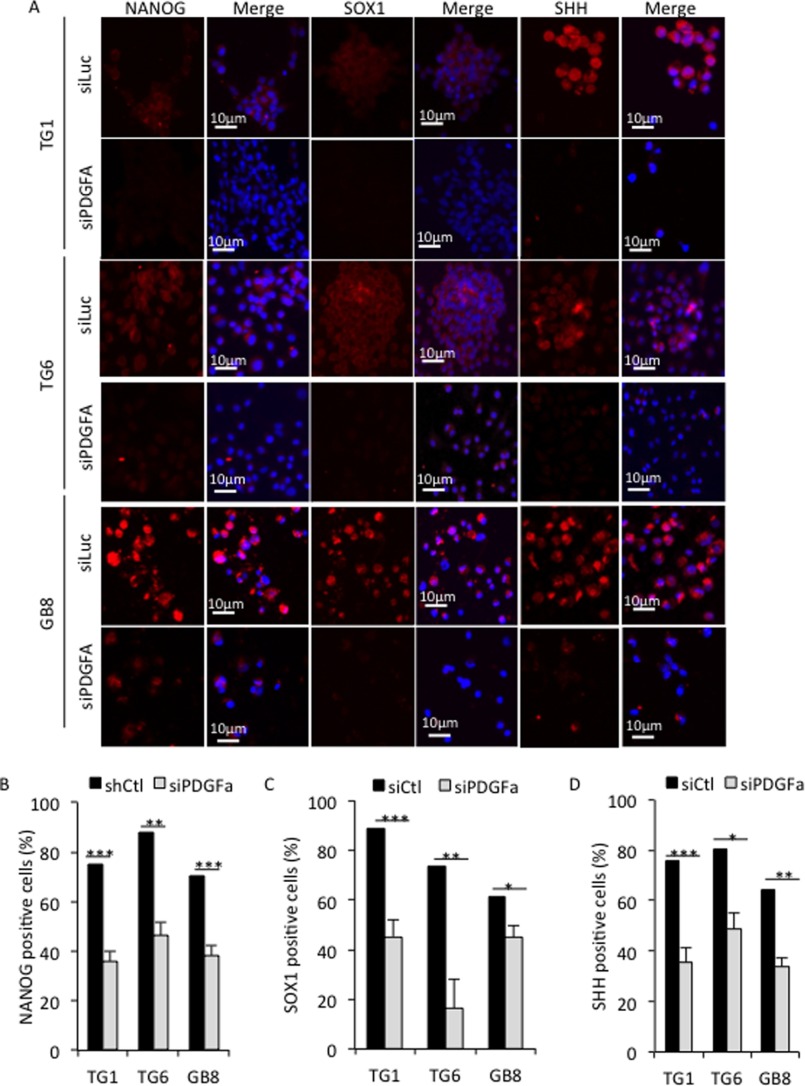
Similar to EGR1 silencing, PDGFA depletion compromised expression of stemness markers, such as NANOG, SOX1, and SHH, as assessed in TG1, TG6, and GB8 cells by immunofluorescence (Fig. 9, A–D). Altogether, results presented in Figs. 7–9 clearly demonstrate that PDGFA and EGR1 are interdependent for their expression and constitute therefore a positive feed-forward loop necessary to maintain GSC stemness and proliferation.
FIGURE 9.
PDGFA contributes to maintain stemness marker expression in GSG. A, immunofluorescence staining showing NANOG, SOX1, and SHH expression in TG1, TG6, and GB8 cells. Cells cultured in defined medium were transfected with either a non-relevant siRNA (siLuc) or a PDGFA-specific siRNA (siPDGFA). Nuclei were stained with DAPI. Scale bars are shown. B–D, quantification of cells positive for NANOG, SOX1, and SHH staining, respectively. Five independent fields were counted. *, p < 0.05; **, p < 0.001; ***, p < 0.0001; Student's t test. Error bars, S.E.
Discussion
Due to its ability to regulate a large panel of genes, EGR1 is a transcription factor capable of controlling a variety of important cellular events, such as cell growth or apoptosis (8). Whether EGR1 acts as a tumor suppressor or oncogene in cancer cells is still a matter of controversy, and two opposing actions of EGR1 have been described, depending on its expression pattern and the biological context. Indeed, elevated in prostate cancer (21), it contributes to proliferation, cell survival, and tumor progression (22, 23), whereas it is frequently low in lung and breast cancer, where it is rather considered as a tumor suppressor because its exogenous expression inhibits cell growth and tumorigenicity (24, 25). In high grade astrocytomas, EGR1 expression is associated with enhanced patient survival (9), suggesting a tumor suppressor activity. This is further supported by other studies describing its growth suppressor activity when overexpressed or induced by natural compounds, such as curcumin (26, 27). In the present study, we have established the EGR1 expression profile in a large set of human GBM. Importantly, we have taken into account its intracellular localization. We first demonstrated that when tumors express EGR1, the frequency of EGR1-positive cells is much higher in grade IV, aggressive, and infiltrative astrocytomas (GBM) than in benign non-infiltrative and slowly growing PA. It is noteworthy that EGR1 expression is quite frequent in GBM, amounting to more than 80% EGR1-positive cases in the cohort we studied. Importantly, we observed that EGR1 nuclear expression occurred in a large majority of proliferating cyclin A/OLIG2-positive cells. In accordance with the essential contribution of OLIG2 to the maintenance and proliferation of GSCs (15, 16), our data show a strong link between basal nuclear expression of EGR1, aggressiveness, and stemness. The consequence of EGR1 deficiency is an alteration of GSC self-renewal, proliferation, and maintenance. This pro-proliferative EGR1 function that we uncovered in GBM stem/progenitor cells contrasts with its association with patient survival (9), suggesting a deleterious effect on tumor progression. This functional discrepancy could be explained by the fact that patient survival data are established following conventional genotoxic treatments, which most probably induce EGR1 expression. Although an EGR1 contribution to temozolomide resistance has been suggested in certain GBM cell lines (28), it is likely that induced EGR1 expression upon genotoxic pressure may promote proliferation arrest and cell death through induction of tumor suppressor genes (29–32), thus explaining the slightly significant better patient outcome shown in Fig. 1. However, the presence of EGR1 does not prevent the emergence of resistant cells and tumor recurrence in the large majority of GBM. Therefore, based on our results and certain reports in other tumor cell types, in particular in MCF7 breast cancer cells (33), we propose that constitutive basal EGR1 expression in cancer cells contributes to proliferation and tumor progression, whereas inducible EGR1 expression in response to stresses or ectopic overexpression may switch its behavior toward an anti-proliferative and death program. This dual EGR1 function, dependent on the biological context and its expression level, seems to be restricted to cancer cells. Indeed, in normal adult hematopoietic stem cells, the repression of constitutive EGR1 expression is required to ensure the switch between non-mitotic and mitotic migrating progenitors (34). We have functionally demonstrated, using primary cultured GSCs, that EGR1 plays a central role in the phospho-ERK/miR-18a*/NOTCH1/SHH regulatory network that we previously described as crucial for the regulation of self-renewal and GSC maintenance (5). In accordance with other reports in a variety of models (8, 35–37), EGR1 expression in self-renewing GSC is highly dependent on ERK activation. In this context, EGR1 is responsible for miR-18a*, SHH, and GLI1 transcriptional regulation by directly interacting with their regulatory sequences. Interestingly, EGR1-dependent control of SHH and miR-18a* expression may also occur indirectly, as illustrated by the results we obtained in TG6 cells. In this case, it is likely that indirect regulation of EGR1 might occur through a phospho-ERK-dependent mechanism orchestrating EGR1 expression itself. Indeed, by stimulating miR-18a* expression, EGR1 contributes to NOTCH1 activation, which contributes in turn to the maintenance of ERK phosphorylation, which subsequently activates the SHH/GLI/NANOG regulatory network (5, 38). The SHH/GLI/NANOG network is all the more important because it is required for GSC clonal proliferation (5–7). Therefore in GSC, EGR1 constitutes an important functional link in charge of turning on a constitutive positive feed-forward loop maintaining the activation of the phospho-ERK/miR-18a*/NOTCH1/SHH network (5).
PDGFA is a well known EGR1 target contributing to EGR1-dependent cellular growth control in a variety of models, including head and neck squamous cell carcinoma (8, 39). Although efficient binding of EGR1 has been reported on several canonical binding sequences in the PDGFA core promoter (19), our ChIP-seq analysis revealed the binding of EGR1 to sequences located in the 3′-UTR of the PDGFA gene. Targeted ChIP assays further confirmed that EGR1 binds much more frequently the 3′-UTR sites than the motifs located in the core promoter. EGR1 binding at this position in the PDGFA gene has never been reported and might constitute the trigger of constitutive PDGFA expression in this model. This EGR1-dependent stimulation of PDGFA maintains, as already described in other models (8, 40), a growth-stimulatory loop, which stimulates ERK phosphorylation through PDGFR activation and subsequent EGR1 synthesis.
In conclusion, our study clarifies EGR1 expression and function in GBM. Only nuclear in stem/progenitor cells, constitutive EGR1 expression is crucial for clonal proliferation and stemness maintenance.
Author Contributions
N. S. designed, performed, and analyzed all of the experiments and contributed to writing the paper. L. T. designed, performed, and analyzed all of the experiments. A. B. performed bioinformatic analysis. H. H. contributed to the ChIP-seq experiment. S. R. provided technical assistance. F. L. contributed to bioinformatic analysis. P. P. contributed to providing tumor samples and analyzed the results. F. A. provided tumor samples and analyzed the results. D. F. provided tumor samples. N. B. K. designed, performed, and analyzed the experiments shown in Fig. 1, A and B. E. V. O. corrected the manuscript. J. M. P. provided biological material and analyzed data. H. C. provided biological material and analyzed data. D. F. B. designed, performed, and analyzed the experiments shown in Fig. 1, A and B. F. B. V. coordinated the study and analyzed the experiments shown in Fig. 2. J. I. conceived and coordinated the study, wrote the paper, and gave final approval of the version to be published. T. V. conceived and coordinated the study, wrote the paper, and gave final approval of the version to be published.
Supplementary Material
Acknowledgments
We thank A. Borderie, S. Bestrée, C. Hagnere, and F. Frassinetti for technical assistance and C. Colin for statistical analyses. High throughput sequencing was performed at the TGML Platform, supported by grants from INSERM, GIS IBiSA, Aix-Marseille Université, and ANR-10-INBS-0009-10.
This work was supported by grants from the Association Sauvons Laura, Agence Nationale pour la Recherche (ANR Jeunes Chercheurs, Jeunes Chercheuses, “GLIOMIRSTEM project” and ANR-10-INBS-0009-10), Fondation de France, Association pour la Recherche sur le Cancer ARC Project SFI20111203773, INCA PLBIO2012, INSERM, UNSA, and ITMO CANCER Plan Cancer Epigenetic. The authors declare that they have no conflicts of interest with the contents of this article.

This article contains supplemental Tables S1 and S2 and Figs. S1 and S2.
A. Bergon and C. Lepoivre, unpublished data.
- GBM
- glioblastoma(s)
- GSC
- glioma stemlike cell
- qPCR
- quantitative PCR
- ChIP-seq
- ChIP-sequencing
- PA
- pilocytic astrocytoma(s)
- PDGFR
- PDGF receptor
- recPDGFA
- recombinant form of PDGFA.
References
- 1. Ostrom Q. T., Bauchet L., Davis F. G., Deltour I., Fisher J. L., Langer C. E., Pekmezci M., Schwartzbaum J. A., Turner M. C., Walsh K. M., Wrensch M. R., and Barnholtz-Sloan J. S. (2014) The epidemiology of glioma in adults: a “state of the science”. Neuro. Oncol. 16, 896–913 [DOI] [PMC free article] [PubMed] [Google Scholar]
- 2. Cheng L., Huang Z., Zhou W., Wu Q., Donnola S., Liu J. K., Fang X., Sloan A. E., Mao Y., Lathia J. D., Min W., McLendon R. E., Rich J. N., and Bao S. (2013) Glioblastoma stem cells generate vascular pericytes to support vessel function and tumor growth. Cell 153, 139–152 [DOI] [PMC free article] [PubMed] [Google Scholar]
- 3. Ricci-Vitiani L., Pallini R., Biffoni M., Todaro M., Invernici G., Cenci T., Maira G., Parati E. A., Stassi G., Larocca L. M., and De Maria R. (2010) Tumour vascularization via endothelial differentiation of glioblastoma stem-like cells. Nature 468, 824–828 [DOI] [PubMed] [Google Scholar]
- 4. Visvader J. E., and Lindeman G. J. (2008) Cancer stem cells in solid tumours: accumulating evidence and unresolved questions. Nat. Rev. Cancer 8, 755–768 [DOI] [PubMed] [Google Scholar]
- 5. Turchi L., Debruyne D. N., Almairac F., Virolle V., Fareh M., Neirijnck Y., Burel-Vandenbos F., Paquis P., Junier M. P., Van Obberghen-Schilling E., Chneiweiss H., and Virolle T. (2013) Tumorigenic potential of miR-18A* in glioma initiating cells requires NOTCH-1 signaling. Stem Cells 31, 1252–1265 [DOI] [PubMed] [Google Scholar]
- 6. Clement V., Sanchez P., de Tribolet N., Radovanovic I., and Ruiz i Altaba A. (2007) HEDGEHOG-GLI1 signaling regulates human glioma growth, cancer stem cell self-renewal, and tumorigenicity. Curr. Biol. 17, 165–172 [DOI] [PMC free article] [PubMed] [Google Scholar]
- 7. Zbinden M., Duquet A., Lorente-Trigos A., Ngwabyt S. N., Borges I., and Ruiz i Altaba A. (2010) NANOG regulates glioma stem cells and is essential in vivo acting in a cross-functional network with GLI1 and p53. EMBO J. 29, 2659–2674 [DOI] [PMC free article] [PubMed] [Google Scholar]
- 8. Thiel G., and Cibelli G. (2002) Regulation of life and death by the zinc finger transcription factor Egr-1. J. Cell Physiol. 193, 287–292 [DOI] [PubMed] [Google Scholar]
- 9. Mittelbronn M., Harter P., Warth A., Lupescu A., Schilbach K., Vollmann H., Capper D., Goeppert B., Frei K., Bertalanffy H., Weller M., Meyermann R., Lang F., and Simon P. (2009) EGR-1 is regulated by N-methyl-d-aspartate-receptor stimulation and associated with patient survival in human high grade astrocytomas. Brain Pathol. 19, 195–204 [DOI] [PMC free article] [PubMed] [Google Scholar]
- 10. Patru C., Romao L., Varlet P., Coulombel L., Raponi E., Cadusseau J., Renault-Mihara F., Thirant C., Leonard N., Berhneim A., Mihalescu-Maingot M., Haiech J., Bièche I., Moura-Neto V., Daumas-Duport C., et al. (2010) CD133, CD15/SSEA-1, CD34 or side populations do not resume tumor-initiating properties of long-term cultured cancer stem cells from human malignant glio-neuronal tumors. BMC Cancer 10, 66. [DOI] [PMC free article] [PubMed] [Google Scholar]
- 11. Fareh M., Turchi L., Virolle V., Debruyne D., Almairac F., de-la-Forest Divonne S., Paquis P., Preynat-Seauve O., Krause K. H., Chneiweiss H., and Virolle T. (2012) The miR 302–367 cluster drastically affects self-renewal and infiltration properties of glioma-initiating cells through CXCR4 repression and consequent disruption of the SHH-GLI-NANOG network. Cell Death Differ. 19, 232–244 [DOI] [PMC free article] [PubMed] [Google Scholar]
- 12. Schneider C. A., Rasband W. S., and Eliceiri K. W. (2012) NIH Image to ImageJ: 25 years of image analysis. Nat. Methods 9, 671–675 [DOI] [PMC free article] [PubMed] [Google Scholar]
- 13. Thomas-Chollier M., Herrmann C., Defrance M., Sand O., Thieffry D., and van Helden J. (2012) RSAT peak-motifs: motif analysis in full-size ChIP-seq datasets. Nucleic Acids Res. 40, e31. [DOI] [PMC free article] [PubMed] [Google Scholar]
- 14. McLean C. Y., Bristor D., Hiller M., Clarke S. L., Schaar B. T., Lowe C. B., Wenger A. M., and Bejerano G. (2010) GREAT improves functional interpretation of cis-regulatory regions. Nat. Biotechnol. 28, 495–501 [DOI] [PMC free article] [PubMed] [Google Scholar]
- 15. Mehta S., Huillard E., Kesari S., Maire C. L., Golebiowski D., Harrington E. P., Alberta J. A., Kane M. F., Theisen M., Ligon K. L., Rowitch D. H., and Stiles C. D. (2011) The central nervous system-restricted transcription factor Olig2 opposes p53 responses to genotoxic damage in neural progenitors and malignant glioma. Cancer Cell 19, 359–371 [DOI] [PMC free article] [PubMed] [Google Scholar]
- 16. Ligon K. L., Huillard E., Mehta S., Kesari S., Liu H., Alberta J. A., Bachoo R. M., Kane M., Louis D. N., Depinho R. A., Anderson D. J., Stiles C. D., and Rowitch D. H. (2007) Olig2-regulated lineage-restricted pathway controls replication competence in neural stem cells and malignant glioma. Neuron 53, 503–517 [DOI] [PMC free article] [PubMed] [Google Scholar]
- 17. Thomas-Chollier M., Hufton A., Heinig M., O'Keeffe S., Masri N. E., Roider H. G., Manke T., and Vingron M. (2011) Transcription factor binding predictions using TRAP for the analysis of ChIP-seq data and regulatory SNPs. Nat. Protoc. 6, 1860–1869 [DOI] [PubMed] [Google Scholar]
- 18. Sandelin A., Alkema W., Engström P., Wasserman W. W., and Lenhard B. (2004) JASPAR: an open-access database for eukaryotic transcription factor binding profiles. Nucleic Acids Res. 32, D91–D94 [DOI] [PMC free article] [PubMed] [Google Scholar]
- 19. Khachigian L. M., Williams A. J., and Collins T. (1995) Interplay of Sp1 and Egr-1 in the proximal platelet-derived growth factor A-chain promoter in cultured vascular endothelial cells. J. Biol. Chem. 270, 27679–27686 [DOI] [PubMed] [Google Scholar]
- 20. Wang W., Zhou D., Shi X., Tang C., Xie X., Tu J., Ge Q., and Lu Z. (2010) Global Egr1-miRNAs binding analysis in PMA-induced K562 cells using ChIP-Seq. J. Biomed. Biotechnol. 10.1155/2010/867517 [DOI] [PMC free article] [PubMed] [Google Scholar]
- 21. Eid M. A., Kumar M. V., Iczkowski K. A., Bostwick D. G., and Tindall D. J. (1998) Expression of early growth response genes in human prostate cancer. Cancer Res. 58, 2461–2468 [PubMed] [Google Scholar]
- 22. Baron V., De Gregorio G., Krones-Herzig A., Virolle T., Calogero A., Urcis R., and Mercola D. (2003) Inhibition of Egr-1 expression reverses transformation of prostate cancer cells in vitro and in vivo. Oncogene 22, 4194–4204 [DOI] [PubMed] [Google Scholar]
- 23. Virolle T., Krones-Herzig A., Baron V., De Gregorio G., Adamson E. D., and Mercola D. (2003) Egr1 promotes growth and survival of prostate cancer cells. Identification of novel Egr1 target genes. J. Biol. Chem. 278, 11802–11810 [DOI] [PubMed] [Google Scholar]
- 24. Huang R. P., Fan Y., de Belle I., Niemeyer C., Gottardis M. M., Mercola D., and Adamson E. D. (1997) Decreased Egr-1 expression in human, mouse and rat mammary cells and tissues correlates with tumor formation. Int. J. Cancer 72, 102–109 [DOI] [PubMed] [Google Scholar]
- 25. Levin W. J., Press M. F., Gaynor R. B., Sukhatme V. P., Boone T. C., Reissmann P. T., Figlin R. A., Holmes E. C., Souza L. M., and Slamon D. J. (1995) Expression patterns of immediate early transcription factors in human non-small cell lung cancer: the Lung Cancer Study Group. Oncogene 11, 1261–1269 [PubMed] [Google Scholar]
- 26. Calogero A., Lombari V., De Gregorio G., Porcellini A., Ucci S., Arcella A., Caruso R., Gagliardi F. M., Gulino A., Lanzetta G., Frati L., Mercola D., and Ragona G. (2004) Inhibition of cell growth by EGR-1 in human primary cultures from malignant glioma. Cancer Cell Int. 4, 1. [DOI] [PMC free article] [PubMed] [Google Scholar]
- 27. Choi B. H., Kim C. G., Bae Y. S., Lim Y., Lee Y. H., and Shin S. Y. (2008) p21 Waf1/Cip1 expression by curcumin in U-87MG human glioma cells: role of early growth response-1 expression. Cancer Res. 68, 1369–1377 [DOI] [PubMed] [Google Scholar]
- 28. Kim J. W., Kim J. Y., Kim J. E., Kim S. K., Chung H. T., and Park C. K. (2014) HOXA10 is associated with temozolomide resistance through regulation of the homologous recombinant DNA repair pathway in glioblastoma cell lines. Genes Cancer 5, 165–174 [DOI] [PMC free article] [PubMed] [Google Scholar]
- 29. Cibelli G., Policastro V., Rössler O. G., and Thiel G. (2002) Nitric oxide-induced programmed cell death in human neuroblastoma cells is accompanied by the synthesis of Egr-1, a zinc finger transcription factor. J. Neurosci. Res. 67, 450–460 [DOI] [PubMed] [Google Scholar]
- 30. Nair P., Muthukkumar S., Sells S. F., Han S. S., Sukhatme V. P., and Rangnekar V. M. (1997) Early growth response-1-dependent apoptosis is mediated by p53. J. Biol. Chem. 272, 20131–20138 [DOI] [PubMed] [Google Scholar]
- 31. Thyss R., Virolle V., Imbert V., Peyron J. F., Aberdam D., and Virolle T. (2005) NF-κB/Egr-1/Gadd45 are sequentially activated upon UVB irradiation to mediate epidermal cell death. EMBO J. 24, 128–137. [DOI] [PMC free article] [PubMed] [Google Scholar]
- 32. Virolle T., Adamson E. D., Baron V., Birle D., Mercola D., Mustelin T., and de Belle I. (2001) The Egr-1 transcription factor directly activates PTEN during irradiation-induced signalling. Nat. Cell Biol. 3, 1124–1128 [DOI] [PubMed] [Google Scholar]
- 33. Mitchell A., Dass C. R., Sun L. Q., and Khachigian L. M. (2004) Inhibition of human breast carcinoma proliferation, migration, chemoinvasion and solid tumour growth by DNAzymes targeting the zinc finger transcription factor EGR-1. Nucleic Acids Res. 32, 3065–3069 [DOI] [PMC free article] [PubMed] [Google Scholar]
- 34. Min I. M., Pietramaggiori G., Kim F. S., Passegué E., Stevenson K. E., and Wagers A. J. (2008) The transcription factor EGR1 controls both the proliferation and localization of hematopoietic stem cells. Cell Stem Cell 2, 380–391 [DOI] [PubMed] [Google Scholar]
- 35. Ben-Chetrit N., Tarcic G., and Yarden Y. (2013) ERK-ERF-EGR1, a novel switch underlying acquisition of a motile phenotype. Cell Adh. Migr. 7, 33–37 [DOI] [PMC free article] [PubMed] [Google Scholar]
- 36. Gregg J., and Fraizer G. (2011) Transcriptional regulation of EGR1 by EGF and the ERK signaling pathway in prostate cancer cells. Genes Cancer 2, 900–909 [DOI] [PMC free article] [PubMed] [Google Scholar]
- 37. Pagel J. I., and Deindl E. (2011) Early growth response 1: a transcription factor in the crossfire of signal transduction cascades. Indian J. Biochem. Biophys. 48, 226–235 [PubMed] [Google Scholar]
- 38. Seto M., Ohta M., Asaoka Y., Ikenoue T., Tada M., Miyabayashi K., Mohri D., Tanaka Y., Ijichi H., Tateishi K., Kanai F., Kawabe T., and Omata M. (2009) Regulation of the hedgehog signaling by the mitogen-activated protein kinase cascade in gastric cancer. Mol. Carcinog. 48, 703–712 [DOI] [PubMed] [Google Scholar]
- 39. Worden B., Yang X. P., Lee T. L., Bagain L., Yeh N. T., Cohen J. G., Van Waes C., and Chen Z. (2005) Hepatocyte growth factor/scatter factor differentially regulates expression of proangiogenic factors through Egr-1 in head and neck squamous cell carcinoma. Cancer Res. 65, 7071–7080 [DOI] [PubMed] [Google Scholar]
- 40. Rupprecht H. D., Sukhatme V. P., Lacy J., Sterzel R. B., and Coleman D. L. (1993) PDGF-induced Egr-1 expression in rat mesangial cells is mediated through upstream serum response elements. Am. J. Physiol. 265, F351–F360 [DOI] [PubMed] [Google Scholar]
- 41. Mahony S., Benos P. V. (2007) STAMP: a web tool for exploring DNA-binding motif similarities. Nucleic Acids Res. 35, W253–W258 [DOI] [PMC free article] [PubMed] [Google Scholar]
Associated Data
This section collects any data citations, data availability statements, or supplementary materials included in this article.


