

Abstract
Estrogen exerts many effects on the vascular endothelium. Calmodulin (CaM) is the transducer of Ca2+ signals and is a limiting factor in cardiovascular tissues. It is unknown whether and how estrogen modifies endothelial functions via the network of CaM-dependent proteins. Here we show that 17β-estradiol (E2) up-regulates total CaM level in endothelial cells. Concurrent measurement of Ca2+ and Ca2+-CaM indicated that E2 also increases free Ca2+-CaM. Pharmacological studies, gene silencing, and receptor expression-specific cell studies indicated that the G protein-coupled estrogen receptor 1 (GPER/GPR30) mediates these effects via transactivation of EGFR and subsequent MAPK activation. The outcomes were then examined on four distinct members of the intracellular CaM target network, including GPER/GPR30 itself and estrogen receptor α, the plasma membrane Ca2+-ATPase (PMCA), and endothelial nitric-oxide synthase (eNOS). E2 substantially increases CaM binding to estrogen receptor α and GPER/GPR30. Mutations that reduced CaM binding to GPER/GPR30 in separate binding domains do not affect GPER/GPR30-Gβγ preassociation but decrease GPER/GPR30-mediated ERK1/2 phosphorylation. E2 increases CaM-PMCA association, but the expected stimulation of Ca2+ efflux is reversed by E2-stimulated tyrosine phosphorylation of PMCA. These effects sustain Ca2+ signals and promote Ca2+-dependent CaM interactions with other CaM targets. Consequently, E2 doubles CaM-eNOS interaction and also promotes dual phosphorylation of eNOS at Ser-617 and Ser-1179. Calculations using in-cell and in vitro data revealed substantial individual and combined contribution of these effects to total eNOS activity. Taken together, E2 generates a feedforward loop via GPER/GPR30, which enhances Ca2+/CaM signals and functional linkage in the endothelial CaM target network.
Keywords: calmodulin (CaM), estrogen, estrogen receptor, nitric-oxide synthase, plasma membrane calcium-transporting ATPase 4 (ATP2B4), GPER/GPR30, endothelial nitric-oxide synthase, estrogen receptor alpha
Introduction
Estrogen has numerous effects in the vascular endothelium that are linked to the protection of cardiovascular functions (1). At the cellular level, estrogen exerts its effects via three known receptors. Estrogen receptors α (ERα)3 and β (ERβ) function as transcription factors that regulate gene expression (2). Estrogen also has rapid actions not fully explained by activities of ERα or ERβ, such as intracellular Ca2+ mobilization, cAMP production, and phosphorylation. The G protein-coupled estrogen receptor 1 (GPER/GPR30) is associated with many rapid, pregenomic effects of estrogen (3, 4) and also genomic effects, including up-regulation of genes like c-fos (5) and cyclin A and D1 (6, 7), and fatty acid synthase (8). Since its recognition as a GPCR sensitive to estrogen (9, 10), GPER/GPR30 has received significant attention (4). Nevertheless, its mode of actions and regulatory inputs are not entirely clear (3).
Calmodulin (CaM) is the ubiquitous transducer of intracellular Ca2+ signals. CaM possesses four binding sites that interact cooperatively with Ca2+, leading to conformational changes that cause Ca2+-CaM complexes to interact with target proteins (11). Many proteins also interact with CaM in a Ca2+-independent manner (12). Hydrophobic pockets and a flexible interlobar tether make CaM promiscuous in interacting with its targets, estimated to reach 300 proteins (13). The specificity of CaM interactions with its targets is dictated by affinities, Ca2+ sensitivity, and abundance in expression levels, among other factors (14). Despite its universal requirement, CaM is insufficiently expressed for its targets. Up to 60% of total cellular CaM is involved in inseparable interactions (15), which dramatizes the shortage of available CaM for target interactions. In smooth muscle cells, it was estimated that only 5% of total CaM is freely available (16). CaM is limiting in endothelial cells, and competition between CaM-dependent proteins for limiting CaM generates functional coupling and allows dominant CaM-binding proteins to shape the time courses of other CaM-dependent activities (17, 18). Limiting CaM conditions have also been demonstrated in HEK293 cells, cardiomyocytes, and neurons (19–22).
It is not known whether and how estrogen affects endothelial cell functions through the network of CaM-binding proteins. Given the ubiquitous role of CaM in signaling and its limiting nature, factors that regulate CaM expression and linkage among CaM targets probably affect tissue functions substantially. Here, we used multiple approaches to identify the effects of 17β-estradiol (E2) on total and free cellular CaM levels in endothelial cells, the estrogen receptor responsible for these effects and the underlying mechanisms, the resultant changes in interactions between CaM and four distinct CaM targets, and the associated functional impact. The targets examined include ERα, the novel CaM target GPER/GPR30, the plasma membrane Ca2+-ATPase (PMCA), and endothelial nitric-oxide synthase (eNOS). We demonstrate that E2 generates a feedforward mechanism involving GPER/GPR30 that enhances Ca2+/CaM signals and functional linkage in the CaM network in vascular endothelial cells.
Experimental Procedures
Cell Culture and Isolation
Primary porcine aortic endothelial cells (PAECs) were obtained as described previously (23–26). Briefly, the descending portions of thoracic aortas were freshly isolated from a local slaughterhouse. After removal of perivascular adipose tissues, the aortas were dissected, and the intima was mechanically collected using a sterile scalpel. The cell pellets were resuspended in phenol red-free M199 medium (Caisson Laboratories, Logan, UT) containing 20% newborn calf serum (Fisher) and 1% penicillin-streptomycin (MP Biomedicals, Solon, OH) and plated on culture dishes until a monolayer of typical endothelial morphology was obtained. This approach consistently yields highly pure populations of primary endothelial cells, with >95% purity. In our pilot studies, the use of phenol red-containing medium affected the primary findings, whereas there was no difference between charcoal-stripped and regular sera (newborn calf or fetal bovine sera), despite a much slower growth rate in cells cultured using charcoal-stripped sera. All cells were thus cultured in phenol red-free medium containing regular sera. PAECs were used between passages 1 and 2. Human embryonic kidney 293 (HEK293) and SKBR3 cells (ATCC) were cultured in phenol red-free DMEM containing 10% fetal bovine serum (Fisher). Cells were cultured in a 37 °C incubator with 5% CO2 humidified air. The medium was frequently renewed.
Molecular Biology
Amino acid substitutions in the CaM-binding domains of GPER/GPR30 in SMD2, -3, -4, or a combination thereof (Table 1) were introduced into full-length GPER/GPR30 using custom gBlock gene fragments (Integrated DNA Technologies, Coralville, IA) between the SbfI and NotI restriction sites in a pEZ plasmid encoding human GPER/GPR30 (Genecopoeia Inc.). The mutant CaM-binding sequences were PCR-amplified and incorporated as inserts between the KpnI and AgeI restriction sites located between a “citrine” version of enhanced yellow fluorescent protein (EYFPC) and enhanced cyan fluorescent protein (ECFP) framework of previously reported FRET-based biosensors for GPER/GPR30 (27). We term these biosensors BSGPERx, where x denotes the amino acid numbering of the insert sequences. The resultant biosensors were BSGPER150–175mut, BSGPER242–259mut, and BSGPER330–351mut, corresponding to the CaM-binding sequences in GPER/GPR30 SMD2, -3, and -4. The primers for these reactions are presented in Table 2. The biosensors were incorporated in a pET bacterial expression vector, as described previously (27). All constructs were verified by DNA sequencing (University of Missouri, Columbia, MO).
TABLE 1.
Wild-type and mutant sequences of the GPER/GPR30 CaM-binding sequences in SMD2, -3, and -4 to change hydrophobicity and charges
Substitutions are in italic type and underlined.
| Domain | Wild-type sequence | Mutant sequence |
|---|---|---|
| 150–175 | WMSFDRYIALARAMRCSLFRTKHHAR | WMSADQAIALAQAMQCSLAQTQHQAR |
| 242–259 | VRAHRHRGLRPRRQKALR | VQAHQHQGLQPRQQKALR |
| 330–351 | TFRDKLRLYIEQKTNLPALNRF | TAQDKLQLAIEQQTNGPAGNRF |
TABLE 2.
Primers for inserts of FRET biosensors encompassing mutant CaM-binding sequences in GPER/GPR30 SMD2, -3, and -4
| Domain | Sense primer | Antisense primer |
|---|---|---|
| 150–175 | CTCGGGTACCGCGATGAGCGCCGACC | CTCGACCGGTCCGGGCCTGGTGCTG |
| 242–259 | CTACCGGTGCGGAGCGCTGCCTGCGCCCGTGGCGCTCCTC | CTGGTACCGTCAGGGCGCACGCGCACGCTGGAGGAGCGCC |
| 330–351 | CTCGGGTACCACCGCCCAGGACAAGC | CTCGACCGGTCACGGCACTGCTGAAC |
Quantitative RT-PCR
Total mRNA was isolated using an RNeasy minikit (catalog no. 74104, Qiagen) and SpinSmart total RNA mini purification kit (catalog no. CM-61050, Denville Scientific). Reverse transcription was performed at 100 ng/μl RNA using the High Capacity cDNA reverse transcription kit (catalog no. 4368814, Applied Biosystems). For real-time PCR, each reaction included 5 μl of cDNA (1:20 dilution from RT reaction yield), 8.5 μl of SYBR Green (catalog no. 1725122, Bio-Rad), 2.5 μl of nuclease-free H2O, and 1 μl of 5 μm forward and reverse primer mixture. All reactions were seeded in triplicates for each sample onto a 96-well plate (catalog no. HSP9655, Bio-Rad) sealed with a clear cover (catalog no. MSB1101, Bio-Rad). After brief centrifugation of the plates, quantitative PCR was run on a Chromo4 real-time system (Bio-Rad) with the following sequence: 3-min initiation at 98 °C, followed by 60 cycles of 15-s denaturation at 98 °C, 30-s annealing at 60 °C, and 30-s extension at 72 °C. A melt curve was subsequently performed for all reactions to ensure single amplicon yield by the corresponding primers, with a 0.5 °C ramp/5 s, from 60 to 98 °C. Primers were designed using NCBI Primer Blast. Porcine CALM1 gene was used for CaM, and HMBS (hydroxymethylbilane synthase) was used as the reference gene. The primers and relevant details are listed in Table 3. Efficiencies for both primer pairs were determined from standard curves generated by quantitative PCR. Average data from triplicate curves up to 20% of fractional fluorescence were fit to the exponential equation.
TABLE 3.
Properties of primers for porcine CALM1 and HMBS in quantitative RT-PCRs
| Gene | Accession no. | Sense primer | Antisense primer | Exon junctions spanned | Amplicon size |
|---|---|---|---|---|---|
| bp | |||||
| CALM1 | NM001244210.1 | TGACAAGGATGGCAATGGCT | CGTAGTTGACTTGTCCATCTCCA | 4–5 | 140 |
| HMBS | NM001097412 | CTTGCCAGAGAAGAGTGTGGT | GTGTGTTGAGGTTTCCCCGA | 7–9 | 110 |
Crossing points (CPs) were determined as x values corresponding to y = 0.1 on fitted curves. ΔCP values for CaM were corrected for corresponding values of HMBS, and induction of CaM mRNA was expressed as -fold change based on the mathematical model by Pfaffl (28),
 |
where R is the -fold change in CaM mRNA, and ECaM and EHMBS are efficiencies of the primer pairs for CaM and HMBS, respectively.
Transfection
Transfection of GPER/GPR30 antisense and scrambled oligonucleotides was carried out using the Transit-Oligo transfection kit (Mirus LLC). pEZ plasmids encoding wild-type and mutant GPER/GPR30 containing mutations in one or more of its CaM-binding domains were transfected into HEK293 cells using the Transit-LT1 transfection kit (Mirus LLC). Transfection of the pCDNA3.1 plasmid encoding the CaM biosensor BSCaM2 (17, 18, 20, 29–31) into primary PAECs was performed using a Nucleofector II-S transfection system (Lonza Inc., Walkersville, MD).
Antibodies
Mouse monoclonal anti-CaM antibody was obtained from EMD Millipore (05-173MI). Rabbit polyclonal anti-GPER/GPR30 antibodies were from GeneTex (GTX100001) and Santa Cruz Biotechnology, Inc. (H-300, sc-134576, and N-15, sc-48525-R). Mouse anti-PMCA antibody (clone 5F10) was from Pierce (MA3-914). Anti-phosphotyrosine antibody (clone PY20) was from Fisher (catalog no. BP-2672100). Antibodies against total eNOS and anti-phospho-Ser-617 were from Abcam (catalog nos. ab73980 and ab138458). Antibodies for phospho-Thr-497 and phospho-Ser-1179 were from Cell Signaling Technology (Danvers, MA) (catalog nos. 9574 and 9570). Antibody for ERα was from Pierce (MA1-310). Antibodies for ERβ and Gβγ were from Santa Cruz Biotechnology (sc-8974 and sc-393055). Antibody for β-actin was from Thermo Scientific (RB9421P1). Anti-vinculin antibody was from Sigma-Aldrich (V-4505). Rabbit anti-phospho-ERK1/2 and anti-ERK1/2 antibodies were purchased from Thermo Scientific. Anti-annexin V and anti-calreticulin antibodies were from Cell Signaling Technology (catalog nos. 8555S and 2851S).
Agonists and Antagonists
Water-soluble estrogen, DPN, ICI182,780, and AG-1478 were purchased from Sigma-Aldrich. G-1 and PPT were purchased from Tocris Bioscience. PD-98059 was from R&D Systems.
GPER/GPR30 Gene Silencing
GPER/GPR30 knockdown was performed as described previously (23), using an antisense oligonucleotide directed against the porcine GPER/GPR30 sequence. A control oligonucleotide was randomly scrambled from the antisense sequence. The efficiency of this approach has been carefully validated previously using immunoblotting of total cell lysate and immunofluorescence in single cell imaging experiments (23).
Simultaneous Measurement of Free Intracellular Ca2+ and Ca2+-CaM Concentrations
Primary PAECs transfected with BSCaM2 were treated with or without E2 for 48 h. Cells were then loaded with 4 μm indo-1/AM for 30 min at 37 °C. BSCaM2 and indo-1 excitation was alternated between λ430 nm and λ340 nm for 50 ms per 500-ms cycle through sputtered excitation filters housed in a Lambda-DG4 illuminator (Sutter Instrument Co.) with a 1-ms switching interval between wavelengths. Emission lights were passed through a custom 410/30M/460LP polychroic beam splitter (Chroma Technology Inc.) and selected through sputtered bandpass filters of λ480 and λ535 nm for BSCaM2, and λ405 and λ485 nm for indo-1, housed in a Lambda-10 filter switcher (Sutter Instrument) with switching intervals of 40 ms between wavelengths. Filtered emission lights were then collected via an Andor DU-885 EMCCD camera. Data were processed by Imaging Workbench version 6.1 software (INDEC Biosystems). Rmin values for indo-1 were obtained similarly to fura-2 described earlier (23). Rmin values for BSCaM2 were obtained similarly, because the interaction between CaM and BSCaM2 is strictly Ca2+-dependent. To obtain Rmax values of both indo-1 and BSCaM2, 50 μm β-escin was added at the end of each experiment to permeabilize cells in the presence of saturating concentrations of Ca2+ and CaM. Using these values, free Ca2+ and Ca2+-CaM concentrations were calculated as described earlier (17, 18).
Co-immunoprecipitation and Western Blotting
Following treatment and cell lysis, protein content was determined using BCA assay (Pierce) performed in triplicate for all samples, with a standard curve generated for every determination, and the protein content for each sample was determined based on the average of the triplicate. Co-immunoprecipitation was performed using protein A/G beads as per the manufacturer's instructions (Fisher). Three milligrams of cellular proteins were then rocked with protein A/G beads overnight at 4 °C prior to centrifugation and collection of supernatant. For regular Western blotting, all lanes in each gel were loaded with equal amounts of total proteins, adjusted for detectability with each antibody. After electrophoresis and transfer, membranes from coimmunoprecipitation samples were separated between the levels of the bait and the prey proteins prior to incubation with specific primary antibodies. For immunoblots assessing protein expression levels, when possible, antibodies recognizing the protein of interest and the housekeeping protein were mixed on the same membrane fragment in a “double primary” approach to show both proteins on the same development. Otherwise, membranes were cut between the levels of the protein of interest and the housekeeping protein, and fragments of the same membranes were probed separately with the respective antibodies. Following secondary antibody treatment, membrane fragments were developed using enhanced chemiluminescence (Thermo Scientific) and detected with film (Hyblot, Denville Scientific). To ensure linearity of the protein bands in analyses, multiple film exposures were taken to avoid either overexposure or underexposure. For co-immunoprecipitation data, densitometric values of the baits were corrected for those of the preys calculated using the rectangular volume tool in the Image Lab version 5.0 software (Bio-Rad). For protein expression blots, densitometric values of the protein of interest were used and normalized against control values, based on equal BCA-based inputs at the front end; nevertheless, matching blots of a housekeeping protein were shown alongside in all cases.
Measurement of PMCA Activity
PMCA activity was measured in PAECs as described previously (23), with slight modifications. Cells were plated on number 1.5 glass coverslips and grown to subconfluence. Following treatment, cells were loaded with 4 μm fura-2/AM for 30 min at 37 °C. After removal of fura-2/AM, cells were equilibrated at room temperature in modified Tyrode's buffer (150 mm NaCl, 2.7 mm KCl, 1.2 mm KH2PO4, 1.2 mm MgSO4, 10 mm HEPES, 1 mm CaCl2, pH 7.4) for 15 min. Fura-2 was excited at λ340 nm and λ380 nm for 50 ms per 500-ms cycle using the system described under “Simultaneous Measurement of Free Intracellular Ca2+ and Ca2+-CaM Concentrations.” The ratio of emission intensities following excitation at λ340 nm and λ380 nm was used to calculate the free Ca2+ concentration using the equation,
 |
where the Kd value is 224 nm; R is the observed ratio fluorescent signal during the experiment. Sf and Sb are the emission intensities collected at λ510 nm corresponding to the Ca2+-free and Ca2+-bound states, respectively. To minimize interexperiment variance, Rmax and Rmin were obtained for individual cells in every experiment, as described in detail previously (23). After post-loading equilibration, thapsigargin (1 μm) was added in Ca2+-free buffer to deplete the estrogen receptor. Extracellular Na+ was then replaced by equimolar N-methyl-glucamine to prevent the Na+-Ca2+ exchanger. Ca2+ entry was then initiated by adding 1.5 mm CaCl2. When peak influx was reached, extracellular Ca2+ was removed in the presence of 5 mm BAPTA. The rate of reduction in intracellular Ca2+ concentration now mainly reflected Ca2+ extrusion via the PMCA and was determined by fitting the time course of the apparent free Ca2+ concentration to the monoexponential equation, y = y0 + Ae−x/t. Extrusion rates of Ca2+ are presented as relaxation times (τ). Because the activity of PMCA is Ca2+-dependent, comparisons were made only among cells in which free Ca2+ concentrations at the beginning of the Ca2+ extrusion time course were in the same ranges (17, 18, 23). Relative PMCA activity was expressed as the inverse of the relaxation time.
Expression and Purification of Proteins
pET plasmids encoding FRET-based biosensors and CaM were expressed in BL21(DE3) competent cells. Biosensors and CaM were purified using affinity chromatography as described in detail previously (27).
Determination of CaM Binding Affinities of Mutant Biosensors
Biosensors containing mutations in the CaM-binding domains of GPER were tested for CaM binding at 22 °C using a QuantaMasterTM-40 spectrofluorometer (Photon Technology International Inc.) as described previously (27) with modifications for mutant biosensors that require large amounts of CaM for saturation. Mutant BSGPERx (0.5 μm) was mixed in a quartz cuvette (Hellma Analytics) containing a titration buffer (25 mm Tris, 100 mm KCl, pH 7.5, 0.1 mg/ml BSA) and an appropriate amount of Ca2+ sufficient to saturate the maximal amount of Ca2+ binding sites on titrated CaM. CaM was titrated in the mixture as biosensor emission spectra were monitored from 460 to 560 nm in response to ECFP excitation at 430 nm. We defined positive interaction between CaM and BSGPERx based on three diagnostic criteria: 1) an increase in ECFP emission, 2) a corresponding decrease in EYFPC emission, and 3) a crossing of emission spectra from CaM-free versus CaM-added conditions at the isoemissive point of 510 nm. From these spectral data, fractional biosensor responses (BSfract) upon CaM addition were calculated using the formula,
 |
where Rmin and Rmax are the ratios between emission intensities at 476 and 528 nm (F476/F528) when the biosensor is in unbound and maximally bound states, respectively. For reactions that required a large concentration of CaM to saturate biosensor responses, to avoid dilution effects, titrations were successively carried out in identical single cuvettes containing initially a fixed concentration of biosensor in titration buffer and a different concentration of CaM in the presence of an appropriate concentration of 1,2-bis(o-aminophenoxy)ethane N,N,N′,N′-tetraacetic acid to essentially prevent any Ca2+-dependent CaM interaction with the biosensor. Following measurement of biosensor emission spectra in the Ca2+-free condition, reactions were initiated by the addition of saturating Ca2+ (sufficient to saturate all Ca2+ binding sites in the amount of CaM added) using high concentration Ca2+ stock. Biosensor ratios from individual measurements upon the addition of saturating Ca2+ were normalized against the respective initial biosensor ratio obtained prior to the addition of Ca2+. Normalized biosensor ratios were then used to obtain biosensor fractional responses, using Equation 1. Because most mutant biosensors bind CaM with fairly low affinities, apparent Kd values for mutant biosensor and CaM interactions were obtained by fitting the biosensor's fractional responses as a function of CaM to the quadratic equation,
 |
where BSfract, [BS], and [CaM] are the fractional response of BSGPERx and total concentration of biosensor and CaM in the mixture, respectively.
Ca2+ sensitivity of biosensor-CaM interactions was determined as described previously (27), with Mag-indo1 used in place of XRhod-5F for a number of reactions where the EC50(Ca2+) values of CaM-biosensor interactions were initially observed to be substantially higher than the Kd values for XRhod-5F. EC50(Ca2+) values for biosensor-CaM interactions were obtained by fits of fractional saturation-free Ca2+ relationships to Equation 4, where n is the Hill coefficient.
 |
Statistical Analysis
Data are expressed as means ± S.E. Statistical analysis was done using Student's t test, assuming unequal variances between control and treated groups. Statistical significance was determined at p < 0.05.
Results
E2 Increases Total CaM and Free Ca2+-CaM in Endothelial Cells
CaM expression is limiting in the endothelium and other cardiovascular tissues. To examine the effect of E2 on CaM expression, we used primary porcine aortic endothelial cells (PAECs) freshly isolated and cultured until subconfluence. These cells have been used frequently to investigate endothelial biology (23, 26, 32–35). Primary PAECs were treated with vehicle or various doses of E2 for 48 h, followed by immunoblotting for β-actin and CaM. E2 dose-dependently increased CaM expression, with maximal effect at 5 nm E2 (Fig. 1A). Because most cellular CaM is engaged in inseparable interactions (15), up-regulated total CaM may not be associated with increases in free Ca2+-CaM available for dynamic interactions. Because Ca2+-CaM signals are dictated by both the initial Ca2+ signals and available CaM, it was important to measure simultaneously both free Ca2+ and Ca2+-CaM levels. To assess the effect of E2 on free Ca2+-CaM levels, we transfected PAECs with BSCaM2, a genetically coded FRET-based biosensor for Ca2+-CaM (17, 18, 20, 30, 31). Cells were then exposed to 5 nm E2 for 48 h, followed by loading with 4 μm indo-1/AM. Fig. 1B shows indo-1 fluorescence in a group of PAECs (top left), with ∼40% expressing BSCaM2 (top right). Only cells expressing BSCaM2 and loaded with indo (Fig. 1B, merged image, bottom) were chosen for dual imaging. Free Ca2+ and Ca2+-CaM signals were then concurrently monitored, with a typical time course shown in Fig. 1, C (indo-1) and D (BSCaM2) (see description under “Experimental Procedures”). To avoid interexperimental variability in BSCaM2 expression levels, which could complicate the interpretation due to buffering effects, care was taken to compare cells with similar BSCaM2 fluorescent intensities in unstimulated, basal conditions. E2 treatment significantly increased the average free Ca2+-CaM signal stimulated by ionomycin (Fig. 1E). The plot of free Ca2+-CaM as a function of Ca2+ during the influx and extrusion phases shows increased Ca2+-CaM complexes in E2-treated cells (Fig. 1F).
FIGURE 1.

Estrogen up-regulates total and free CaM expression. A, dose-dependent effect of E2 on total CaM expression in PAECs. Immunoblot, β-actin, and CaM were simultaneously probed on the same SDS-PAGE membranes from lysate of PAECs treated with the specified doses of E2 or vehicle for 48 h. Histogram, average (n = 8) relative densitometric values of the CaM bands. *, p < 0.05 versus control values. B, representative epifluorescence images of indo-1 (top left) and BSCaM2 (top right) and merged image (bottom) in a group of PAECs transfected with BSCaM2, treated with 5 nm E2 for 48 h, and loaded with indo-1/AM. C and D, typical time courses of an experiment simultaneously measuring indo-1 (C) and BSCaM2 signals (D). E, free Ca2+-CaM in cells treated with vehicle (black circles) or 5 nm E2 (red circles) for 48 h. Data are representative of n = 48 cells (five experiments). F, plots of free Ca2+-CaM concentration as a function of free Ca2+ concentration in cells treated with vehicle (black circles) or 5 nm E2 (red circles) for 48 h. Squares, average free Ca2+-CaM values binned over a 100 nm Ca2+ range across the respective average Ca2+ points in control (black) versus E2-treated cells (red). n = 48 cells from six experiments.
GPER/GPR30 Mediates the Effect of E2 to Up-regulate CaM Expression
To date there are three known receptors for estrogen: ERα, ERβ, and GPER/GPR30. To begin identifying the specific receptor(s) responsible for the E2 effect of up-regulating CaM, primary PAECs were exposed to different doses of PPT, DPN, and G-1 for 48 h to specifically stimulate ERα (EC50 = 200 pm), ERβ (EC50 = 0.85 nm), and GPER/GPR30 (EC50 = 11 nm), respectively. ICI182,780 is a nonselective ERα/ERβ antagonist (IC50 0.29 nm) and is also a GPER/GPR30 agonist (4, 9), which represents a useful tool to identify the responsible receptor. Fig. 2 shows the total CaM expression levels from cells treated with PPT (Fig. 2A), DPN (Fig. 2B), G-1 (Fig. 2C), and ICI182,780 (Fig. 2D). Only G-1 up-regulated total CaM. Interestingly, ICI182,780 also increased CaM expression, with the maximal effect at 20 μm even higher than that produced by 5 nm E2 (Fig. 2D). These data suggest that GPER/GPR30 may mediate the E2 effect of up-regulating CaM expression. To assess the specificity of the effect of G-1 on CaM, effects of G-1 were examined on two other Ca2+-binding proteins, including annexin V and calreticulin. Treatment with different doses of G-1 for 48 h did not affect expression levels of either protein (Fig. 2, E and F).
FIGURE 2.

Effects of agonists of ERα (PPT; A), ERβ (DPN; B), GPER/GPR30 (G-1; C), and dual ERα/ERβ antagonist/GPER/GPR30 agonist (ICI182,780; D) on total CaM expression and effects of GPER/GPR30 agonist G-1 on expression of annexin V (E) and calreticulin (F) in PAECs. Primary PAECs were treated with the specified doses of the respective agonists for 48 h prior to lysis, followed by simultaneous immunoblotting of β-actin and CaM on the same membranes. SDS-PAGE membranes for annexin V and calreticulin were cut between the levels for these proteins and vinculin, followed by simultaneous immunoblotting as indicated. Data are averages from n = 6 for A–D and n = 3 for E-F; *, p < 0.05.
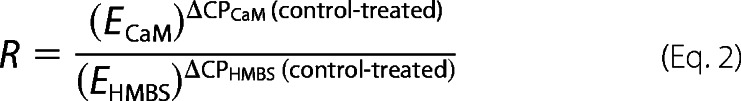
To more specifically confirm the role of GPER/GPR30, we tested the effect of E2 on CaM expression in PAECs in which GPER/GPR30 has been knocked down. Primary PAECs were transfected with scrambled or antisense oligonucleotides directed against porcine GPER/GPR30 sequence for 32 h as described previously (23), followed by 48-h treatment with vehicle or 5 nm E2. Fig. 3A shows the effects of scrambled and antisense oligonucleotides on GPER/GPR30 expression, with ∼65% silencing efficiency. Treatment with E2 for 48 h increased total CaM expression by ∼5.5-fold in PAECs transfected with scrambled oligonucleotide, consistent with the data in Fig. 1A, but only increased CaM expression in GPER/GPR30 antisense-transfected cells by 1.8-fold, equivalent to a 68% reduction in the effect to up-regulate CaM expression (Fig. 3B).
FIGURE 3.
Effect of GPER/GPR30 gene silencing on the E2 effect of up-regulating CaM and the effect of E2 on CaM in ERα(−)/ERβ(−) SKBr3 cells. A, primary PAECs were transfected with vehicle (MOCK), scrambled oligonucleotide (SCR), or antisense oligonucleotide (AS) directed against porcine GPER/GPR30. Following lysis and SDS-PAGE, fragments of the same membranes were probed separately for GPER/GPR30 (bottom immunoblot) or vinculin (top immunoblot). Histogram, average ratios (n = 4) of densitometric values of the GPER/GPR30 bands over those of the corresponding vinculin bands. B, primary PAECs transfected as in A were treated with vehicle or 5 nm E2 as indicated for 48 h prior to lysis. Fragments of the same SDS-PAGE membranes were probed for β-actin (top blot) and CaM (bottom blot). Histogram, average ratios (n = 4) of the densitometric values of the CaM bands over those of the corresponding β-actin bands. *, p < 0.05 versus values in mock-transfected cells; Φ, p < 0.05 versus values in scrambled oligonucleotide-transfected cells. C, estrogen receptor profiles in PAECs and SKBr3 cells. 40 μg of total lysate from primary PAECs or SKBr3 cells were probed for ERα, ERβ, and GPER/GPR30 (n = 3). D, effect of E2 on total CaM expression in SKBr3 cells. Cells were treated with the specified doses of E2 for 48 h before lysis. β-Actin (top blot) and CaM (bottom blot) were probed from separated fragments of the same SDS-PAGE membranes. Histogram, average ratio (n = 4) of densitometric values of CaM over those of β-actin. *, p < 0.05 versus control value.
To further confirm the role of GPER/GPR30 in mediating the effect of E2 to up-regulate CaM expression, we tested the effect of E2 on SKBr3 cells, a cell type known to express only GPER/GPR30 and not ERα or ERβ (9, 36). Lysate of PAECs and SKBr3 cells were first probed for all three receptors to verify their expression profiles. Primary PAECs expressed all three receptors, whereas SKBr3 cells only expressed GPER/GPR30 (Fig. 3C). SKBr3 cells were then subjected to E2 treatment for 48 h, which dose-dependently up-regulated total CaM expression (Fig. 3D). Together, these data strongly indicate that GPER/GPR30 mediates the E2 effect of up-regulating CaM expression.
GPER/GPR30 Up-regulates CaM mRNA via Transactivation of EGFR and MEK1
Having demonstrated that GPER/GPR30 is the key receptor responsible for the effect of E2 to up-regulate CaM, we sought to examine the underlying mechanism. GPER/GPR30 activation has been shown to transactivate EGFR via the release of the membrane-tethered HB-EGF and subsequent activation of MAPK (37, 38). This mechanism was shown to be responsible for a number of genomic effects of GPER/GPR30 activation, such as up-regulating the expression of c-fos, cyclin A and D1, and fatty acid synthase (5–8). We hypothesized that a similar mechanism could account for the effects of GPER/GPR30 to up-regulate CaM expression at the transcriptional level. We thus tested the effects of AG-1478 and PD-98059, specific inhibitors of EGFR and MEK1, on the effect of G-1 to induce CaM mRNA, using quantitative RT-PCR. Primary PAECs were treated with vehicle; various doses of AG-1478, PD-98059, and G-1 alone or in combination for 48 h prior to lysis; and total RNA extraction. Fig. 4A shows the fractional fluorescence of the titration curves for the primers of the porcine CALM1 gene (see “Experimental Procedures” and Table 3). Fig. 4 (B and C) shows exponential fits of up to 20% of fractional data in Fig. 4A and the residual of a representative fit. Fig. 4D shows the average melt curves following the experiment in Fig. 4A, demonstrating a single product using the CaM primer set. Similar data were obtained for the reference gene HMBS (not shown). Using this system, inhibition of EGFR with AG-1478 caused insignificant changes in CaM mRNA. Stimulation of GPER/GPR30 for 48 h was associated with a ∼2-fold up-regulation in CaM mRNA, and AG-1478 prevented the effect of G-1 (Fig. 4E). Similarly, inhibition of MEK1 using PD-98059 caused insignificant changes in CaM mRNA at the doses tested but significantly prevented the up-regulation in CaM mRNA induced by treatment with G-1 (Fig. 4F). These data are consistent with the idea that GPER/GPR30 activation up-regulates CaM expression at the transcriptional level via transactivation of EGFR and subsequent activation of the MAPK cascade in vascular endothelial cells.
FIGURE 4.

CaM mRNA induction by G-1 and effects of EGFR inhibitor AG-1478 or MEK1 inhibitor PD-98059. A, fractional fluorescence data from quantitative RT-PCRs using the CaM primer set (Table 3) with specified dilutions of cDNA reverse-transcribed from a control sample of PAECs. Curves are averages of triplicates. B, exponential fits of fractional data up to 20% saturation of the responses from A. CP values were determined as x values corresponding to y = 0.1 (dotted horizontal line) on fitted data, which were used to calculate the efficiency of the primer set. C, representative residuals of a fit from B. D, melt curves following quantitative RT-PCRs in (A) showing no shoulder in the rapid melt phase, indicating single size population of CaM quantitative PCR products. E and F, induction of CaM mRNA by G-1 and effects of EGFR inhibitor AG-1478 (E) or MEK1 inhibitor PD-98059 (F). Primary PAECs were treated with the specified doses of G-1 and/or AG-1478 (E) or PD-98059 (F) for 48 h before mRNA isolation. Following quantitative RT-PCR, ΔCPs for CaM were corrected for corresponding values of the reference gene HMBS, and relative CaM mRNA changes were expressed as -fold change as described under “Experimental Procedures.” *, p < 0.05 from vehicle-treated samples; **, p < 0.05 from G-1-treated samples (n = 8).
E2 Enhances CaM Binding to Both ERα and GPER/GPR30
Given the limiting nature of CaM in the endothelium (17, 18), the observed effect of E2 to up-regulate total and free CaM is probably of broad impact on many CaM target proteins. We thus decided to test this idea by examining a number of CaM targets with different affinities for CaM. Among the known receptors for estrogen, ERβ does not interact with CaM, whereas estrogen receptor ERα is well known to be regulated by Ca2+-dependent CaM interaction with nanomolar affinity (39). CaM binding to ERα enhances the receptor's stability, dimerization, and transcriptional activities (40–42). We recently showed that CaM interacts with GPER/GPR30 at four sites located separately in the receptor's four submembrane domains (SMDs) with disparate affinities and Ca2+ sensitivities (27). In biosensor formats, these domains interact with CaM with submicromolar or low micromolar affinities. In-cell studies and Ca2+ sensitivity data indicated that GPER/GPR30-CaM interaction can occur at resting Ca2+ levels in cells (27). It is completely unknown whether E2 can affect the activities of its own receptors via changes in CaM binding. Thus, primary PAECs were exposed to vehicle or 5 nm E2 for 48 h. Cells were subsequently treated with 2 μm ionomycin in the presence of 1 mm extracellular Ca2+ for 3 min prior to lysis for analyses of receptor expression and interaction with CaM. The use of ionomycin was to guarantee that the Ca2+ signals produced in cells were not influenced by potential effects on agonist-induced Ca2+ entry that E2 might have. E2 did not change the expression of either receptor (Fig. 5, A and B) but significantly enhanced the association of CaM with both ERα (Fig. 5C) and GPER/GPR30 (Fig. 5D). CaM immunoblots from the same lysate confirmed CaM up-regulation in cells exposed to E2 (Fig. 5E).
FIGURE 5.

Effects of E2 on estrogen receptor expression and interactions with CaM. Primary PAECs were treated with vehicle or 5 nm E2 for 48 h prior to lysis. A and B, primary PAECs were treated with vehicle or E2 as indicated for 48 h. Following SDS-PAGE, membranes were probed simultaneously for β-actin and ERα (A) or GPER/GPR30 (B). Histograms, average (n = 4) relative ERα and GPER/GPR30 expression levels. C and D, following treatment, PAECs were treated with 2 μm ionomycin before immunoprecipitation of ERα (C) and GPER/GPR30 (D). SDS-PAGE membranes were cut to separate fragments that corresponded with ERα (66 kDa) and CaM (16.7 kDa), which were subsequently probed separately for ERα and CaM (C) or GPER/GPR30 and CaM (D). Histograms, average (n = 6) ratios between the densitometric values of the CaM bands to the corresponding values of the ERα or GPER/GPR30 bands. E, immunoblot from the same lysate from the samples in C and D, confirming changes in total CaM expression.
CaM Binding Promotes GPER/GPR30 Function
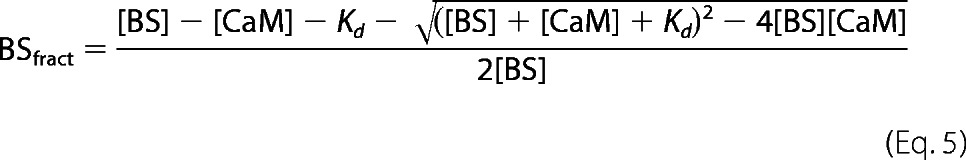
For the two estrogen receptors that interact with CaM, ERα, and GPER/GPR30, the functional role of ERα-CaM interaction has been well documented through many studies (40, 42–44); however, the functional effect of CaM-GPER/GPR30 association (27) is not known. The likelihood that CaM promotes GPER/GPR30 function is important in that GPER/GPR30 itself mediates the E2 effect of up-regulating total and free CaM expression (Figs. 1–3). Because CaM interacts with GPER/GPR30 at four separate domains on the receptor, we generated mutations in the higher affinity CaM-binding domains, amino acids 150–175, 242–259, and 330–351, located on GPER/GPR30 submembrane domains 2, 3, and 4, to alter their hydrophobicity and charge properties (Table 1). We recently developed a biosensor approach to identify these CaM-binding sites and characterized their binding properties (27). We decided to utilize this technique to verify modifications in CaM binding properties of the mutant sequences. Fig. 6A encapsulates the biosensor principle. A CaM-binding domain is inserted between donor ECFP and acceptor EYFPC. In the unbound state, fluorescent resonance energy transfer (FRET) is robust between ECFP and EYFPC due to the proximity between the donor and acceptor fluorophores (Fig. 6A (i)). Upon interaction with CaM, conformational changes in the insert sequence disrupt FRET, increasing ECFP emission while decreasing that of EYFPC (Fig. 6A (ii)). Fig. 6A (iii) shows typical biosensor responses in the unbound and bound states. We used three diagnostic criteria for positive CaM binding: 1) increased ECFP emission, 2) a reciprocal decrease in EYFPC emission, and 3) crossing of the spectra at the isoemissive point around 510 nm. The emission ratio between ECFP and EYFPC then allowed quantitation of CaM binding properties with high precision (27). These biosensors are termed BSGPERx, with x denoting the amino acid numbering of the insert sequences. Ca2+-saturated CaM was titrated into purified mutant biosensors to obtain binding affinities. Panels i in Fig. 6, B–D, show biosensor spectral changes upon Ca2+-CaM titration to BSGPER150–175mut, BSGPER242–259mut, and BSGPER330–351mut, respectively. All mutant biosensors still bind CaM, based on the diagnostic criteria. However, plots of biosensor fractional saturation as a function of CaM (panels ii in Fig. 6, B–D) showed significant reductions in binding affinities compared with previously determined wild-type responses (27). To assess the Ca2+ sensitivities of interactions between CaM and the mutant biosensors, we concurrently measured the responses of biosensor and Ca2+ indicator Mag-Indo1 (panel iii in Fig. 6B) or X-Rhod5F (panels iii in Fig. 6, C and D) as Ca2+ was titrated into a mixture of biosensor and saturating CaM concentration. Fractional saturation-Ca2+ relationships showed reduced Ca2+ sensitivities for the interactions between CaM and all mutant biosensors versus wild-type counterparts (panels iii in Fig. 6, B–D). Fits of biosensor responses and corresponding Ca2+ concentrations to Equation 4 gave EC50(Ca2+) values for CaM interactions with BSGPER150–175mut, BSGPER242–259mut, and BSGPER330–351mut. All mutant biosensors have significantly reduced Ca2+ sensitivities in their interactions with CaM (Table 4).
FIGURE 6.

Effects of mutations introduced into GPER/GPR30 CaM-binding domains on affinities and Ca2+ sensitivities of interactions. A, FRET biosensor configuration in the unbound (i) and bound (ii) states. See “Results” for a description. iii, biosensor emission spectra in the unbound (black) or bound (blue) state. Numbers in parentheses and arrows, diagnostic criteria for positive CaM binding. B–D, spectral changes of biosensors upon CaM additions (i); biosensor fractional saturation-CaM relationships of wild-type (open circles) versus mutants (open squares) (ii); and biosensor fractional saturation-free Ca2+ relationships of wild type (open circles) versus mutants (closed circles) (iii) of the biosensors from GPER/GPR30 CaM-binding domains from SMD2 (amino acids 150–175; B), SMD3 (amino acids 242–259; C), and SMD4 (amino acids 330–351; D). Wild-type values were from Ref. 23.
TABLE 4.
Kd values and EC50(Ca2+) values for wild-type and mutant BSGPERx
| GPER/GPR30 domain | Amino acids | Wild-type Kda | Mutant Kd | Wild-type EC50(Ca2+)a | Mutant EC50(Ca2+) |
|---|---|---|---|---|---|
| μm | μm | μm | μm | ||
| SMD2 | 150–175 | 0.44 ± 0.03 | 738.5 ± 14 | 2.38 ± 0.13 | 168 ± 19 |
| SMD3 | 242–259 | 8.01 ± 0.49 | 94.47 ± 14.72 | 5.15 ± 0.55 | 17.22 ± 1.15 |
| SMD4 | 330–351 | 1.40 ± 0.16 | 71.94 ± 7.83 | 0.75 ± 0.05 | 2.08 ± 0.1 |
a Values taken from Tran and Vermeer (27).
We and others have demonstrated that G-1-induced ERK1/2 phosphorylation is an indicator of GPER/GPR30 activity (9, 23, 45). To test the impact of CaM binding on GPER/GPR30 functions, we introduced the mutations verified in Fig. 6 into the full-length receptor and expressed them in HEK293 cells to test the effects of reduced CaM binding on GPER/GPR30-mediated ERK1/2 phosphorylation. HEK293 cells were used in these experiments to ensure high transfection efficiency. GPER/GPR30-mediated ERK1/2 phosphorylation occurs via a Gβγ-dependent pathway (9). Therefore, it was necessary to first rule out if the mutations themselves affected GPER/GPR30 preassociation with Gβγ. HEK293 cells were transfected with wild-type or mutant GPER/GPR30 plasmids. After 24 h, Gβγ was immunoprecipitated from the lysate of unstimulated cells, followed by immunoblotting for GPER/GPR30 (Fig. 7A, bottom immunoblot) in the pull-down fractions. The same membrane fragments were subsequently stripped and reprobed for the Gβγ inputs (Fig. 7A, top immunoblot). The histogram (Fig. 7A) represents average relative GPER/GPR30-Gβγ preassociation in cells expressing wild-type and mutant GPER/GPR30. Having confirmed that the CaM binding-reducing mutations did not affect the preassociation between GPER/GPR30 and Gβγ, we next tested the effect of these mutations on GPER/GPR30-mediated ERK1/2 phosphorylation. Stimulation of mock-transfected HEK293 cells with GPER/GPR30 agonist G-1 stimulated ERK1/2 phosphorylation due to activation of endogenous GPER/GPR30 as we have observed previously (23). Overexpression of the wild-type receptor enhanced this effect by 4-fold, and CaM binding-reducing mutations in SMD2, -3, -4, or a combination thereof individually and additively reduced GPER/GPR30-mediated ERK1/2 phosphorylation (Fig. 7B). These data indicate that CaM binding to SMD2, -3, and -4 of GPER/GPR30 promotes the receptor's function. Taken together with data from Figs. 1–3, this indicates a feedforward loop at GPER/GPR30 that increases CaM expression in endothelial cells.
FIGURE 7.
Effects of reductions in GPER-CaM interactions on GPER/GPR30-Gβγ preassociation and GPER/GPR30-mediated ERK1/2 phosphorylation. A, HEK293 cells were transfected with wild-type or mutant GPER/GPR30 plasmids. Following lysis, Gβγ was immunoprecipitated from the lysate, followed by immunoblotting of the pull-down fractions for GPER/GPR30 and Gβγ. Histogram, average (n = 3) ratios between the densitometric values of the GPER/GPR30 bands over those of Gβγ inputs. *, p < 0.05 versus value from the G-1-treated, mock-transfected sample; Φ, p < 0.05 versus the value from the G-1-treated, wild-type GPER/GPR30-transfected sample. B, HEK293 cells were transfected with the specified plasmid containing wild-type or mutant full-length GPER/GPR30, followed by stimulation with or without 100 nm G-1 for 5 min prior to lysis. Following SDS-PAGE, membranes were separated between vinculin levels and ERK1/2 level, and fragments were probed simultaneously for vinculin (top immunoblot) and ERK1/2 phosphorylation (middle immunoblot). After development, the ERK1/2 phosphorylation fragments were stripped and reprobed for total ERK1/2 expression (bottom immunoblot). Histogram, average (n = 4) ratios of the densitometric values of the ERK1/2 phosphorylation bands over those from total ERK1/2.
E2 Enhances CaM-PMCA Interaction, yet the Stimulatory Effect on Ca2+ Extrusion Is Masked by PMCA Phosphorylation
Having identified that E2 indeed promotes CaM binding to its own receptors, we decided to examine two additional CaM targets that previously have been shown to functionally affect each other via competition for CaM: PMCA and eNOS. PMCA represents a major Ca2+ extrusion mechanism in many cell types. CaM binding increases the affinity of PMCA for Ca2+ >20-fold (46, 47). We previously showed that, due to limiting CaM, acute increases in CaM binding to eNOS, a high affinity and abundant CaM target in endothelial cells, are associated with reduced CaM-dependent activities of PMCA (17, 18). We recently showed that GPER/GPR30 forms a hetero-oligomeric complex with PMCA4b, which inhibits Ca2+ extrusion, and acute GPER/GPR30 activation further inhibits this process by promoting PMCA tyrosine phosphorylation (23). The data presented so far led to the possibility that increases in CaM availability and binding to its targets as a result of long term treatment with E2 could reverse the inhibitory effect of acute GPER/GPR30 activation on PMCA activity due to potential increased PMCA-CaM interaction. To test this, primary PAECs were subjected to 5 nm E2 or vehicle for 48 h, followed by lysis at the peak of Ca2+ entry induced by 1 μm thapsigargin. PMCA was then immunoprecipitated from the lysate, followed by immunoblotting for CaM and PMCA in the pull-down fraction. E2 increased PMCA-CaM interaction ∼2.7-fold (Fig. 8A). Simultaneous probing for β-actin and CaM in the same lysate (Fig. 8B) confirmed increased CaM expression. To test the functional impact of the E2 effect of increasing PMCA-CaM interaction, we used a specific protocol to measure Ca2+ extrusion via the PMCA (17, 18, 23, 48). Fig. 8C provides a typical time course of this protocol (see “Experimental Procedures” for description). Primary PAECs were pretreated for 48 h with various doses of E2, followed by measurement of PMCA activity using this protocol. Fig. 8D shows average Ca2+ extrusion time courses in cells with similar Ca2+ concentrations at the beginning of the extrusion phase. Fig. 8E shows average corresponding PMCA activities. E2 apparently did not increase PMCA activity as expected but dose-dependently inhibited it. PMCA expression did not change by 48-h E2 treatment (Fig. 8F).
FIGURE 8.

Effects of E2 on PMCA-CaM interaction, PMCA expression, and PMCA activity. A, PMCA was immunoprecipitated from lysate of cells treated with the specified doses of E2 for 48 h, followed by 2-min treatment with thapsigargin (TGN). SDS-PAGE membranes were separated between PMCA and CaM levels and probed with the respective antibody. B, representative CaM immunoblot from lysate collected prior to PMCA immunoprecipitation. Values are from n = 6. C, protocol for PMCA activity (see “Experimental Procedures”). TGN, thapsigargin. D, average Ca2+ extrusion time courses (n = 100 cells from eight experiments). E, relative PMCA activity (n = 100). F, average (n = 3) relative PMCA expression levels. PMCA and β-actin were simultaneously probed on the same SDS-PAGE membranes. *, p < 0.05.
The reduced PMCA activity was at odds with a 2.7-fold increase in PMCA-CaM interaction in cells exposed to E2. Based on our recent findings that GPER/GPR30 forms a hetero-oligomeric complex with PMCA4b, which inhibits the pump's activity, and acute GPER/GPR30 activation by agonist G-1 further inhibits the pump by stimulating PMCA tyrosine phosphorylation (23), we considered the possibility that the effect of enhanced PMCA-CaM interaction was masked by E2-induced tyrosine phosphorylation of PMCA. To verify this possibility, PAECs were exposed to vehicle or 5 nm E2 for 48 h, followed by treatment with thapsigargin for 2 min before immunoprecipitation of PMCA and subsequent immunoblotting of pull-down fractions for phosphotyrosine and CaM (Fig. 9A, middle and bottom immunoblots). The phosphotyrosine immunoblots were then stripped and reprobed for PMCA (Fig. 9A, top). E2 clearly increased both PMCA-CaM interaction and PMCA phosphorylation. We further reasoned that if the stimulatory effect of enhanced PMCA-CaM interaction was masked by the inhibitory effect of tyrosine phosphorylation, prevention of the latter should reveal the former. PAECs were exposed to vehicle or 5 nm E2 for 48 h, followed by 30-min treatment with 10 μm PP2, an Src kinase inhibitor that effectively prevents PMCA tyrosine phosphorylation stimulated by thrombin or GPER/GPR30 agonist G-1 (23, 49). The increase in PMCA tyrosine phosphorylation in E2-treated PAECs was now no longer seen, whereas the increased PMCA-CaM interaction still was obvious (Fig. 9B). PMCA activity was next tested on PAECs treated with similar paradigms. Fig. 9C shows the average Ca2+ extrusion time courses from these cells. E2 inhibited PMCA activity (Fig. 9D), and as expected, inhibition of tyrosine phosphorylation now revealed an overshoot in PMCA activity in E2-treated cells (Fig. 9E). These data indicate that E2 up-regulates CaM and enhances PMCA-CaM interaction, but the associated stimulatory effect is masked by E2-mediated tyrosine phosphorylation. The outcome of these combined effects is prolongation of cytoplasmic Ca2+ signals (Fig. 9C).
FIGURE 9.

Opposing effects of E2 on PMCA activity; phosphorylation and CaM binding. A, effect of E2 on tyrosine phosphorylation of PMCA and CaM binding. Primary PAECs were treated with or without 5 nm E2 for 48 h prior to lysis at the peak of Ca2+ entry stimulated by thapsigargin. PMCA was immunoprecipitated from the lysate, followed by immunoblotting for phosphotyrosine (middle blot) and CaM (bottom blot). The PMCA membrane fragment was then stripped and reprobed for the PMCA input (top blot). Histogram, average (n = 5) PMCA tyrosine phosphorylation. B, effect of Src kinase inhibition on E2-induced increases in PMCA tyrosine phosphorylation and CaM binding. Primary PAECs were treated as in A, followed by pretreatment with 10 μm PP2 prior to the addition of thapsigargin. Coimmunoprecipitation was performed as in A. Histogram, average (n = 5) PMCA tyrosine phosphorylation. C, average (n = 5) Ca2+ extrusion time courses from cells pretreated as in A or B. D–E, relative PMCA activities in cells treated as in A or B, respectively. *, p < 0.05.
E2 Enhances eNOS-CaM Interaction and eNOS Phosphorylation at Ser-617 and Ser-1179
The enhanced CaM expression (Figs. 1 and 2) and prolonged Ca2+ signals (Figs. 8D and 9C) together explained the increased Ca2+-CaM complex formation in E2-treated cells (Fig. 1F). These combined effects are potentially of pervasive impact on the network of CaM-binding proteins. We have now observed increases in CaM binding to ERα, PMCA, and GPER/GPR30, which are CaM targets with nanomolar to micromolar affinities. Endothelial NOS binds CaM (50) with picomolar affinity (18) and is capable of binding up to 25% of total CaM in endothelial cells (17). To test the effect of E2 on eNOS-CaM association, PAECs were treated with and without 5 nm E2 for 48 h and exposed to 2 μm ionomycin for 3 min prior to lysis for co-immunoprecipitation. E2 did not affect eNOS expression (Fig. 10A) but increased CaM-eNOS interaction by 2-fold (Fig. 10B).
FIGURE 10.
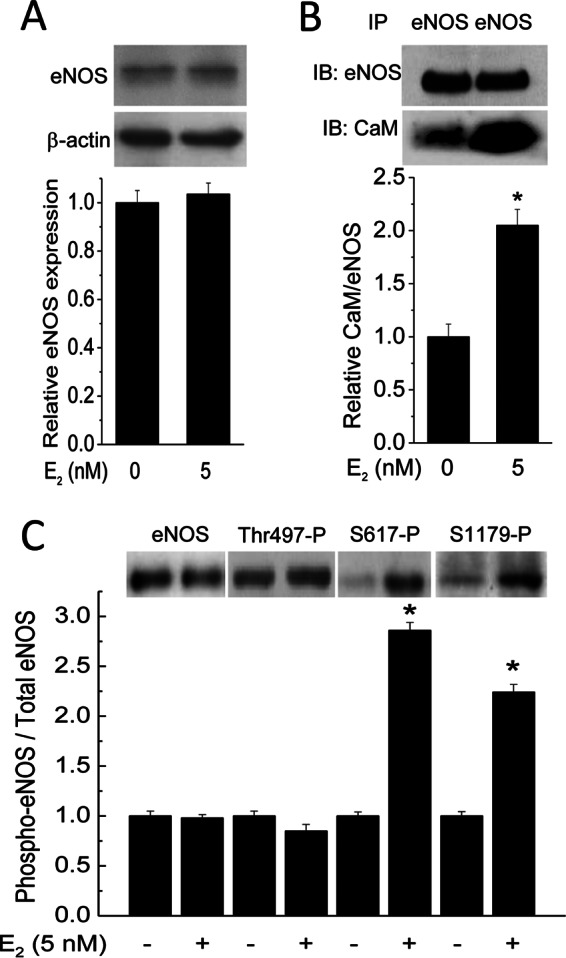
Effect of E2 on eNOS expression, CaM binding, and phosphorylation at Thr-497, Ser-617, and Ser-1179. Primary PAECs were treated with vehicle or 5 nm E2 for 48 h prior to treatment with 2 μm ionomycin and lysis. A, eNOS and β-actin were simultaneously probed from separated fragments of the same SDS-PAGE membranes. Histogram, average (n = 3) relative eNOS expression. B, effect of E2 on eNOS-CaM interaction. Cells were treated as in A. After SDS-PAGE, separated fragments of the same membranes were probed for eNOS (top immunoblot) and CaM (bottom immunoblot). Histogram, normalized average (n = 3) ratios of the densitometric values of the CaM bands over those of corresponding eNOS bands. C, effects of E2 on eNOS phosphorylation at Thr-497, Ser-617, and Ser-1179. Primary PAECs were treated as in A and B. After lysis, total eNOS expression and phosphorylation at Thr-497, Ser-617, and Ser-1179 were probed using phosphospecific antibodies. Histogram, normalized average (n = 4) relative ratios of the densitometric values of phosphorylated eNOS over those of the corresponding total eNOS bands. *, p < 0.05 versus respective control value.
Activity of eNOS is influenced by multisite phosphorylation, including Ser-116, -617, -635, and -1179; Thr-497; and Tyr-85 (bovine sequence) (51). Of all of these sites, only phosphorylation at Thr-497, Ser-617, and Ser-1179 affects CaM binding to eNOS. Thr-497 is located in the CaM-binding domain of eNOS, and its phosphorylation status directly affects CaM binding to eNOS; dephosphorylation at Thr-497 promotes CaM binding, whereas phosphorylation at this site prevents CaM-eNOS interaction (35). E2 was shown to promote phosphorylation at Ser-1179 (52) before the identification of Ser-617 and Ser-635 as phosphorylation sites (53). We previously demonstrated that biphosphorylation at Ser-617 and Ser-1179 substantially increases the Ca2+ sensitivity for the eNOS-CaM interaction, leading to synthase activation at much lower Ca2+ levels (54, 55). We thus tested if E2 promotes phosphorylation at these sites. Primary PAECs were exposed to vehicle or 5 nm E2 for 48 h, followed by immunoblotting for total eNOS and phosphorylation at Thr-497, Ser-617, and Ser-1179. E2 did not affect phosphorylation at Thr-497 but clearly promoted phosphorylation at both Ser-617 and Ser-1179 (Fig. 10C).
Proportional Contributions of the E2 Effect on Ca2+, CaM, and eNOS Biphosphorylation at Ser-617 and Ser-1179 to eNOS Activity
Given the multifaceted effects of E2 to prolong Ca2+ signals, enhance eNOS-CaM interaction, and promote phosphorylation at Ser-617 and Ser-1179, it was necessary to quantitate the contribution of each factor in the overall increase in eNOS activity. It would be challenging to do this based solely on cellular data due to the complexity of the system; however, in-cell and in vitro data are now available to do this. We have shown previously that eNOS-CaM interaction and activation follows a sequential model (55),
 |
where E is eNOS and E* represents CaM-activated eNOS. The initial step in this model represents CaM binding, determined by the equation,
 |
where K1K2 is the product of the Ca2+ binding constants for one of the EF-hand pairs in CaM (55). The second step represents CaM-dependent activation of eNOS, which requires Ca2+ binding to both EF-hand pairs. The fractional eNOS activation is described by the equation,
 |
where K3K4 is the product of the Ca2+ binding constants of the remaining pair of Ca2+ binding sites on CaM (55). This model has also been applied to eNOS-CaM binding and activation data to determine K1K2 and K3K4 values for wild-type eNOS and eNOS biphosphorylated at Ser-617 and Ser-1179 (54). Because the experiments so far in the present study have demonstrated the effects of E2 to prolong cytoplasmic Ca2+ signals, increase eNOS-CaM interaction, and promote phosphorylation at Ser-617 and Ser-1179, we now have sufficient data to utilize this model to delineate the proportional contribution of each effect to the overall increase in total eNOS activity in endothelial cells. Fig. 11A shows the average time courses of Ca2+ extrusion measured in primary PAECs exposed to vehicle or 5 nm E2 for 48 h. We now know that E2 enhances eNOS-CaM interaction and phosphorylation at Ser-617 and Ser-1179, both by a factor of ∼2 (Fig. 10, B and C). In addition, eNOS-CaM binding linearly correlates with eNOS activity (50, 56). Applying to Equation 8 intracellular Ca2+ values from Fig. 11A and previously determined values of K1K2 and K3K4 for wild-type eNOS (54) and adding a factor of 2 for the effect of increased eNOS-CaM binding on eNOS activity following E2 treatment (Fig. 10B), we were able to calculate specific eNOS point activity corresponding to each Ca2+ value in Fig. 11A. This process enabled us to calculate the portion of enhancement in eNOS activity due to the effect of E2 to prolong Ca2+ signals alone (Figs. 9C and 11A) or in combination with the increased CaM expression (Fig. 10B). Similarly, applying to Equation 8 values of K1K2 and K3K4 for eNOS biphosphorylated at Ser-617 and Ser-1179 (54) and intracellular Ca2+ data from Fig. 11A and adding a factor of 2 for synthase activity from the effect of E2 on eNOS biphosphorylation at Ser-617 and Ser-1179 (Fig. 10C), we were able to calculate E2-induced changes in eNOS point activity as a result of phosphorylation alone, combined effects on Ca2+ and phosphorylation, and combined effects on Ca2+, CaM binding, and phosphorylation (Fig. 10C). The parameters used for these calculations are shown in Table 5. Fig. 11D shows the average relative eNOS point activity at the end of the Ca2+ extrusion time courses, when intracellular concentration in untreated cells was only ∼50 nm, and the individual (inset) or combined effects of E2 on Ca2+, CaM, and eNOS biphosphorylation at Ser-617 and Ser-1179. The data show that the increases in Ca2+, Ca2+-CaM, and eNOS phosphorylation each contributed substantially to the total increase in eNOS activity in endothelial cells exposed to E2.
FIGURE 11.

Proportional contributions of the various effects of E2 to eNOS point activity. A, measured average time courses of Ca2+ extrusion in primary PAECs treated with vehicle (black circles) or 5 nm E2 (red circles) for 48 h. B, calculated eNOS point activity corresponding to the Ca2+ concentrations in A, showing the effects of vehicle (black circles), E2 on Ca2+ only (blue squares), and E2 on Ca2+ and CaM expression (red circles). C, calculated eNOS point activity corresponding to the Ca2+ values measured in A showing the effect of vehicle (black circles), of E2 on biphosphorylation at Ser-617 and Ser-1179 (black triangles), of E2 on Ca2+ and eNOS biphosphorylation (blue triangles), or of E2 (red circles) on Ca2+, CaM binding, and eNOS dual phosphorylation combined. D, average relative eNOS point activity at the end of the Ca2+ extrusion time courses comparing individual (inset) or combined effects of E2 on Ca2+, CaM binding, and dual eNOS phosphorylation. *, p < 0.001 versus control values.
TABLE 5.
Parameters for calculating eNOS activity in control versus E2-treated conditions
| Cell treatment | Intracellular [Ca2+] | Vmax increase due to increased CaM binding | Vmax increase due to increased phosphorylation | K1K2 | K3K4 |
|---|---|---|---|---|---|
| -fold | -fold | nm2 | nm2 | ||
| Vehicle | See Fig. 11A | 1 | 1 | 28,712 ± 2,810a | 14,258 ± 12,330a |
| E2 | See Fig. 11A | 2 (Fig. 10B) | 2 (Fig. 10C) | 6,183 ± 501a | 12,385 ± 1,014a |
a Values taken from Tran et al. (54).
Discussion
The present study demonstrated a feedforward loop involving GPER/GPR30 that increases CaM expression, which, together with the inhibition of Ca2+ efflux via the PMCA, results in prolonged Ca2+-CaM signals produced in cells for interactions with different targets and modulation of their activities (Fig. 12). The proteins examined here represent disparate categories of CaM targets in endothelial cells. Endothelial NOS is an abundant and high affinity CaM target, able to bind up to 25% of total CaM in endothelial cells (17) with picomolar affinity (18). PMCA and ERα bind CaM with low nanomolar affinity, whereas the four CaM-binding sequences in GPER/GPR30, when in the isolated biosensor format, bind CaM with submicromolar to low micromolar affinities (27). Our current data showed that E2 enhances CaM binding to all four proteins. These results once again confirm the limited expression of CaM for its numerous targets and demonstrate that E2 can improve endothelial functions through these pervasive effects.
FIGURE 12.

Summary of the effects of E2 to enhance linkage in the endothelial CaM network via a feedforward loop at GPER/GPR30. Tyr-P, tyrosine phosphorylation of PMCA; Δ, changes/modifications. Boldface type, examined CaM targets. Black arrows, cause and effect; red arrows, components of feedforward loop; dotted, blunt-headed line, masked stimulation.
An interesting finding here is that GPER/GPR30 mediates the E2 effect of up-regulating CaM, which in turn is important for the receptor's functions. This role of GPER/GPR30 is supported by the specific agonist effect, gene silencing data, and studies in cells that only express this receptor. The finding that ICI182,780, a dual ERα/ERβ antagonist and agonist for GPER/GPR30, generates the same effect as E2 on CaM expression further strengthens this conclusion. The effect of GPER/GPR30 activation on expression of CaM as a Ca2+-binding protein appears to be specific, because G-1 treatment did not affect expression levels of either annexin V or calreticulin in primary endothelial cells. Our data are quite consistent with findings that E2 administration to ovariectomized mice up-regulates CaM mRNA in the uterus independently of ERα and ERβ (57). Mechanistically, our data indicate that GPER/GPR30 up-regulates CaM expression at the transcriptional level via transactivation of EGFR, with downstream activation of the MAPK cascade. This is consistent with previous studies documenting that GPER/GPR30 activation causes EGFR transactivation and MAPK activation (9, 37) as well as the role of this cascade in up-regulating a number of genes, including c-fos, cyclin A and D1 (6, 58), connective tissue growth factor (59), fatty acid synthase (8), and transcription factor SF-1 (60). Our results also indicate that CaM binding to SMD2, -3, and -4 of GPER/GPR30 individually and synergistically promotes the receptor's function (Fig. 7B). Among the domains, CaM interaction with amino acids 330–351 on SMD4 apparently has the largest impact on GPER/GPR30 function. Previous data have suggested a role for CaM in regulating Gβγ interactions with the metabotropic glutamate receptors (61, 62) and the angiotensin II type 1A receptor (63). It was unclear, however, whether CaM binding prevents Gβγ association or facilitates Gβγ dissociation. Because GPER/GPR30-mediated phosphorylation of ERK1/2 is Gβγ-dependent (9), the findings that CaM binding-reducing mutations did not affect GPER/GPR30-Gβγ preassociation but decreased GPER/GPR30-mediated phosphorylation of ERK1/2 confirmed that the latter was due to reduction in CaM binding to these domains. Speculatively, these data are also consistent with the possibility that CaM binding to these domains facilitates dissociation of Gβγ, therefore enhancing GPER/GPR30-mediated signaling. However, this possibility requires further investigation.
From a functional standpoint, E2, via activation of GPER/GPR30, affects the CaM network in vascular endothelial cells by both an increase in CaM expression and a decrease in Ca2+ efflux, which prolongs cytoplasmic Ca2+-CaM signals. It is now clear that estrogen exerts multifaceted effects on Ca2+ efflux via the PMCA. We recently showed that GPER/GPR30 forms a constitutive hetero-oligomeric complex with PMCA4b, the predominant endothelial PMCA isoform (64), via their C-terminal PDZ-binding motifs, an interaction that inhibits PMCA activity while promoting GPER/GPR30 activity; and GPER/GPR30 activation adds to the constitutive inhibition by promoting PMCA tyrosine phosphorylation (23). Data in the present study are consistent with these results and earlier reports on the effect of tyrosine phosphorylation on PMCA activity (49) and further demonstrate that long term E2 treatment enhances PMCA-CaM interaction, but this is masked by the inhibitory effect of tyrosine phosphorylation. The ultimate outcome is prolongation of Ca2+ signals.
Our data indicate that eNOS, despite its picomolar Kd for CaM (18), does not have sufficient CaM to saturate its binding sites in primary cultured, untreated endothelial cells and that E2 treatment up-regulates CaM for further eNOS activation. Using a combination of in-cell and in vitro data, we were able to dissect the contribution of the many effects that E2 exerts to increase eNOS activity. At the end of the Ca2+ extrusion time courses, when cytoplasmic Ca2+ in control PAECs is only ∼50 nm, E2 inhibits Ca2+ extrusion to keep Ca2+ at ∼150 nm (Fig. 11A). This effect alone increases eNOS point activity by ∼80-fold and, when combined with the 2-fold increase in CaM binding, increases eNOS activity by ∼160-fold (Fig. 11D, inset). Assuming no change in Ca2+ or CaM binding, the effect of dual phosphorylation at Ser-617 and Ser-1179 alone increases point synthase activity 175-fold (Fig. 11D, inset). It is noteworthy that the ultimate effect of combined phosphorylation at Ser-617 and Ser-1179 is due per se to an increase in the Ca2+ sensitivity for eNOS-CaM interaction and eNOS activation (54, 55). Due to these reciprocal relationships, the effects of increases in Ca2+ and CaM added to those of eNOS phosphorylation resulted in the drastic 3,163- and 6,327-fold increases in point eNOS activity in cells exposed to E2 at the end of the Ca2+ extrusion time course (Fig. 11D). The increases in Ca2+ and CaM levels thus contribute substantially to the promotion of eNOS activity by E2 across the time course of Ca2+ signals in cells and should contribute significantly to the control of vascular tone. These data delineate the various mechanisms whereby estrogen improves vascular tone via enhancement of eNOS activity.
The combined effects of increased CaM expression and prolonged cytoplasmic Ca2+ signals are predicted to have a pervasive impact on the activities of CaM-dependent proteins. The examples of the network members presented here indicate that the up-regulation in CaM availability, although potentially of stimulatory impact on most targets, will have to be considered in conjunction with other factors that E2 also modulates, such as various phosphorylation events. Thus, for GPER/GPR30 and eNOS, E2 increases CaM binding and activities, whereas for PMCA, the effect of enhanced CaM binding is masked by inhibitory tyrosine phosphorylation. Interestingly, in this specific case, this inhibitory effect turns out to have a stimulatory effect on other targets via prolongation of cytoplasmic Ca2+ signals.
Author Contributions
Q.-K. T. conceived the study; performed the experiments presented in Figs. 1 (B–F), 10, 11, and 12 and data analysis; and wrote the paper. R. F. performed the experiments in Figs. 8 and 9 and contributed to pilot studies. J. G. performed the experiments in Fig. 4 and contributed to the experiments in Figs. 1A, 2, 8, and 9. S. F. contributed to experiments in Fig. 2 and pilot studies. V. M. performed the experiments in Fig. 6 (C and D) and Table 4. P. T. performed the experiments in Figs. 3 (C and D) and 7A. J. S. J. performed the experiments in Fig. 6B and Table 4. M. V. M. performed the experiments in Figs. 3 (A and B) and 7B. M. A. B. contributed to the experiments in Fig. 5. B. G. O. performed the experiments in Fig. 2 (E and F) and contributed to the experiments in Fig. 7. All authors reviewed their results and approved the final version of the manuscript.
Acknowledgments
We thank Dr. Anthony Persechini (University of Missouri, Kansas City, MO) for the BSCaM2 plasmid. We thank Robert Clements for assistance with cell collection.
This study was supported by National Institutes of Health Grant HL112184 (to Q.-K. T.) and Iowa Osteopathic and Educational Research Funds (to Q.-K. T). The authors declare that they have no conflicts of interest with the contents of this article. The content is solely the responsibility of the authors and does not necessarily represent the official views of the National Institutes of Health.
- ERα
- estrogen receptor α
- ERβ
- estrogen receptor β
- AG-1478
- N-(3-chlorophenyl)-6,7-dimethoxy-4-quinazolinamine
- BSCaM2
- genetically coded FRET calmodulin biosensor with ∼2 nm Kd
- BSGPERx
- FRET-based biosensors for GPER/GPR30
- BSfract
- fractional saturation of biosensor
- CaM
- calmodulin
- Ca2+-CaM
- Ca2+-saturated calmodulin
- DPN
- 2,3-bis(4-hydroxyphenyl)-propionitrile
- E2
- 17β-estradiol
- eNOS
- endothelial nitric-oxide synthase
- GPER
- G protein-coupled estrogen receptor 1
- ICI182,780
- 7α,17β-[9-[(4,4,5,5,5-pentafluoropentyl)sulfinyl]nonyl]estra-1,3,5(10)-triene-3,17-diol
- PAEC
- porcine aortic endothelial cell
- PD-98059
- 2-(2-amino-3-methoxyphenyl-4H-1-benzopyran-4-one
- PMCA
- plasma membrane Ca2+-ATPase
- PPT
- 4,4′,4″-(4-propyl-[1H]-pyrazole-1,3,5-triyl)trisphenol
- EYFP
- enhanced YFP
- EGFP
- enhanced GFP
- CP
- crossing point
- AM
- acetoxymethyl ester.
References
- 1. Chakrabarti S., Morton J. S., and Davidge S. T. (2014) Mechanisms of estrogen effects on the endothelium: an overview. Can. J. Cardiol. 30, 705–712 [DOI] [PubMed] [Google Scholar]
- 2. Nilsson S., Mäkelä S., Treuter E., Tujague M., Thomsen J., Andersson G., Enmark E., Pettersson K., Warner M., and Gustafsson J. A. (2001) Mechanisms of estrogen action. Physiol. Rev. 81, 1535–1565 [DOI] [PubMed] [Google Scholar]
- 3. Filardo E. J., and Thomas P. (2012) Minireview: G protein-coupled estrogen receptor-1, GPER-1: its mechanism of action and role in female reproductive cancer, renal and vascular physiology. Endocrinology 153, 2953–2962 [DOI] [PMC free article] [PubMed] [Google Scholar]
- 4. Prossnitz E. R., and Arterburn J. B. (2015) International Union of Basic and Clinical Pharmacology. XCVII. G protein-coupled estrogen receptor and its pharmacologic modulators. Pharmacol. Rev. 67, 505–540 [DOI] [PMC free article] [PubMed] [Google Scholar]
- 5. Vivacqua A., Bonofiglio D., Recchia A. G., Musti A. M., Picard D., Andò S., and Maggiolini M. (2006) The G protein-coupled receptor GPR30 mediates the proliferative effects induced by 17β-estradiol and hydroxytamoxifen in endometrial cancer cells. Mol. Endocrinol. 20, 631–646 [DOI] [PubMed] [Google Scholar]
- 6. Vivacqua A., Bonofiglio D., Albanito L., Madeo A., Rago V., Carpino A., Musti A. M., Picard D., Andò S., and Maggiolini M. (2006) 17β-Estradiol, genistein, and 4-hydroxytamoxifen induce the proliferation of thyroid cancer cells through the G protein-coupled receptor GPR30. Mol. Pharmacol. 70, 1414–1423 [DOI] [PubMed] [Google Scholar]
- 7. Albanito L., Madeo A., Lappano R., Vivacqua A., Rago V., Carpino A., Oprea T. I., Prossnitz E. R., Musti A. M., Andò S., and Maggiolini M. (2007) G protein-coupled receptor 30 (GPR30) mediates gene expression changes and growth response to 17β-estradiol and selective GPR30 ligand G-1 in ovarian cancer cells. Cancer Res. 67, 1859–1866 [DOI] [PubMed] [Google Scholar]
- 8. Santolla M. F., Lappano R., De Marco P., Pupo M., Vivacqua A., Sisci D., Abonante S., Iacopetta D., Cappello A. R., Dolce V., and Maggiolini M. (2012) G protein-coupled estrogen receptor mediates the up-regulation of fatty acid synthase induced by 17β-estradiol in cancer cells and cancer-associated fibroblasts. J. Biol. Chem. 287, 43234–43245 [DOI] [PMC free article] [PubMed] [Google Scholar]
- 9. Filardo E. J., Quinn J. A., Bland K. I., and Frackelton A. R. Jr. (2000) Estrogen-induced activation of Erk-1 and Erk-2 requires the G protein-coupled receptor homolog, GPR30, and occurs via trans-activation of the epidermal growth factor receptor through release of HB-EGF. Mol. Endocrinol. 14, 1649–1660 [DOI] [PubMed] [Google Scholar]
- 10. Revankar C. M., Cimino D. F., Sklar L. A., Arterburn J. B., and Prossnitz E. R. (2005) A transmembrane intracellular estrogen receptor mediates rapid cell signaling. Science 307, 1625–1630 [DOI] [PubMed] [Google Scholar]
- 11. Levitan I. B. (1999) It is calmodulin after all! Mediator of the calcium modulation of multiple ion channels. Neuron 22, 645–648 [DOI] [PubMed] [Google Scholar]
- 12. Jurado L. A., Chockalingam P. S., and Jarrett H. W. (1999) Apocalmodulin. Physiol. Rev. 79, 661–682 [DOI] [PubMed] [Google Scholar]
- 13. Shen X., Valencia C. A., Szostak J., Dong B., and Liu R. (2005) Scanning the human proteome for calmodulin-binding proteins. Proc. Natl. Acad. Sci. U.S.A. 102, 5969–5974 [DOI] [PMC free article] [PubMed] [Google Scholar]
- 14. Persechini A., and Stemmer P. M. (2002) Calmodulin is a limiting factor in the cell. Trends Cardiovasc. Med. 12, 32–37 [DOI] [PubMed] [Google Scholar]
- 15. Kakiuchi S., Yasuda S., Yamazaki R., Teshima Y., Kanda K., Kakiuchi R., and Sobue K. (1982) Quantitative determinations of calmodulin in the supernatant and particulate fractions of mammalian tissues. J. Biochem. 92, 1041–1048 [DOI] [PubMed] [Google Scholar]
- 16. Luby-Phelps K., Hori M., Phelps J. M., and Won D. (1995) Ca2+-regulated dynamic compartmentalization of calmodulin in living smooth muscle cells. J. Biol. Chem. 270, 21532–21538 [DOI] [PubMed] [Google Scholar]
- 17. Tran Q. K., Black D. J., and Persechini A. (2003) Intracellular coupling via limiting calmodulin. J. Biol. Chem. 278, 24247–24250 [DOI] [PubMed] [Google Scholar]
- 18. Tran Q. K., Black D. J., Persechini A. (2005) Dominant affectors in the calmodulin network shape the time courses of target responses in the cell. Cell Calcium 37, 541–553 [DOI] [PubMed] [Google Scholar]
- 19. Kim S. A., Heinze K. G., Waxham M. N., and Schwille P. (2004) Intracellular calmodulin availability accessed with two-photon cross-correlation. Proc. Natl. Acad. Sci. U.S.A. 101, 105–110 [DOI] [PMC free article] [PubMed] [Google Scholar]
- 20. Song Q., Saucerman J. J., Bossuyt J., and Bers D. M. (2008) Differential integration of Ca2+-calmodulin signal in intact ventricular myocytes at low and high affinity Ca2+-calmodulin targets. J. Biol. Chem. 283, 31531–31540 [DOI] [PMC free article] [PubMed] [Google Scholar]
- 21. Wu X., and Bers D. M. (2007) Free and bound intracellular calmodulin measurements in cardiac myocytes. Cell Calcium 41, 353–364 [DOI] [PMC free article] [PubMed] [Google Scholar]
- 22. Rakhilin S. V., Olson P. A., Nishi A., Starkova N. N., Fienberg A. A., Nairn A. C., Surmeier D. J., and Greengard P. (2004) A network of control mediated by regulator of calcium/calmodulin-dependent signaling. Science 306, 698–701 [DOI] [PubMed] [Google Scholar]
- 23. Tran Q. K., VerMeer M., Burgard M. A., Hassan A. B., and Giles J. (2015) Hetero-oligomeric complex between the G protein-coupled estrogen receptor 1 and the plasma membrane Ca2+-ATPase 4b. J. Biol. Chem. 290, 13293–13307 [DOI] [PMC free article] [PubMed] [Google Scholar]
- 24. Watanabe H., Takahashi R., Zhang X. X., Kakizawa H., Hayashi H., and Ohno R. (1996) Inhibition of agonist-induced Ca2+ entry in endothelial cells by myosin light-chain kinase inhibitor. Biochem. Biophys. Res. Commun. 225, 777–784 [DOI] [PubMed] [Google Scholar]
- 25. Watanabe H., Tran Q. K., Takeuchi K., Fukao M., Liu M. Y., Kanno M., Hayashi T., Iguchi A., Seto M., and Ohashi K. (2001) Myosin light-chain kinase regulates endothelial calcium entry and endothelium-dependent vasodilation. FASEB J. 15, 282–284 [DOI] [PubMed] [Google Scholar]
- 26. Watanabe H., Kuhne W., Spahr R., Schwartz P., and Piper H. M. (1991) Macromolecule permeability of coronary and aortic endothelial monolayers under energy depletion. Am. J. Physiol. 260, H1344–H1352 [DOI] [PubMed] [Google Scholar]
- 27. Tran Q. K., Vermeer M. (2014) Biosensor-based approach identifies four distinct calmodulin-binding domains in the G Protein-Coupled Estrogen Receptor 1. PLoS One 9, e89669. [DOI] [PMC free article] [PubMed] [Google Scholar]
- 28. Pfaffl M. W. (2001) A new mathematical model for relative quantification in real-time RT-PCR. Nucleic Acids Res. 29, e45. [DOI] [PMC free article] [PubMed] [Google Scholar]
- 29. Romoser V. A., Hinkle P. M., and Persechini A. (1997) Detection in living cells of Ca2+-dependent changes in the fluorescence emission of an indicator composed of two green fluorescent protein variants linked by a calmodulin-binding sequence: a new class of fluorescent indicators. J. Biol. Chem. 272, 13270–13274 [DOI] [PubMed] [Google Scholar]
- 30. Persechini A., and Cronk B. (1999) The relationship between the free concentrations of Ca2+ and Ca2+-calmodulin in intact cells. J. Biol. Chem. 274, 6827–6830 [DOI] [PubMed] [Google Scholar]
- 31. Isotani E., Zhi G., Lau K. S., Huang J., Mizuno Y., Persechini A., Geguchadze R., Kamm K. E., and Stull J. T. (2004) Real-time evaluation of myosin light chain kinase activation in smooth muscle tissues from a transgenic calmodulin-biosensor mouse. Proc. Natl. Acad. Sci. U.S.A. 101, 6279–6284 [DOI] [PMC free article] [PubMed] [Google Scholar]
- 32. Spahr R., Piper H. M. (1990) in Cell Culture Techniques in Heart and Vessel Research (Piper H. M., ed) pp. 220–229, Springer-Verlag, Heidelberg [Google Scholar]
- 33. Kuhne W., Besselmann M., Noll T., Muhs A., Watanabe H., and Piper H. M. (1993) Disintegration of cytoskeletal structure of actin filaments in energy-depleted endothelial cells. Am. J. Physiol. 264, H1599–H1608 [DOI] [PubMed] [Google Scholar]
- 34. McConnell E. J., White G. W., Brokaw J. J., and Raess B. U. (2000) Pharmacological and immunohistochemical characterization of calmodulin-stimulated (Ca2+ + Mg2+)-ATPase in cultured porcine aortic endothelial cells. Circ. Res. 86, 191–197 [DOI] [PubMed] [Google Scholar]
- 35. Fleming I., Fisslthaler B., Dimmeler S., Kemp B. E., and Busse R. (2001) Phosphorylation of Thr495 regulates Ca2+/calmodulin-dependent endothelial nitric oxide synthase activity. Circ. Res. 88, E68–E75 [DOI] [PubMed] [Google Scholar]
- 36. Vladusic E. A., Hornby A. E., Guerra-Vladusic F. K., Lakins J., and Lupu R. (2000) Expression and regulation of estrogen receptor β in human breast tumors and cell lines. Oncol. Rep. 7, 157–167 [DOI] [PubMed] [Google Scholar]
- 37. Filardo E. J., Quinn J. A., Frackelton A. R. Jr., and Bland K. I. (2002) Estrogen action via the G protein-coupled receptor, GPR30: stimulation of adenylyl cyclase and cAMP-mediated attenuation of the epidermal growth factor receptor-to-MAPK signaling axis. Mol. Endocrinol. 16, 70–84 [DOI] [PubMed] [Google Scholar]
- 38. Filardo E. J., Quinn J. A., and Sabo E. (2008) Association of the membrane estrogen receptor, GPR30, with breast tumor metastasis and transactivation of the epidermal growth factor receptor. Steroids 73, 870–873 [DOI] [PubMed] [Google Scholar]
- 39. Castoria G., Migliaccio A., Nola E., and Auricchio F. (1988) In vitro interaction of estradiol receptor with Ca2+-calmodulin. Mol. Endocrinol. 2, 167–174 [DOI] [PubMed] [Google Scholar]
- 40. Li Z., Joyal J. L., and Sacks D. B. (2001) Calmodulin enhances the stability of the estrogen receptor. J. Biol. Chem. 276, 17354–17360 [DOI] [PubMed] [Google Scholar]
- 41. Li L., Li Z., and Sacks D. B. (2005) The transcriptional activity of estrogen receptor-α is dependent on Ca2+/calmodulin. J. Biol. Chem. 280, 13097–13104 [DOI] [PubMed] [Google Scholar]
- 42. Zhang Y., Li Z., Sacks D. B., and Ames J. B. (2012) Structural basis for Ca2+-induced activation and dimerization of estrogen receptor α by calmodulin. J. Biol. Chem. 287, 9336–9344 [DOI] [PMC free article] [PubMed] [Google Scholar]
- 43. Li L., Li Z., and Sacks D. B. (2003) Calmodulin regulates the transcriptional activity of estrogen receptors: selective inhibition of calmodulin function in subcellular compartments. J. Biol. Chem. 278, 1195–1200 [DOI] [PubMed] [Google Scholar]
- 44. Li L., and Sacks D. B. (2007) Functional interactions between calmodulin and estrogen receptor-α. Cell. Signal. 19, 439–443 [DOI] [PubMed] [Google Scholar]
- 45. Ding Q., Gros R., Limbird L. E., Chorazyczewski J., and Feldman R. D. (2009) Estradiol-mediated ERK phosphorylation and apoptosis in vascular smooth muscle cells requires GPR 30. Am. J. Physiol. Cell Physiol. 297, C1178–C1187 [DOI] [PubMed] [Google Scholar]
- 46. Caride A. J., Elwess N. L., Verma A. K., Filoteo A. G., Enyedi A., Bajzer Z., and Penniston J. T. (1999) The rate of activation by calmodulin of isoform 4 of the plasma membrane Ca2+ pump is slow and is changed by alternative splicing. J. Biol. Chem. 274, 35227–35232 [DOI] [PubMed] [Google Scholar]
- 47. Di Leva F., Domi T., Fedrizzi L., Lim D., and Carafoli E. (2008) The plasma membrane Ca2+ ATPase of animal cells: structure, function and regulation. Arch. Biochem. Biophys. 476, 65–74 [DOI] [PubMed] [Google Scholar]
- 48. Wang X., Reznick S., Li P., Liang W., and van Breemen C. (2002) Ca2+ removal mechanisms in freshly isolated rabbit aortic endothelial cells. Cell Calcium 31, 265–277 [DOI] [PubMed] [Google Scholar]
- 49. Dean W. L., Chen D., Brandt P. C., and Vanaman T. C. (1997) Regulation of platelet plasma membrane Ca2+-ATPase by cAMP-dependent and tyrosine phosphorylation. J. Biol. Chem. 272, 15113–15119 [DOI] [PubMed] [Google Scholar]
- 50. Bredt D. S., and Snyder S. H. (1990) Isolation of nitric oxide synthetase, a calmodulin-requiring enzyme. Proc. Natl. Acad. Sci. U.S.A. 87, 682–685 [DOI] [PMC free article] [PubMed] [Google Scholar]
- 51. Mount P. F., Kemp B. E., and Power D. A. (2007) Regulation of endothelial and myocardial NO synthesis by multi-site eNOS phosphorylation. J. Mol. Cell Cardiol. 42, 271–279 [DOI] [PubMed] [Google Scholar]
- 52. Haynes M. P., Sinha D., Russell K. S., Collinge M., Fulton D., Morales-Ruiz M., Sessa W. C., and Bender J. R. (2000) Membrane estrogen receptor engagement activates endothelial nitric oxide synthase via the PI3-kinase-Akt pathway in human endothelial cells. Circ. Res. 87, 677–682 [DOI] [PubMed] [Google Scholar]
- 53. Michell B. J., Harris M. B., Chen Z. P., Ju H., Venema V. J., Blackstone M. A., Huang W., Venema R. C., and Kemp B. E. (2002) Identification of regulatory sites of phosphorylation of the bovine endothelial nitric-oxide synthase at serine 617 and serine 635. J. Biol. Chem. 277, 42344–42351 [DOI] [PubMed] [Google Scholar]
- 54. Tran Q. K., Leonard J., Black D. J., Nadeau O. W., Boulatnikov I. G., and Persechini A. (2009) Effects of combined phosphorylation at Ser-617 and Ser-1179 in endothelial nitric-oxide synthase on EC50(Ca2+) values for calmodulin binding and enzyme activation. J. Biol. Chem. 284, 11892–11899 [DOI] [PMC free article] [PubMed] [Google Scholar]
- 55. Tran Q. K., Leonard J., Black D. J., and Persechini A. (2008) Phosphorylation within an autoinhibitory domain in endothelial nitric oxide synthase reduces the Ca2+ concentrations required for calmodulin to bind and activate the enzyme. Biochemistry 47, 7557–7566 [DOI] [PMC free article] [PubMed] [Google Scholar]
- 56. Pollock J. S., Förstermann U., Mitchell J. A., Warner T. D., Schmidt H. H., Nakane M., and Murad F. (1991) Purification and characterization of particulate endothelium-derived relaxing factor synthase from cultured and native bovine aortic endothelial cells. Proc. Natl. Acad. Sci. U.S.A. 88, 10480–10484 [DOI] [PMC free article] [PubMed] [Google Scholar]
- 57. Das S. K., Tan J., Raja S., Halder J., Paria B. C., and Dey S. K. (2000) Estrogen targets genes involved in protein processing, calcium homeostasis, and Wnt signaling in the mouse uterus independent of estrogen receptor-α and -β. J. Biol. Chem. 275, 28834–28842 [DOI] [PubMed] [Google Scholar]
- 58. Albanito L., Lappano R., Madeo A., Chimento A., Prossnitz E. R., Cappello A. R., Dolce V., Abonante S., Pezzi V., and Maggiolini M. (2015) Effects of atrazine on estrogen receptor α- and G protein-coupled receptor 30-mediated signaling and proliferation in cancer cells and cancer-associated fibroblasts. Environ. Health Perspect. 123, 493–499 [DOI] [PMC free article] [PubMed] [Google Scholar]
- 59. Pandey D. P., Lappano R., Albanito L., Madeo A., Maggiolini M., and Picard D. (2009) Estrogenic GPR30 signalling induces proliferation and migration of breast cancer cells through CTGF. EMBO J. 28, 523–532 [DOI] [PMC free article] [PubMed] [Google Scholar]
- 60. Lin B. C., Suzawa M., Blind R. D., Tobias S. C., Bulun S. E., Scanlan T. S., and Ingraham H. A. (2009) Stimulating the GPR30 estrogen receptor with a novel tamoxifen analogue activates SF-1 and promotes endometrial cell proliferation. Cancer Res. 69, 5415–5423 [DOI] [PMC free article] [PubMed] [Google Scholar]
- 61. O'Connor V., El Far O., Bofill-Cardona E., Nanoff C., Freissmuth M., Karschin A., Airas J. M., Betz H., and Boehm S. (1999) Calmodulin dependence of presynaptic metabotropic glutamate receptor signaling. Science 286, 1180–1184 [DOI] [PubMed] [Google Scholar]
- 62. El-Beialy W., Galal N., Deyama Y., Yoshimura Y., Suzuki K., Tei K., and Totsuka Y. (2010) Effects of estrogen on PMCA 2 and 4 in human fibroblast-like synovial cells and mouse macrophage-like cells. Endocr. J. 57, 93–97 [DOI] [PubMed] [Google Scholar]
- 63. Zhang R., Liu Z., Qu Y., Xu Y., and Yang Q. (2013) Two distinct calmodulin binding sites in the third intracellular loop and carboxyl tail of angiotensin II (AT1A) receptor. PLoS One 8, e65266. [DOI] [PMC free article] [PubMed] [Google Scholar]
- 64. Strehler E. E., and Zacharias D. A. (2001) Role of alternative splicing in generating isoform diversity among plasma membrane calcium pumps. Physiol. Rev. 81, 21–50 [DOI] [PubMed] [Google Scholar]