Abstract
We present a compressive video microscope based on structured illumination with incoherent light source. The source-side illumination coding scheme allows the emission photons being collected by the full aperture of the microscope objective, and thus is suitable for the fluorescence readout mode. A 2-step iterative reconstruction algorithm, termed BWISE, has been developed to address the mismatch between the illumination pattern size and the detector pixel size. Image sequences with a temporal compression ratio of 4:1 were demonstrated.
OCIS codes: (110.1758) Computational imaging, (110.3010) Image reconstruction techniques, (180.2520) Fluorescence microscopy
1. Introduction
Temporal microscopy imaging is a powerful revealing tool for the study of cell dynamics. Many fundamental processes, such as neural activities, and the molecular motions are on the time scale of millisecond and sub-millisecond [1, 2], requiring a frame rate >100 Hz. High speed fluorescence imaging system could also greatly improve the throughput of fluorescence bioassay and microfluidic based analysis devices [3]. The CCD or CMOS imagers with fast readout electronics are widely deployed in these systems. Typical imagers in consumer electronics have a frame rates of 30 Hz. Sensors with readout speed from ~200 to 1000 Hz are required for high speed imaging applications, but the cost is an order of magnitude more than typical sensors. Using code division multiple access video compression implemented on the detection side was recently demonstrated in a camera setting [4]. Though a compression ratio of ~ 10 was demonstrated, such a setup would reduce the collection efficiency by ~ 50%, due to the coded aperture mask, and therefore is not suitable for fluorescence readout.
Structured illumination, as a coding mechanism, has been explored extensively in the microscopy. Two notable examples are the super-resolution in lateral direction beyond the diffraction limit and the enhancement of depth sectioning capability [5, 6]. In the two dimensional super-resolution microscope setup, a periodic illumination pattern induces a frequency shift in the Fourier domain, channeling the high spatial frequency components into the detectable range.
In this paper, we demonstrate a temporally compressive microscopy setup based on structured illumination. Similar to the super-resolution in the spatial domain, a temporally varying illumination is deployed in our system, which channels high temporal frequency components into low frame rate detection. To implement such a system, one only needs to insert a mask in the illumination path, which requires minimal modification to a conventional microscope. The source-side illumination coding scheme is suitable for low photon-budget applications: the emission photon can be collected by the full aperture. This paper is organized as follows. We first introduce the forward model of temporal compressive measurement and revisit the concept of structured illumination in microscopy in Section 2. Then we describe the reconstruction algorithm and discuss the effect of illumination feature size in reconstruction in Section 3. In Section 4 we show the simulated reconstruction results and determined the optimal feature size of the illumination pattern. Finally, we present our experimental results and conclude the paper with potential applications for the system in Section 5.
2. Theory
2.1. Imaging forward model
Let the time-varying reflection or fluorescence signal from the object be f(x,y,t). The microscope image sampling, which is determined by the detector pixel size after the object magnification, usually satisfies the Nyquist criterion, and the spatial bandwidth is limited by the numerical aperture (NA) of the microscope objective. The point spread function (PSF) is h(x,y), and the structured illumination imposed on the sample is S(x,y,t). Then the measurement at the detector coordinates (x′,y′) and time point , described by , can be expressed as:
| (1) |
where the frame period of the camera is Δt. We assume the time-varying illumination can be discretized in time. The time period between two steps is τ and each frame period can be divided into NT periods, i.e.Δt/τ = NT. The illumination pattern at time (ti + kτ) is Sk(x,y) = S(x,y,ti + kτ). So each captured frame can be considered as a compressed measurement of NT scenes from the object. Equation (1) can then be written as:
| (2) |
where is the kth scene within the ith measurement frame. We can discretize fk(x,y) as:
| (3) |
which consists of m × n pixels in total. Let the vectorized form of Fk be fi, and the vectorized measurement g can be expressed by the following forward model:
| (4) |
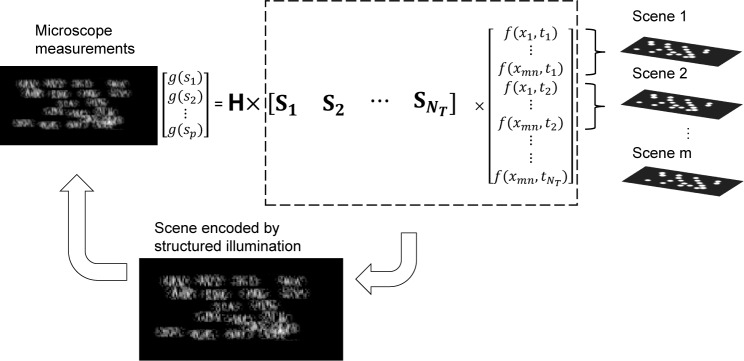
where Si is the structured illumination matrix of ith illumination pattern, and H is the PSF matrix of the objective served as a blur kernel. Figure 1 illustrates the forward model.
Fig. 1.
The forward model of structured illumination microscope. On the left we show the microscope measurement g, and on the right we depict the sensing process. The mathematical formulation is demonstrated in Equation (4). H is the point spread function matrix served as the blur kernel. are the structured illumination matrix and are the signal intensity from the object at different time slots. Each frame of the scene is first encoded via the structured illumination matrix and then the measurement is convoluted by the point spread function.
2.2. Structured illumination
In this section, we relate the structured illumination for spatial super-resolution to compressive temporal imaging. For the simplicity of the discussion, here we limit the system model to one dimension in space and one dimension in time. The structured illumination pattern is translated linearly at a constant speed s during one single-frame acquisition, i.e. S(x′,t′) = S(x′ − st′). The scene from the object is f(x′,t′). Then Equation (1) becomes:
| (5) |
where h(x) is the point spread function of the microscope objective. The measurement in the Fourier domain, ĝ(u,v), can be expressed as
| (6) |
where u and v are the spatial frequency variable and temporal frequency variable, respectively. and Ŝ are the Fourier transform of the object function f and the structured illumination pattern S, respectively. H is the optical transfer function (OTF) of the imaging system, which is the Fourier transform of the point spread function h(x). The ideal normalized OTF can be calculated by [7]
| (7) |
where w(u) is the amplitude transfer function:
| (8) |
with λ representing the wavelength. The transfer function is a low-pass filter, and the pass-band is limited by the wavelength and the NA. We focus our discussion and simulation on diffraction-limited system, and for the case with optical aberrations, the OTF can be simply calculated by adding in the wavefront aberrations.
Without the structured illumination S(x), the measurement temporal bandwidth is limited by the frame-rate 1/Δt of the imager. The spatial bandwidth is limited by the bandwidth of the objectives OTF, Δu. Thanks to the structured illumination Ŝ on the object, the high temporal and spatial components are aliased via the convolution , and the recovery of the high spatial or temporal components becomes feasible. The expended bandwidth in the spatial domain is determined by the band-limit of the structured illumination Δs. In spatial supper-resolution microscope [5], the structured illumination channels the high spatial frequency components to the bandwidth within the OTF of the objective. As the illumination pattern is projected to the object through the microscope objective, the band-limit of the structured illumination Ŝ is also Δu, and the spatial resolution of the reconstructed image can be extended up to 2Δu.
The temporal resolution, however, can be extended to sΔs. Different from that of the spatial resolution enhancement, the spatial bandwidth of the structured illumination does not limit the temporal resolution, as long as the speed of the translation s is sufficiently fast. To expand the temporal bandwidth from 1/Δt to 1/τ, the speed of the translation needs to be on the order of (τΔs)−1. This implies that in order to resolve two consecutive scenes, the structured illumination needs to be translate one feature size of the illumination pattern. Instead of enhancing the spatial resolution, our system applies temporally varying structured illumination to achieve a higher image acquisition rate. Here, we assume that the object does not contain frequency components beyond the bandwidth of the microscope objective.
3. Materials and methods
3.1. Reconstruction algorithm: BWISE
Diverse algorithms have been proposed and used for video compressive sensing [4, 8, 9, 10]. However, most of these algorithm are based on the model without consideration of the blur kernel H. These algorithms also do not take the difference between the feature size of the spatial coding and the pixel size of the sensor into consideration. This difference is negligible for the detection-side coding scheme. Since the pattern size can be several magnitudes larger than the sensor’s pixel size in the structured illumination setup, the existing algorithms would fail to recover the high spatial frequency components beyond the bandwidth of the illumination pattern, leading to an inferior resolution in reconstruction. Therefore, we have developed a new algorithm integrating both considerations, which are critical to the success of the reconstruction. Roughly, these compressive sensing reconstruction algorithms are developed based on the sparsity of the video in certain domains. For instance, the wavelet and discrete cosine transformation (DCT) are used in [4, 10] and the dictionary learning is used in [9]. In this work, we will focus on the total variation (TV) based methods, with significant improvement described below by proposing the Block-WIse Smooth Estimator (BWISE), which has been demonstrated to be effective in solving our problem.
Let A = HS, and the forward model in (4) can be re-written as
| (9) |
The reconstruction problem can be formulated as
| (10) |
where R(f) is a regularizer and it can be used to impose the sparsity of the signal in the basis such as the wavelet and DCT, or a TV operator [11]. The regularizer penalizes characteristics of the estimated f that would result in poor reconstructions. τ is the Lagrange parameter balancing the measurement error (the first term in Equation (10)) and the regularizer is specified below:
| (11) |
where
| (12) |
is performed on each frame and hence penalize estimates with sharp spatial gradients.
Several iterative compressive reconstruction algorithms can be categorized as an 2-step iterative method, comprising [12, 13]: (i) projecting the measurement data to the desired videos/images; and (ii) denoising the results obtained in step (i). For Step (i), various algorithms have been used and the most popular methods are the iterative shrinkage-thresholding (IST) algorithm [14], the ADMM [15] and the generalized alternating projection (GAP) algorithm [8, 16]. Our algorithm also falls into this two-step iterative regime. For Step (i), both ADMM and GAP need a matrix inversion [13], while IST is easier to be implemented, only requiring matrix multiplications. Introducing a step size parameter α, we have the following two-step iteratively alternating projection algorithm. For kth iteration
| (13) |
| (14) |
Equations (13) and (14) are iteratively performed until termination criteria are satisfied.
For Equation (14), complicated patch based algorithms have been developed for video compressive sensing [17] and have achieved excellent results. However, these algorithms are usually time consuming. The TV based algorithm [11], on the other hand, usually presents decent results [4] in a shorter time.
In optical microscopy applications, the reconstruction directly applying TV regularizer could lead to the loss of fine details. The proposed algorithm, BWISE, imposes a block-wise TV regularization, rather than the pixel-wise TV regularization, and the size of the block depends on the feature size of the structured illumination. Mathematically, the conventional TV denoising is performed after imposing the pixel-wise differentiation operator, D. In BWISE, the TV denoising is performed after the block-wise differential operation. Thus the denoising in BWISE is a joint global-local method. It is worth noting that the TV regularzier should be only performed spatially within each frame as in Equation (12), rather than applied to the entire 3D data cube, which allows us to reconstruct the motions between frames. Here we use to denote the block-wise differential operation, and by introducing , the iterative clipping algorithm for block-TV denoising becomes:
| (15) |
| (16) |
where z0 = 0, γ is the thresholding parameter used in the clipping function, β ≥ maxeig (DD⊤) and the clipping function clip (·) is defined as:
| (17) |
The BWISE algorithm is composed solely by Equation (13) and Equations (15)–(16), where Equations (15)–(16) play the role of denoising as mentioned in Equation (14) (Step (ii) mentioned above) and Equation (13) is playing the role of Step (i).
3.2. Experimental setup
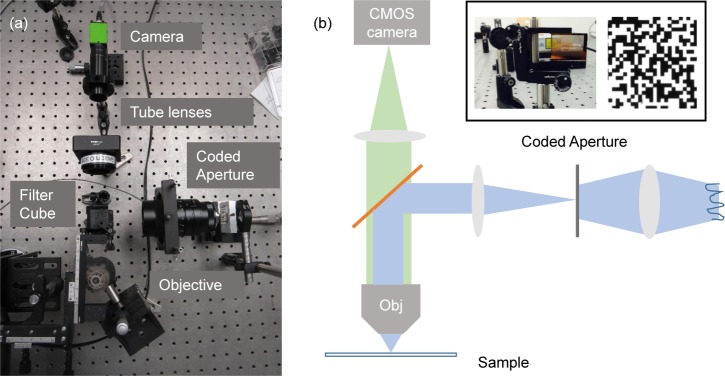
The experimental setup employed a 490nm LED (M490L3, Thorlabs) as the light source, as most epi-illumination microscopes are equipped with an incoherent source for its cost-effectiveness. It is worth noting that our system could also use a coherent source for higher illumination efficiency, similar to the setup in [5]. The sample was a mounted microscope slide with a layer of quantum dots 525 (753769, Sigma Aldrich). The pattern of “UCF” logo was transferred to the microscope cover slip, and the thickness of the pattern is ~ 2µm. The pattern size is 100µm × 50µm. The fluorescent sample was translated at a speed of 2mm/sec by a step motor (LHA-HS, Newport). We also prepared samples of fluorescent cells. The infected HeLa cell line expressing green fluorescence protein (GFP) [19, 20], were seeded onto poly-L-lysine-coated 1.2cm coverslips at a density of 10,000 cells per coverslip in 0.15 ml of DMEM/10% FBS for overnight before imaging. The detection path of the microscope system consisted of a 20× objective (0.5 NA, Nikon), and a tube lens with 200mm focal length. The fluorescence filter cube has an excitation band centered at 480nm (bandwidth 40nm), and an emission band centered at 530nm (bandwidth 50nm) (41001, Chroma). We captured the video with a low frame rate of 40 frame/second, limited by the camera (GO5000USB, JAI). The mask was a chrome patterned on a fused silica optical blank, with a feature size of 6.5µm (HTA photo mask), as shown in Fig. 2. The mask was mounted on a piezo actuator, with the maximum stroke of 40µm (P-840.3 Physik Instrument). The magnification of the mask on the illumination side can be adjust by the illumination tube lens (M6Z1212, Computar). The calibration frame was acquired by averaging the frames of a moving fluorescence target with a stationary mask.
Fig. 2.
(a) The photo of the experimental setup. (b) The schematic of the setup. A 20 × 0.5 NA objective (bottom part) is used in the system. The coded aperture mask, placed at the conjugate image plane (middle-right part) in the illumination path. The step motion of the mask is synchronized with the camera (top part) acquisition.
4. Results and discussions
4.1. Reconstruction algorithm comparison
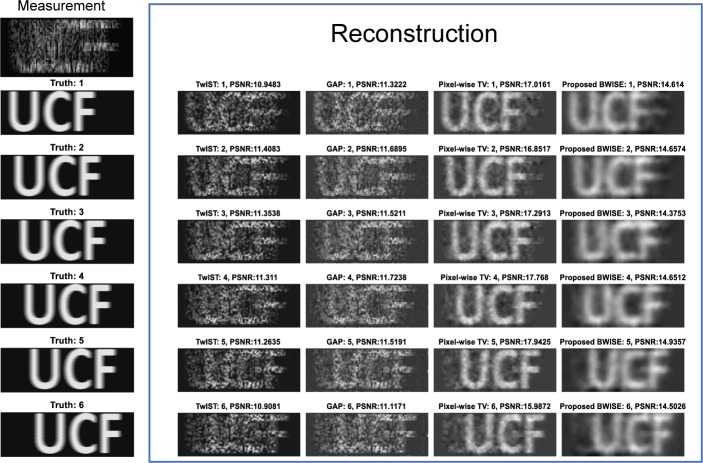
To demonstrate the performance of our proposed algorithm, we first synthesize video frames using a moving “UCF” logo containing high frequency components (fine slanted strips) with ground truth shown in the first column of Fig. 3. The translation step-size is 5µm between frames. The frame has a total number of 256 × 512 pixels and the size of each pixel is 0.25µm × 0.25µm and we use NA = 0.5 with the wavelength λ = 0.488µm in Equations (7)–(8) to calculate the OTF of the microscope objective. The feature size of the code is set to 2µm. We compare our algorithm BWISE, with the following popular reconstruction algorithms: (i) TwIST [11], which exploits the pixel-wise TV but using a different projection approach from our method, (ii) GAP, which exploits the sparsity of the video cube in the transformation domain, and here we use wavelet in space and DCT in time, same as [4]. For the proposed BWISE algorithm, we perform both pixel-wise and block-wise TV (with a block size of 8 × 8 pixels). We compare the PSNR (peak-signal-to-noise ratio) of the results from different algorithms. With less than 200 iterations, the reconstructed images are shown in Fig. 3. Visually, both the pixel-wise and block-wise TV provide higher PSNRs than TwIST and GAP. Furthermore, the proposed BWISE reconstruction is able to keep the detailed features of the object, as demonstrated in Fig. 4. Though the PSNR (of the entire image) reconstructed by the block-wise TV is lower than the pixel-wise TV, the block-wise TV retains the high frequency components for microscopy applications. GAP aims to keep the low frequency components of the video cube (removing the high frequency components to satisfy the sparsity in frequency domain), while in our simulation, the “UCF” logo contains both low-frequency and high-frequency components; this is the reason that GAP fails.
Fig. 3.
The comparison of the reconstruction results of the simulated moving “UCF” logo dataset with different algorithms. The coded measurement is shown on the top-left. Each row shows one frame. Each row (2–7) shows one frame. From the first to the fifth columns are the truth, TwIST reconstruction, GAP reconstruction, pixel-wise TV reconstruction and proposed BWISE reconstruction, respectively.
Fig. 4.
Magnified reconstruction result showing the capability of proposed BWISE algorithm to reconstruct high frequency components. The reconstruction from the left to right is the truth, pixel-wise TV and proposed BWISE algorithm, respectively. It can be observed that the proposed BWISE recovers the high frequency components of the object.
4.2. Illumination pattern size
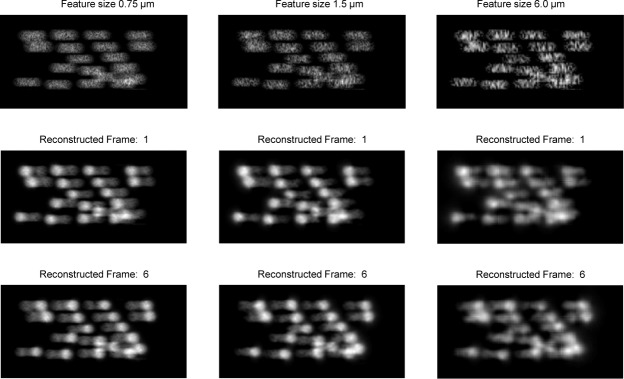
We further conduct simulation of another dataset: the moving beads traveling in a microfluidic channel, as shown in Fig. 5. The diameter of the beads is around 20µm. Same parameters (NA = 0.5, λ = 0.488µm, pixel size 0.25µm × 0.25µm) are used as the “UCF” logo dataset, and we aim to investigate the performance of the reconstruction under different illumination pattern sizes. We perform inversion with BWISE with different feature sizes from 0.75µm to 6µm with PSNR results plotted in Fig. 6. We only show the first and last frames of the reconstruction in Fig. 5. Different trials with random coding pattern are used during the simulation with error-bars also presented in Fig. 6. It can be seen that when the illumination pattern size equals 1.5µm, the highest PNSR is achieved and we can also identify the quality of reconstructed images in Fig. 5. On the other pattern sizes, the reconstruction images are either blurred or dispersed. This further verifies our speculation in Section 2.2. When the feature of the illumination pattern is close to or smaller than the point spread function of the objective, the contrast of the imposed structure is low, and the coding contrast in each frame becomes weaker. We used incoherent light source in our experiment, and the resolution of the microscope is 0.60µm, determined by Rayleigh criterion. When the illumination feature size is 0.75µm, close to the resolution of the objective, the low contrast of the pattern would result in poor reconstruction. Though large mask pattern size will improve illumination contrast, there will be large patches not being illuminated, leading to errors in the reconstruction as well. The illumination pattern that is about twice the size of the microscope resolution shows excellent reconstruction results.
Fig. 5.
Examples of the reconstructed images of the simulated moving beads dataset with illumination pattern size of 0.75, 1.5 and 6 µm. The top row shows the coded measurement and the bottom two rows demonstrate the reconstructed Frame 1 and Frame 6.
Fig. 6.
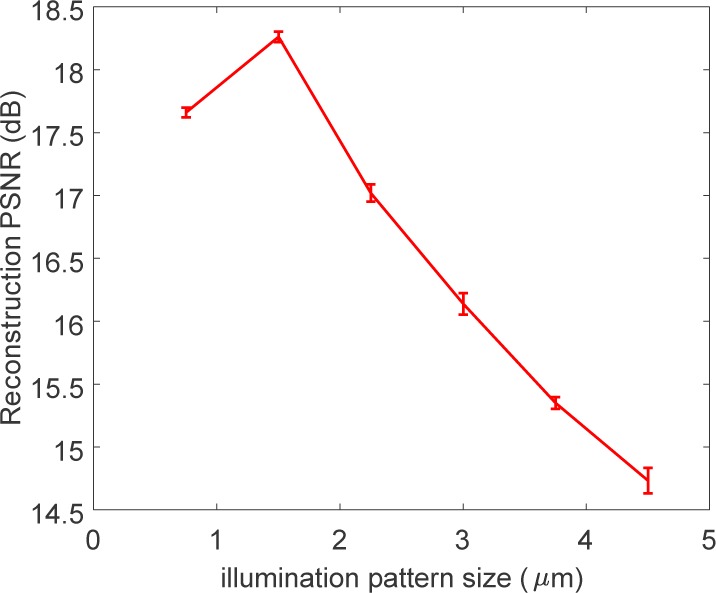
PSNR of the reconstructed images of the simulated moving beads dataset with different illumination pattern sizes, 0.75µm – 6µm. 10 trials are performed with different random masks.
4.3. Experimental results
4.3.1. Imaging of the “UCF” Logo
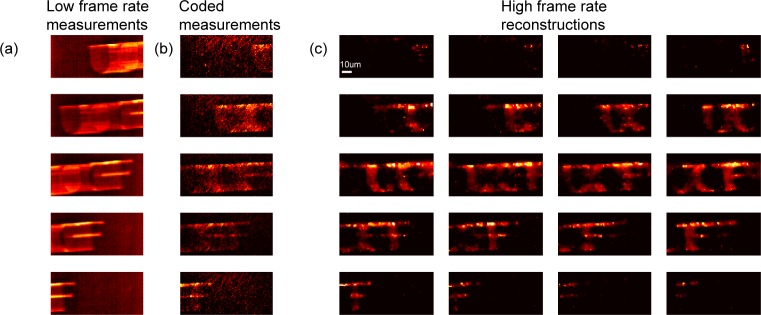
The experimental results are shown in Fig. 7. Figure 7(a) shows 5 frames of the measurement of the raw images without structured illumination. The “UCF” logo was translated at speed of 2mm/sec, and the period of the imaging sensor is 25ms. The sample travels 50µm within this time period. Each letter of the logo has a dimension roughly 50µm × 50µm. The letter is severely blurred because of the translational movement. Figure 7(b) shows another measurements of 5 frames. According to the simulation results shown in Fig. 6, the optimal pattern size is around 1.5µm for a microscope objective with 0.5NA. The mask pattern size is 6.5µm. With a demagnification factor of 5, the equivalent pattern size on the sample is 1.5µm, matching the simulation results. The step size of the mask movement is one feature size. The maximum stroke size of the piezo actuator is 40µm, to avoid the non-linearity we only used 27µm of the full travel range and demonstrated a compression ratio of 4, shown in Fig. 7(c). The reconstructed frame rate is 160 fps. The reconstructed frames can clearly resolve each letter in the logo.
Fig. 7.
Experimental reconstructions of the “UCF” logo with the hardware setup shown in Fig. 2. (a) Frames of the raw measurements without structured illumination at 40 frames/second, (b) Coded measurements with the structured illumination at 40 frames/second, (c) Reconstruction of high-speed frames at 160 frames/second.
4.3.2. Imaging of cell samples
The structured illumination temporal compression microscope is suitable to image microfluidic systems, especially in imaging flow cytometry and high-throughput droplet counting applications [3]. The flow speed of microfluidic system usually ranges from 1 µm−1 to 1 cm/sec [18], and to emulate such systems, we imaged a sequence of green fluorescence protein (GFP) labeled HeLa cells on a microscope coverslip translated at a speed of 20 µm/sec. The image acquisition time is 0.5 second. For this experiment, we used a higher NA microscope objective (Nikon, 20 × 0.75NA) to increase the collection efficiency. Figure 8 shows the reconstruction results. Due to the motion blur, the fluorescence signals from the two cells are indistinguishable at low frame rate, as shown in Fig. 8(b). At high frame rate reconstruction shown in Fig. 8(c), two cell nuclei can be identified. The compression ratio is 4:1. The average size of the cell nuclei is 10–15µm and the estimated flow speed is 18 µm/sec, which is in agreement with the experimental setup. It is worth noting that due to the limit of the illumination irradiance, one should not compare the current imaging speed with the commercialized imaging flow cytometry [21]. The structured illumination demonstrated here could serve a general method to be applied to the commercialized imaging system to improve the throughput.
Fig. 8.
Fluorescence imaging of two moving HeLa cells emulating imaging flow cytometry. (a) 20× microscope image of bright field (top) and fluorescence image (bottom). (b) Low frame rate (2 fps) measurement with structured illumination. (c) Image sequence reconstruction with high frame rate (8 fps). The circles with a diameter of 30µm were added in each frame to aid the visualization.
4.3.3. Imaging of the resolution target
In Section 2, we have mentioned that the temporal resolution can be extended despite of the low spatial bandwidth of the structured illumination, as long as the speed of the translation s is sufficiently high. Figure 9(a) shows the structured illuminated measurement of a USAF-1951 resolution target (Newport) under the bight field reflection geometry. In order to exclude the effect of motion blur, we keep the resolution target stationary during the capturing process. The reconstructed fames are shown in Fig. 9(b). The smallest feature in the resolution target has a line width of 2.2µm, which is close to the optimal feature size of our illumination pattern. From the zoomed-in figure and intensity profiles of the reconstructed images, Fig. 9(c), the line features can be clearly distinguished. Here the reader might notice the background pattern in the reconstructed images. The textures are caused by the limited variance of the illumination pattern rather than the reconstruction algorithm. Due to the stroke limit of the piezo actuator, during the four-step movement, certain area on the sample remains unilluminated, leaving certain block appears dark in the reconstruction. An improved illumination coding scheme would reduce this background texture.
Fig. 9.
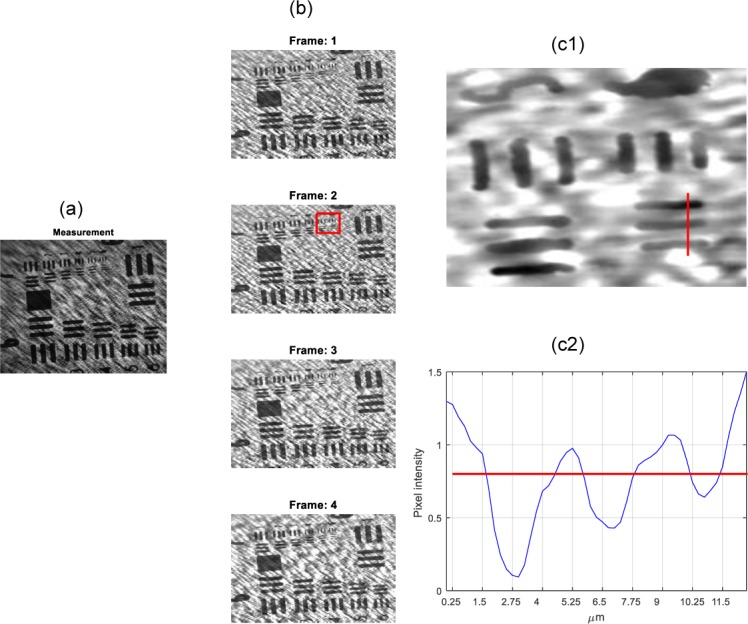
Reconstruction results of a static USAF-1951 resolution target. (a) Measurement from the experimental prototype in reflection mode. (b) The 4 reconstructed frames. (c) Zoom-in figure of the boxed area in (b). Notice that the highest resolution can be clearly identified from the intensity profile (c2).
5. Conclusion
We have reported a temporal compressive microscope system based on structured illumination. The source-side illumination coding scheme allows the reflection/emission photons collected by the full aperture of the microscope objective. The time-varying structured illumination aliased the high temporal frequency components into the low frame-rate measurements.
We proposed a block-wise smoothing estimator, which imposes a regularizer on the blocks of images according to the illumination feature size, rather than the size of the pixels. Via this algorithm, we can reconstruct the image with high fidelity as well as keeping image details. Though the simple analysis indicates that the coding size does not affect the temporal resolution, however, as our simulation and experimental results demonstrated that the frequency components of the illumination pattern does impact the reconstruction. On the one hand, if the mask pattern is finer than the point spread function of the objective, the contrast of the illumination will be reduced, resulting in a deteriorated reconstruction. On the other hand, if the over-sized mask pattern is used, the prior knowledge of the sample frequency distribution will not be able to recover the regions that are not illuminated by the opaque parts of the mask, leading to the errors in the reconstruction. According to the simulation results, we chose the illumination pattern size of 1.5µm for 0.5 NA microscope objective. It is worth noting that the current experimental system is limited to the imaging of 2-dimensional sample. The coding using an incoherent source loses the coding contrast out of the focus of the objective. Structured 3D coding device can be developed for temporally compressed depth resolved imaging in the future.
We have demonstrated a compression ratio of 4:1 in experiments. The system uses an incoherent light source, and requires minimal modification to an epi-illumination microscope. Such an imaging system could expand the applications in functional microscopy imaging and high-speed fluorescence readout module for microfluidic total analysis systems. Also, the structured illumination provides a degree of freedom in design at high frame rate. Depending on the application, the illumination pattern could be specifically engineered so that the most relevant biologically information will be extracted [22].
Acknowledgments
We would like to thank Aristide Dogariu from CREOL, University of Central Florida and Lap Man Lee from University of Michigan for their insightful discussions and help in the experimental setup. We would also like to thank Limei Chen and Karl Chai from School of Biomedical Science, University of Central Florida for providing the infected HeLa cell sample for imaging.
References and links
- 1.Buonomano D., “The biology of time across different scales,” Nat. Chem. Biol. 3(10), 594–597 (2007). 10.1038/nchembio1007-594 [DOI] [PubMed] [Google Scholar]
- 2.Hyeon C., Onuchic J. N., “Mechanical control of the directional stepping dynamics of the kinesin motor,” Proc. Natl. Acad. Sci., 104(44), 17382–17387 (2007). 10.1073/pnas.0708828104 [DOI] [PMC free article] [PubMed] [Google Scholar]
- 3.Kim M., Pan M., Gai Y., Pang S., Han C., Yang C., Tang S. K. Y., “Optofluidic ultrahigh-throughput detection of fluorescent drops,” Lab Chip 15(6), 1417–1423 (2015). 10.1039/C4LC01465K [DOI] [PubMed] [Google Scholar]
- 4.Llull P., Liao X., Yuan X., Yang J., Kittle D., Carin L., Sapiro G., Brady D. J., “Coded aperture compressive temporal imaging,” Opt. Express 21(9), 10526–10545 (2013). 10.1364/OE.21.010526 [DOI] [PubMed] [Google Scholar]
- 5.Gustafsson M. G., “Surpassing the lateral resolution limit by a factor of two using structured illumination microscopy,” J. Microsc. 198, 82–87 (2000). 10.1046/j.1365-2818.2000.00710.x [DOI] [PubMed] [Google Scholar]
- 6.Mertz J., “Optical sectioning microscopy with planar or structured illumination,” Nat. Methods 8, 811–819 (2011). 10.1038/nmeth.1709 [DOI] [PubMed] [Google Scholar]
- 7.Goodman J.W., Introduction to Fourier Optics, 3rd ed. (Roberts and Company Publishers, 2005). [Google Scholar]
- 8.Yuan X., Llull P., Liao X., Yang J., Brady D. J., Sapiro G., Carin L., “Low-cost compressive sensing for color video and depth,” in Proceedings of IEEE Conference on Computer Vision and Pattern Recognition, (Institute of Electrical and Electronics Engineers, Columbus, Ohio, 2014), pp. 3318–3325. [Google Scholar]
- 9.Hitomi Y., Gu J., Gupta M., Mitsunaga T., Nayar S.K., “Video from a single coded exposure photograph using a learned over-complete dictionary,” in Proceedings of IEEE Conference on Computer Vision, (Institute of Electrical and ElectronicsEngineers, Barcelona, Spain, 2011), pp. 287–294. [Google Scholar]
- 10.Reddy D., Veeraraghavan A., Chellappa R., “P2C2: Programmable pixel compressive camera for high speed imaging.,” in Proceedings of IEEE Conference on Computer Vision and Pattern Recognition, (Institute of Electrical and Electronics Engineers, Colorado, 2011), pp. 329–336. [Google Scholar]
- 11.Bioucas-Dias J., Figueiredo M., “A new TwIST: two-step iterative shrinkage/thresholding algorithms for image restoration,” IEEE Trans. Image Process. 16(12), 2992–3004 (2007). 10.1109/TIP.2007.909319 [DOI] [PubMed] [Google Scholar]
- 12.Yuan X., Jiang H., Huang G., Wilford P., “Lensless compressive imaging,” arXiv:1508.03498, (2015). [Google Scholar]
- 13.Yuan X., Jiang H., Huang G., Wilford P., “Compressive sensing via low-rank Gaussian mixture models,” arXiv:1508.06901, (2015). [Google Scholar]
- 14.Beck A., Teboulle M., “A fast iterative shrinkage-thresholding algorithm for linear inverse problems,” SIAM J. Img. Sci. 2(1), 183–202 (2009). 10.1137/080716542 [DOI] [Google Scholar]
- 15.Boyd S., Parikh N., Chu E., Peleato B., Eckstein J., “Distributed optimization and statistical learning via the alternating direction method of multipliers,” Found. Trends Mach. Learn. 3(1), 1–122 (2011). 10.1561/2200000016 [DOI] [Google Scholar]
- 16.Liao X., Li H., Carin L., “Generalized alternating projection for weighted-ℓ2,1 minimization with applications to model-based compressive sensing,” SIAM J. Img. Sci. 7(2), 797–823 (2014). 10.1137/130936658 [DOI] [Google Scholar]
- 17.Yang J., Yuan X., Liao X., Llull P., Sapiro G., Brady D. J., Carin L., “Video compressive sensing using Gaussian mixture models,” IEEE Trans. Image Process. 23(11), 4863–4878 (2014). 10.1109/TIP.2014.2344294 [DOI] [PubMed] [Google Scholar]
- 18.Squires T. M., Quake S. R., “Microfluidics Fluid physics at the nanoliter,” Rev. Mod. Phys. 77(3), 977–1026 (2005). 10.1103/RevModPhys.77.977 [DOI] [Google Scholar]
- 19.Jager W., Horiguchi Y., Shah J., Hayashi T., Awrey S., Gust K. M., Hadaschik B. A., Matsui Y., Anderson S., Bell R. H., Ettinger S., So A. I., Gleave M. E., Lee I., Dinney C. P., Tachibana M., McConkey D. J., Black P. C., “Hiding in plain view: genetic profiling reveals decades old cross contamination of bladder cancer cell line KU7 with HeLa,” J Urol. 190(4), 1404–1409 (2013). 10.1016/j.juro.2013.03.009 [DOI] [PMC free article] [PubMed] [Google Scholar]
- 20.Zhou J. H., Rosser C. J., Tanaka M., Yang M., Baranov E., Hoffman R. M., Benedict W.F., “Visualizing superficial human bladder cancer cell growth in vivo by green fluorescent protein expression,” Cancer Gene Ther. 9(8), 681–686 (2002). 10.1038/sj.cgt.7700489 [DOI] [PubMed] [Google Scholar]
- 21.George T. C., Basiji D., Hall B. E., Lynch D. H., Ortyn W. E., Perry D. J., Seo M. J., Zimmerman C., Morrissey P. J., “Distinguishing modes of cell death using the ImageStream multispectral imaging flow cytometer,” Cytometry. A 59, 237–245 (2004). 10.1002/cyto.a.20048 [DOI] [PubMed] [Google Scholar]
- 22.Studer V., Bobin J., Chahid M., Mousavi H. S., Candes E., Dahan M., “Compressive fluorescence microscopy for biological and hyperspectral imaging”, Proc. Natl. Acad. Sci. USA 109(26), E1679–E1687 (2012). 10.1073/pnas.1119511109 [DOI] [PMC free article] [PubMed] [Google Scholar]


