Abstract
Reconstructing and quantitatively assessing the internal architecture of opaque three-dimensional (3D) bioprinted hydrogel scaffolds is difficult but vital to the improvement of 3D bioprinting techniques and to the fabrication of functional engineered tissues. In this study, swept-source optical coherence tomography was applied to acquire high-resolution images of hydrogel scaffolds. Novel 3D gelatin/alginate hydrogel scaffolds with six different representative architectures were fabricated using our 3D bioprinting system. Both the scaffold material networks and the interconnected flow channel networks were reconstructed through volume rendering and binarisation processing to provide a 3D volumetric view. An image analysis algorithm was developed based on the automatic selection of the spatially-isolated region-of–interest. Via this algorithm, the spatially-resolved morphological parameters including pore size, pore shape, strut size, surface area, porosity, and interconnectivity were quantified precisely. Fabrication defects and differences between the designed and as-produced scaffolds were clearly identified in both 2D and 3D; the locations and dimensions of each of the fabrication defects were also defined. It concludes that this method will be a key tool for non-destructive and quantitative characterization, design optimisation and fabrication refinement of 3D bioprinted hydrogel scaffolds. Furthermore, this method enables investigation into the quantitative relationship between scaffold structure and biological outcome.
OCIS codes: (170.3880) Medical and biological imaging, (170.4500) Optical coherence tomography
1. Introduction
One of the major challenges in tissue engineering is developing suitable scaffolds that meet the requirements for application in regenerative medicine [1,2]. Three-dimensional (3D) bioprinting seems to be a promising method to fabricate porous scaffolds in a controllable manner with cell-loaded biomaterials, such as hydrogel [3–5]. Hydrogels have manifold potential applications for repairing and regenerating various tissues or organs because of their good biocompatibility, biodegradability, hydrophilicity and their ability to facilitate cell encapsulation [5–7]. However, there remain many challenges in the 3D bioprinting of hydrogels in predesigned geometries because of the poor mechanical properties and complex composition of hydrogels [7–9]. Further, the inner architectural features of a scaffold strongly affect cell behaviour and, in turn, the functionality of the engineered tissues [10,11]. Therefore, there is a need for a high-resolution imaging technique that can penetrate deeply and nondestructively into the 3D bioprinted hydrogel scaffolds.
Micro-CT is a commonly used technique to image the internal structure of a wide variety of tissue engineering scaffolds prior to use [12–15]. However, since the X-ray absorption-based contrast between hydrogel and culture media can be very low [16], imaging is often performed on freeze-dried samples or under dry conditions rather than under standard culture conditions. Therefore, micro-CT is unsuitable for imaging the internal structure of hydrogel scaffolds with high water content. Optical coherence tomography (OCT) is a promising technology that is able to offer real-time, detailed information on the 3D structure and composition of biological tissues at a depth of approximately 3 mm and at a resolution of 1–20 μm [17,18]. OCT depends on the scattering property of the sample rather than on fluorescent or ionizing radiation, which poses low risk in altering or changing the materials it images [19]. In fact, OCT has recently been applied for the evaluation of cell dynamics, constructs structure and tissue development in engineered tissue models that were fabricated by conventional methods [19–25]. For example, Rey et al. demonstrated that OCT is an effective means of visualizing 3D and 4D migration of Dictyostelium cells within low-density agarose gels [24]. Chen et al. have used OCT for non-destructive and quantitative assessment of cyclic acetal hydrogel scaffolds that were fabricated by the porogen-leaching method [25]. Conventional tissue engineering techniques are often process-dependent and incorporate unrepeatable, imprecise scaffold geometries [5, 26], whereas the current applications of OCT focus on the general quantitative features of a scaffold.
The 3D bioprinting technique can produce complex, well-defined and reproducible constructs in a layer-by-layer fashion through computer-aided design and manufacturing [27,28]. Moreover, previous studies have demonstrated that the multilevel internal structures and local morphological changes within a 3D scaffold enable the orderly incorporation of different cells and co-culture, thus guiding tissue regeneration in a controlled manner [29]. Therefore, it is essential to quantify local feature morphometric information of 3D bioprinted hydrogel scaffolds. A quantitative automatic imaging algorithm is especially preferred, because OCT imaging of 3D bioprinted hydrogel scaffolds can produce a large amount of data, and their manual analysis is both poor reproducibility and time-consuming [30,31]. Intensity segmentation has been applied to separate the pores and hydrogels in an OCT image automatically [25, 32]. However, for OCT imaging of 3D bioprinted hydrogel scaffolds, multiple isolated channels or pores with various curvatures and dimensions may appear on a single image. It is necessary to select and extract these isolated regions automatically to quantify the local feature morphometric information.
In this study, six distinct types of scaffold architecture were designed with predefined interconnected flow channel networks and produced using a gelatin/alginate-derived hydrogel based on our previously developed 3D bioprinting technique [6, 33]. Non-destructive imaging of the bioprinted scaffolds was conducted under standard culture condition using swept-source OCT (SS-OCT), and high-resolution images displayed the inner microstructures of the printed scaffolds in three dimensions. An image processing and analysis algorithm based on automatic selection of isolated regions of interest (ROIs) was developed to quantify both local and global various morphological features, such as pore size (PS), strut size (StS), pore shape factor (SF), specific surface area (Ssa), volume porosity (VP) and pore interconnectivity (PC). The differences between the designed models and the as-produced scaffolds were compared, and the effects of both the structural design and the 3D bioprinting process on the product were investigated.
2. Materials and methods
2.1 Scaffold design
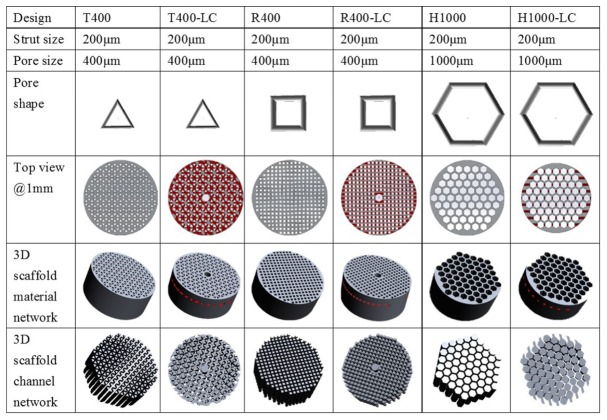
It has been found that the pore geometry influences the rate of cell migration, proliferation and differentiation on scaffolds [34,35]. Furthermore, the complex internal flow channel network is vital for sufficient nutrient and oxygen delivery, as well as for timely waste removal; all of these affect overall tissue function [36]. To engineer porous scaffolds and fabricate functional 3D tissue models, six distinct scaffolds prototypes were designed using the design software, Solidworks®. According to pore shape and channel network, the porous prototypes were classified as triangular prototypes (T), rectangular prototypes (R) or hexagonal prototypes (H) and internal laterally connected (LC) flow channel network (Fig. 1). The PS is defined as the diameter that circumscribes the pore geometry, and is designed to be 1000 μm for H and 400 μm for T and R. The LC was designed as a central cylindrical channel (1 mm diameter) with rectangular branches laterally connected to other pores at a defined depth of 1 mm (Fig. 1). All porous scaffold prototypes were designed with StS 200 μm in both the horizontal and vertical planes, and with height 5mm and diameter 12mm.
Fig. 1.
The designed 3D macroporous scaffolds. The key transverse section images are shown as a top view at a depth of 1mm measured from the surface of the hydrogel. The designed material networks and channel networks are given for comparison with the as-produced scaffolds. T triangular pore shape; R rectangular pore shape; H hexagonal pore shape.
2.2 3D bioprinted hydrogel scaffolds
The hydrogel material used for 3D bioprinting was a high-performance composite of gelatin and alginate. Gelatin (Tianjin green-island Company, type B, 96 kDa) and alginate (SIGMA, glucuronic acid 39%, 75–100 kDa) were each dissolved in deionized water to form a 10% gelatin and a 5% alginate solution (weight/volume, w/v); these were mixed 1:1 to make the hydrogel solution. The 3D scaffolds were fabricated by sequential fiber deposition using our 3D bioprinting system (3D-Bioprinter, Regenovo Corporation, Hangzhou, China), as described before [6, 33]. Custom-built software translated the CAD designs into a numerical code containing the information for the layer-by-layer construction of the scaffold. A refit pneumatical nozzle guided by a programmable controller was utilized to deposit the hydrogel material on a glass platform at a speed of 480 mm/min and a temperature of 8 °C. Once the whole scaffold was finished, the completed scaffold was submerged in a CaCl2 solution to complete the crosslinkages and promote solidification. The fabricated constructs were examined using a light microscope (Ti-U, Nikon, Japan).
2.3 Optical coherence tomography (OCT) imaging
This work utilized an SS-OCT system (OCTMI, OCT Medical Imaging Inc., Irvine, USA) to image 3D bioprinted hydrogel scaffolds [37]. The system used a compact swept-source laser operating at a swept rate of 50 kHz. The laser has a central wavelength of 1310nm and a spectrum bandwidth of 102 nm, yielding an axial resolution of 9.7 μm. The transverse resolution was 9.8 μm under a 5 × scanning objective. Approximately 12 mW of power illuminated the sample. During SS-OCT imaging, the 3D bioprinted hydrogel scaffold was mounted on a glass slide and immersed in the culture media D-PBS (AR0030, Wuhan Boster Co., Ltd, China) to maintain hydration and ensure sterility throughout imaging. For each imaging session, a region of 5 mm × 5 mm × 5 mm (512 × 512 × 512 pixels) was imaged without contact, and the starting-coordinates (x, y) and field of view (FOV) were recorded. The hydrogel and void regions were assumed to have the same refractive index, n = 1.33. The SS-OCT system’s sensitivity was 120 dB around the zero path difference.
2.4 Optical coherence tomography (OCT) image processing
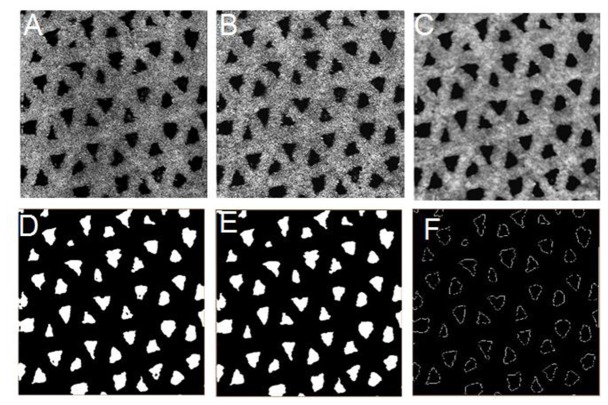
To quantitatively evaluate the OCT images, image processing was performed as follows: first, 3D reconstruction and visualization of cross-section (XZ) OCT image sequences were performed using a direct volume rendering algorithm. Subsequently, en face (XY) OCT images were extracted from the 3D images for automatic processing as shown in Fig. 2, which included 1) image enhancement optimization to highlight the contrast between the void area and the hydrogel backbone by adjusting the gamma value, image brightness and contrast; 2) low-pass filtering with a 5 × 5 median filter to reduce the speckle noise; 3) image binarization by an adaptive threshold segmentation to highlight the void region (the void region was represented as “1” or “0”); 4) morphological operations such as erosion and opening to smooth object contours and remove small objects in the pores of the binarized images; and 5) contour extraction to find the boundary and skeleton for each void region, and to quantify the diameters and areas. Finally, the processed en face OCT images were again reconstructed in 3D for other quantitative analysis.
Fig. 2.
Sequential methodology for the processing of SS-OCT images to quantify hydrogel scaffold microstructure. (A) raw en face image; (B) contrast-enhanced image; (C) median filtered image; (D) segmentation image; (E) morphologically opened image; (F) contour-extracted image.
2.5 Quantitative analysis of scaffold parameters
The StS, PS, SF were quantified using the processed en face OCT image sequences, and the Sa, VP and PC were quantified with the 3D processed images. To accurately measure local structural parameters, it is necessary to automatically identify and isolate sections (i.e., pores or channels) in the binarized images. This process was realized in Matlab with the functions “bwlabel” and “bwselect”. The function “bwlabel” ensure that each isolated ROI was coded with a unique index, which was based on the coordinates (X, Y) of the first point in the ROI, as shown in Fig. 3. Through the function “bwselect”, each ROI can be automatically selected and extracted with the label indices for further morphometric analysis.
Fig. 3.
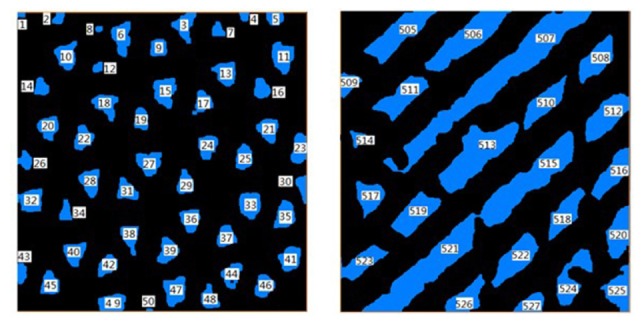
Automatic region selection (denoted by different number values), enabling analysis of each isolated region.
Using the abovementioned definition of PS, we used an equivalent diameter from the area to define its measurement, which can be expressed as
| (1) |
where PS is pore size, and Area is obtained by the function “bwarea” in Matlab.
SF was used to describe the morphology of the void region and was defined as
| (2) |
where P is the perimeter of a void region and is obtained by the function “bwperim” in Matlab. SF values of 1 represent round shape. SF can be used to automatically differentiate the pores and the lateral channels.
The lateral channel diameters (CDs) were measured from each en face image and were quantified according to
| (3) |
where is the minimal distance between the boundary (B) set and the skeleton (S) set of a channel. The function “bwmorph” in Matlab was used to obtain the B and S.
The StS for each ROI (I) was quantified by
| (4) |
where is the minimal distance from a specific ROI (I) to its adjacent ROI (J).
The VP was defined as the percent ratio of the volume of the void regions to the total volume:
| (5) |
where VP is the volume porosity, and is the volume of all void regions including the pores and the channels. is the total volume of the measured structure. A labeling function “bwlabeln” was used to automatically select and label the void regions in 3D.
Ssa was defined as the surface area of the void regions divided by the total volume of the structure, according to
| (6) |
where is the total surface area of all the pores and channels in the structure.
The PC was defined as the void volume fraction that can connect to outer spaces [25]:
| (7) |
where PC is pore interconnectivity, and is the void volume of a scaffold that is accessible from the outside through openings of a certain minimum size. The function “bwlabeln” in Matlab enables the automatic identification and colour-coding of regions that are spatially isolated or connected in 3D.
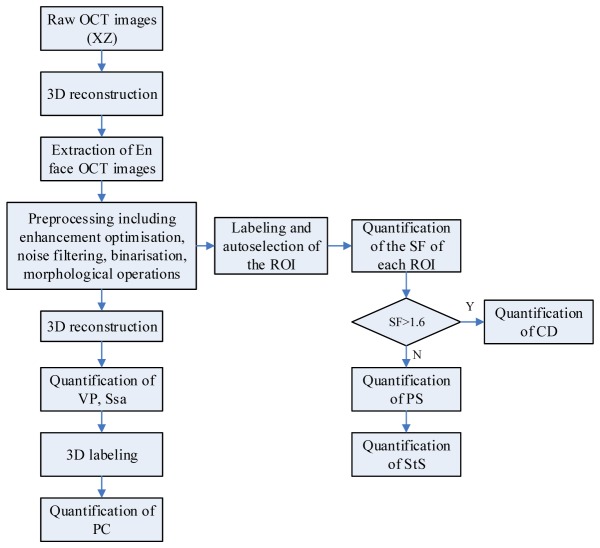
Figure 4 displays a general flow chart of the automatic imaging processing and analyzing procedure.
Fig. 4.
General flow chart of the automatic image processing and analyzing algorithm.
2.6 Statistical analysis
All quantified analysis was completed with 6 replicates. Statistical analysis was performed using one-way ANOVA. The statistical analysis results are shown as mean values and standard deviations.
3. Results
3.1 3D bioprinted hydrogel scaffolds and SS-OCT imaging
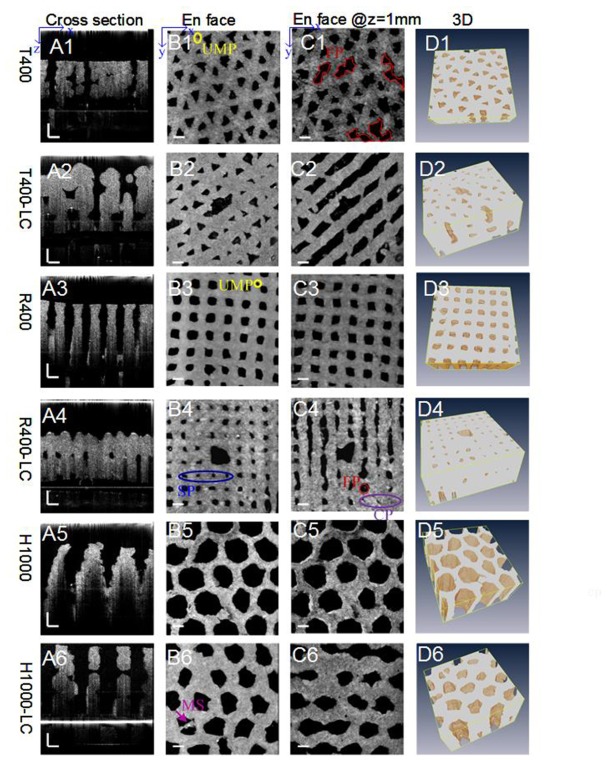
The 3D hydrogel scaffolds with predefined interconnected flow channel networks were successfully fabricated using our 3D bioprinting technique. The respective OCT images of six different scaffolds are shown in Fig. 5. As shown in the cross-sectional images (A1-A6) and en face images (B1-B6, C1-C6), the void regions, i.e. pores or channels (dark colour,) and material regions (grey-white colour) can be easily distinguished. The cross-sectional OCT images (A1–A6) shown that the effective image depth of 2-5mm was achieved. Differences in pore shape, size and location among different designed scaffolds can be qualitatively appreciated. En face OCT images @ 1mm (C1-C6) revealed changes in the size, shape and location of the pores within the scaffolds. The orientation, shape and width of the laterally connected branch channels can be clearly and intuitively observed in images C2, C4 and C6. 3D observations of the hydrogel polymer matrix segmented from OCT images are shown in D1–D6. All 3D images were analyzed using a depth range of 0–2 mm.
Fig. 5.
(A1–A6) Cross-sectional and (B1–B6) en face OCT images at the surface of the hydrogel scaffolds fabricated using different design parameters. (C1-C6) en face images were taken at a depth of 1 mm. (D1–D6) 3D observation of the hydrogel polymer matrix segmented from OCT images (see Visualization 1 (9.7MB, MOV) ). 3D images were analyzed using a depth range of 0–2mm. SP, the shrinkage of the superficial pores; FP, fused pores; UMP, undefined micropores; MS, the stacking of excessive materials; CP, closed pores. Scale bars are all 500 μm.
3.2 Pore shape and complex internal flow channel networks
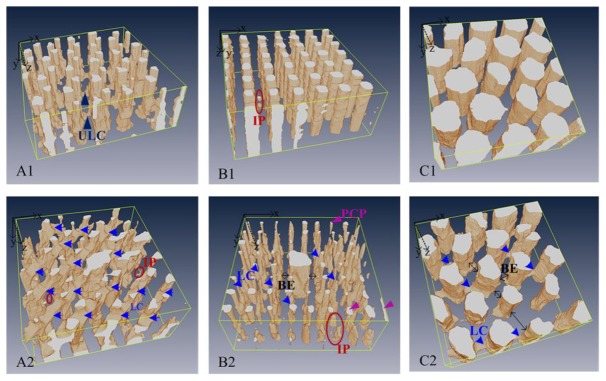
2D OCT en face images (Fig. 5(B1)–5(B6), 5(C1)–5(C6)) were used to visualize pore shape and planar defects in the horizontal plane at different depths. The complex flow channel networks of these scaffolds were visualized in Fig. 6 by 3D OCT imaging and segmented binarization. Compared to the designed models shown in Fig. 1, the printed flow channel networks contain independent channels such as pores without access to the outside (R400, T400-LC, Fig. 6(B1), 6(A2)), blind ends to which the central cylinder channels cannot extend (R400-LC, H1000-LC, Fig. 6(B2)–6(C2)), and deformed channels whose cross-sectional area changes along their length (T400, T400-LC, R400-LC, H1000-LC, Fig. 6(A1), 6(A2)–6(C2)). Also observed were some partially connected pores (R400-LC, Fig. 6(B2)) and some unexpected lateral connectivity (T400, Fig. 6(A1)). None of these stereo differences could be found by analysis in 2D for planar defects.
Fig. 6.
The internal pore structure and flow channel networks of the six different scaffolds acquired from OCT images (see Visualization 2 (9.7MB, MOV) ). LC, lateral connectivity; PCP, partially connected pores; ULC, undefined lateral connectivity; BE, blind ends; IP, inaccessible pores.
3.3 Quantification of the scaffold parameters
To quantitatively assess the accuracy of the calculation algorithm, we applied this algorithm to the PS calculation on the surface of a R400 scaffold. By comparing the computer calculated results with manual and microscopy measurements, the performance of the algorithm was validated. Figure 7(a) shows one representative en face OCT image (XY) of R400 scaffold, with the associated segmented image shown in Fig. 7(b). Figure 7(c) shows a digital phase contrast microscopy image of the same scaffold on the part of the same region. Figure 7(d), 7(e) and 7(f) show the histogram of the corresponding estimation of PS in Fig. 7(a), 7(b) and 7(c). The computer algorithm estimated the PS to be 348.3 ± 38.9 μm. A human observer measured the diameter directly from the same OCT images, and result in 341.2 ± 34.2μm. The computer analysis result shows a slightly larger variance since the PS is averaged from all boundary pixel measurements, while the human observer only selects few edge pixels to quantify the PS. Figure 7(f) shows the measured diameter based on microscopy is 333.5 ± 10.5 μm. The relatively larger standard deviation from the computer algorithm compared to digital microscopy is due to OCT imaging system has lower resolution (10 μm) compared to that of digital microscopy (~1 μm). However, it has to be pointed out that digital microscopy can only image the surface pores other than the internal pores of 3D bioprinted hydrogel scaffolds.
Fig. 7.
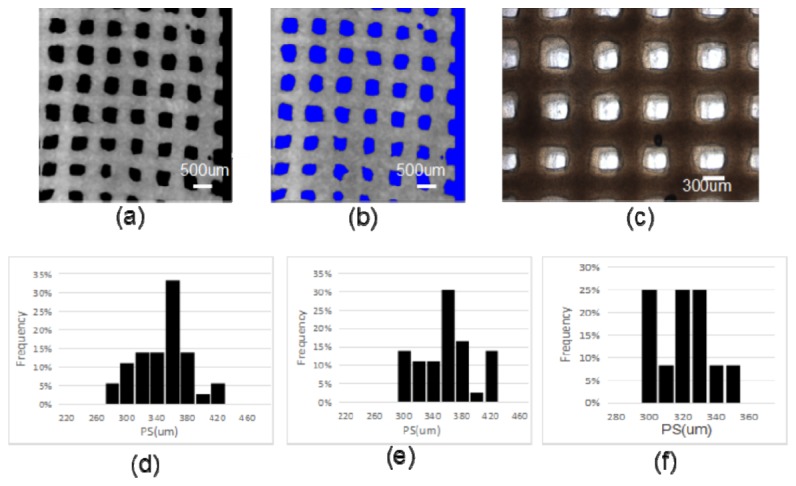
(a) a representative en face OCT image (XY) of R400 scaffold; (b) corresponding segmented image of (a), void region is highlighted by blue color; (c) a digital phase-contrast microscopy image of the same scaffold on the part of the same region. (d) Histogram of the estimated PS from the en face OCT image (a) by computer analysis with our proposed algorithm; (e) Histogram of the estimated PS from the same OCT image by a human observer; (f) Histogram of the estimated PS from the microscopy image (c).
The PS, SF and StS of the pores, along with the lateral CDs of each hydrogel scaffold, were quantified from labelled ROIs of the en face OCT image stacks; the results are summarized in Fig. 8. The mean values for PS, SF, StS, CD, VP, PC, surface area and Ssa were also calculated (Table 1).
Fig. 8.
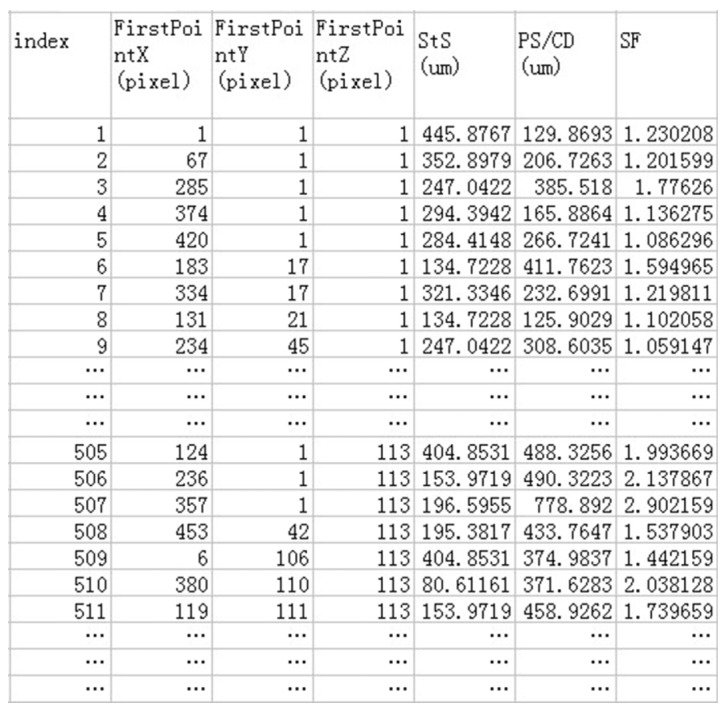
The respective quantitative results of the PS, SF, StS, and CD of a scaffold.
Table 1. Structure characterization results for the six different scaffold designs.
| Scaffold | T400 | T400-LC | R400 | R400-LC | H1000 | H1000-LC |
|---|---|---|---|---|---|---|
| PS (μm) | 362.3 ± 71.0 | 282.1 ± 62.1 | 327.8 ± 75.4 | 195.7 ± 53.4 | 777.8 ± 95.5 | 724.5 ± 58.9 |
| Center PS(μm) | 0 | 768.4 ± 9.9 | 0 | 810.5 ± 16.2 | 0 | 798.8 ± 6.1 |
| CD (μm) | 0 | 365.4 ± 15.8 | 0 | 352.7 ± 16.7 | 346.4 ± 13.5 | |
| StS (μm) | 291.5 ± 13.0 | 310.2.9 ± 17.7 | 335.4 ± 11.4 | 433.1 ± 21.3 | 284.8 ± 17.4 | 331.8 ± 32.1 |
| SF() | 1.463 ± 0.370 | 1.454 ± 0.216 | 1.302 ± 0.134 | 1.363 ± 0.328 | 1.153 ± 0.191 | 1.305 ± 0.171 |
| VP(%) | 17.92 ± 5.71 | 23.49 ± 2.42 | 24.26 ± 4.03 | 13.50 ± 2.64 | 46.89 ± 3.05 | 30.23 ± 1.68 |
| PC (%) | 99.50 ± 0.31 | 99.35 ± 0.42 | 99.87 ± 0.18 | 91.02 ± 0.04 | 99.96 ± 0.01 | 99.82 ± 0.11 |
| Surface(mm2) | 373.3 ± 21.6 | 366.99 ± 24.2 | 317.65 ± 15.2 | 304.15 ± 13.6 | 317.18 ± 7.6 | 278.08 ± 11.31 |
| Ss(mm-1) | 7.598 ± 2.010 | 7.470 ± 1.468 | 6.465 ± 1.001 | 6.191 ± 0.767 | 6.456 ± 0.871 | 5.66 ± 1.069 |
(Measured values: mean ± 95% confidence)
VP is an important factor for scaffolds for functional tissue formation since pores allow transport of nutrition, oxygen and waste, migration and proliferation of cells as well as vascularization [33,35]. For scaffolds fabricated using different predesigned geometries, the calculated VPs are 17.92% ± 5.71% for T400, 23.49% ± 2.42% for T400-LC, 24.26% ± 4.03% for R400, 13.50% ± 2.64% for R400-LC, 46.89% ± 3.05% for H1000, and 30.23% ± 1.68% for H1000-LC, respectively. The VP of each construct is predefined in sequence as 23.3%, 30.5%, 25.0%, 32.8%, 60.6%, and 65.2%. It is observed that VPs calculated by OCT were constantly 23% lower than the predefined value. A likely explanation is that the hydrogels swell during and after fabrication, which would compress the pore space. Porosity analysis revealed that VP strongly depended on PS, with larger pores corresponding to higher VP. Although the construction of lateral branch channels benefit the increase in the number of pores, VPs did not always become higher due to the internal pore collapse.
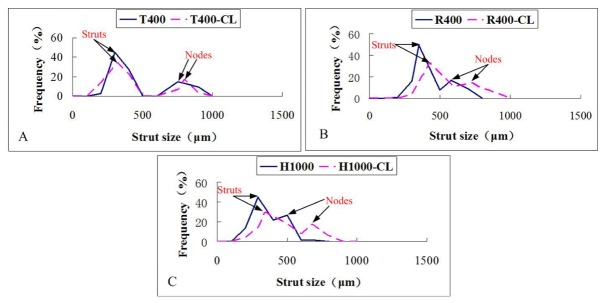
Figure 9 and Fig. 10 show respectively the StS, PS distribution of the 3D bioprinted hydrogel scaffolds with different designs. As shown in Fig. 9, the StS distribution of almost all scaffolds showed two different peaks. The first one represents the StS, while the second one is representative of the nodes size. The node is the intersection of several deposited strands. The larger the node diameter, the more difficult it is for the cells in the centre of the nodes to access the nutrition.
Fig. 9.
StS distributions assessed by 2D en face OCT image analysis of the six different as-produced scaffolds (n = 6).
Fig. 10.
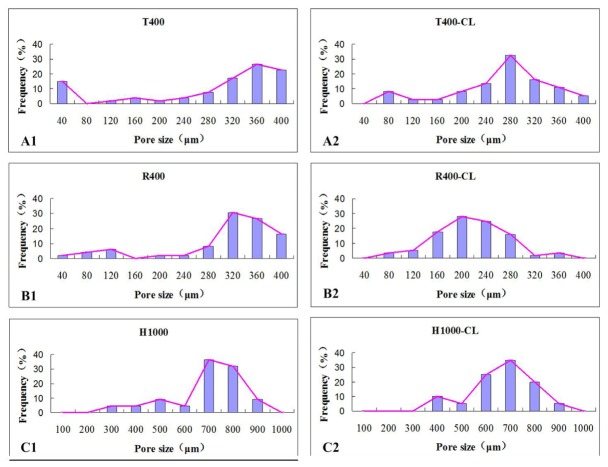
PS distributions assessed by 2D en face OCT image analysis of the six different as-produced scaffolds (n = 6).
Figure 10 showed that the PS distribution was not uniform, and only one distinguished peak appeared on each profile. The peak represents the average pore size in the XY plane.
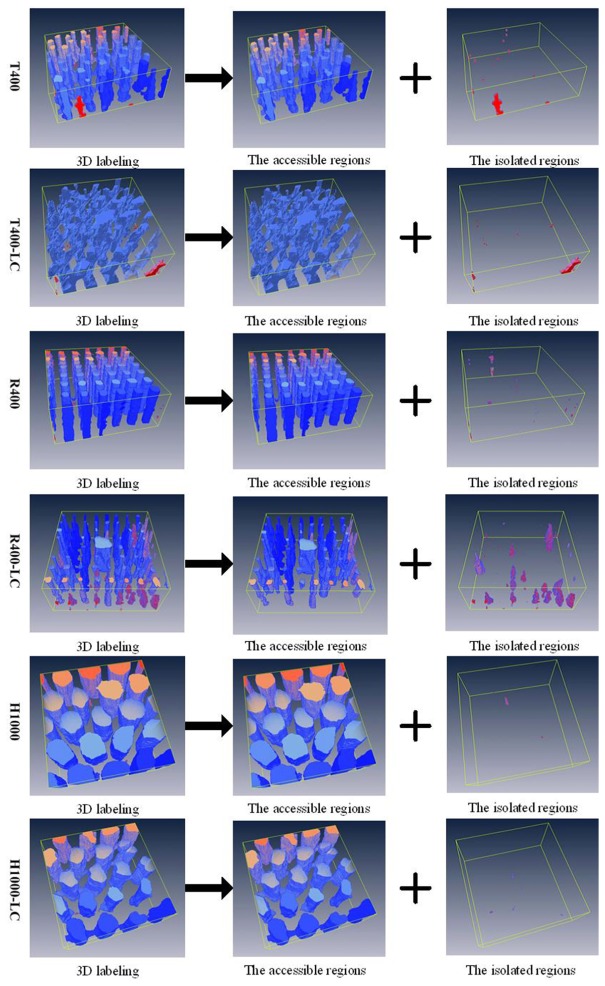
PC analysis through the 3D labeling process can provide information about cell growth, and about the diffusion of nutrients and waste products into and out of the scaffolds [36,38]. Figure 11 shows the representative PC analysis of each scaffold design through the decomposed channel networks. The channel networks were decomposed in reference to the connectivity with the outside. Groups without access to the outside were defined as the isolated region, and the accessible region is the channels that can be well connected to the outer space and to each other. Analysis of PC revealed high levels of interconnectivity for any type of scaffold produced by 3D bioprinting, ranging from 91.1% to nearly 100% (Table 1).
Fig. 11.
Decomposition of channel networks with respect to the connectivity with outside (see Visualization 3 (9.7MB, MOV) ).
4. Discussion
Reconstructing and assessing the internal architecture of hydrogel scaffolds is vital to the improvement of 3D bioprinting techniques and to the fabrication of functional engineered tissues. However, the opaque appearance [39] of hydrogels caused by high levels of light scattering presents challenges to investigating the internal structure of 3D bioprinted scaffolds. OCT was employed in the present study to assess and reconstruct the architecture of 3D bioprinted gelatin/alginate hydrogel scaffolds to a resolution of 10 μm. This allowed us to clearly distinguish the boundary between hydrogels and void regions (Fig. 5). And we were able to image up to 2-5mm deep in the 3D bioprinted hydrogel scaffolds, which was enough to detect the internal channels. The high acquisition speed (50k A-lines per second, video rate) of SS-OCT enabled real-time imaging in 3D, which is ideal for revealing the relationships between the various dynamic structural features of the scaffolds and their functions. OCT’s ability to image without contact allows sterile evaluation of the 3D structures of the designed materials.
OCT image quality, however, is reduced by speckle noise and low contrast, which makes it very difficult to use the original OCT images to accurately and objectively assess the scaffold microstructure. An intensity-based segmentation algorithm, or median filter, has been used to improve the quality of OCT images, however, the image edge information has also been smoothed [25,40]. Image processing (Fig. 2), including enhancement optimisation, noise filters, binarization, morphological opening and erosion, and contour extraction, was applied here to improve the quantification accuracy. 3D OCT image acquisition and volumetric rendering allowed reconstruction of the internal porous structure and channel networks (Fig. 6), revealed the interconnectivity of channels (Fig. 11), distinguished the geometric differences from the designed models (Fig. 1 and Fig. 5), and clearly identified printing defects in both 2D and 3D (Fig. 5 and Fig. 6). Together, this enabled in-depth understanding of the 3D bioprinting process and product, and provided a base for morphometric analysis with high precision and accuracy.
Quantification of spatially-resolved morphometric information of 3D bioprinted scaffolds is essential to facilitate the detailed investigation of the relationship between the design models and the as-produced constructs, and the effects of the scaffold structure on the ultimate biological outcome. Chen et al. adapted a 3D labeling and erosion method to assess the PC and PS [25], but only provided the statistical information. An analysis algorithm based on the automatic selection of isolated ROIs (Fig. 3) was developed to quantify spatially-resolved local features. This approach enables the automatic selection and labeling of individual ROIs, thus the location and morphometric analyses of the selected ROI could be performed, including the measurement of diameter, SF and area. We were able to automatically quantify the PS, StS, SF, VP, Ssa and PC, which are important architectural parameters that affect the biological outcome.
Prior studies have found defects such as tip breakage, hydrogel swelling and significant deformation during the 3D bioprinting process [5–7, 41]. Here, in addition to detecting the internal pore fusion caused by the strut fracture (Fig. 5(C1)), the presence of undefined micropores (Fig. 5(B1) and 5(B2)) and closed pores (R400-LC, Fig. 5(C4)), and the stacking of excessive material at undefined locations (Fig. 5(B6)), we were able to provide quantitative location and dimension information. We were also able to specify the deposited strand dimensions because we could control the physical properties of the gelatin/alginate hydrogel and the machine’s operating parameters, such as the applied pressure, the printing temperature, the XY printing speed, and the needle type and diameter. Quantitative analysis of StS (Table 1) and its distribution (Fig. 8) suggests that the optimisation of the printing route near the nodes would ensure better uniformity in the strut. Morphometric analysis of the as-produced scaffolds enables quantitative feedback to improve the stability and controllability of hydrogel processing.
Through PS distribution analysis and 2D planar defect detection, we identified cell cavities with a diameter of 40 μm (Fig. 5(B1) and Fig. 10(A1)), which is far smaller than the designed PS and beyond the resolution limit of our 3D bioprinting system. We also found that excessive material accumulating at undefined locations can divide a large pore into two smaller ones, called “half pores” (Fig. 5(B6) and Fig. 10(C2)). The present study defined the location of the cell cavities and quantified their size and proportion. Understanding the quantitative labeling of the geometrical control errors associated with fabrication procedures will facilitate the manipulation of 3D bioprinting defects to obtain different combinations of PS. A recent study found that 40 μm micropores produce a microscale texture, which can alter spreading of the cell membrane and affect the interdigitation of the membrane within the scaffold [42]. S. Van Bael et al. [11] found that changes in PS significantly influences the growth and differentiation of cells in a scaffold. Analysis of and control over PS may provide a new method for designing and fabricating more complex functionally graded scaffolds.
Both the defect analysis (Fig. 5(C4) and Fig. 6(B2)) and the PC analysis (via the 3D labeling process) clearly show that the R400-LC scaffolds contain a significant number of isolated pores and blind ends. These results indicate that the structural stability of scaffolds with square pores is inferior to those with triangular or hexagonal pores, in that the reduction in scaffold stiffness induces a higher incidence of channel collapse and pore occlusion. Adjusting the geometrical design of a 3D bioprinted hydrogel scaffold offers a potential approach to obtain the desired properties, such as pore interconnectivity and homogeneity. The principle and advantages of bio-CAD modelling, along with its possible applications to tissue engineering, were reviewed by Sun et al. [43] in 2005 and Giannitelli [2] in 2014. However, this methodology has not yet been intensively explored in the case of tailored hydrogel scaffolds or soft tissue engineering.
The spatially-resolved morphometric information provides a base for studying the relationship between scaffold structures and biological outcome. For example, we have reconstructed the channel networks and quantified the CD, surface area, and Ssa of different channels; this allows investigation into how these parameters would influence local fluid flow and shear stress, both of which affect the long-term preservation of specific functions of a micro-organoid. Quantification of surface area, Ssa and VP may also be used to study the correlation between these parameters and the total metabolic activity of all cells in a scaffold. Multi-modality imaging systems that can provide different but complementary information would be an effective and powerful tool for furthering the investigation of the structure–function interactions [16, 19, 25, 44]. For example, Doppler OCT allows for simultaneous imaging of the local fluid flow, shear stress and scaffold porous architecture. The integration of OCT with multiphoton microscopy has the ability of imaging structural and functional information of cells in the engineered tissues.
It must be mentioned that the proposed method still has some limitations for the assessment of 3D bioprinted hydrogel scaffolds. Firstly, we just measured the PS, StS and lateral CD of transverse sections (XY) according to the deposited direction (Z) of 3D bioprinting. Multi-dimension measurement in 3D would provide more accurate stereo channel dimensions. The algorithm based on cylinder fitting would be more elegant to measure the stereo channel dimensions because the channels have more similarity in shape with the cylinders. Secondly, the limited scanning range (5 mm × 5 mm × 5 mm) of OCT could introduce measurement error, especially for the peripheral pores, though further improvement of the en face imaging range (XY) promises to reduce these errors. The combination of multi-regional scanning and image-stitching algorithms would be the optional way to resolve the limitations.
5. Conclusions
The present study fabricated six representative design geometries using a gelatin/alginate-derived hydrogel based on our previously developed 3D bioprinting technique. SS-OCT was applied for high-resolution imaging of 3D bioprinted hydrogel scaffolds in real time, non-destructive manner. An automatic image analysis algorithm was developed to provide both holistic and local feature morphometric information, including PS, StS, CD, VP, Ssa, PC, and distributions of PS and StS. Both the internal material networks and flow channel networks were reconstructed to provide a 3D volumetric view. The fabrication defects and the detailed differences between the designed and as-produced models were analyzed and assessed in both 2D and 3D. This work proves that our method is able to quantitatively visualize the microstructure of 3D bioprinted hydrogel scaffolds. OCT’s ability to provide 3D high-resolution spatially-resolved information reveals its potential for evaluating the effects of 3D plotting conditions on structure parameters and for feedback controlling the dimensional accuracy of 3D scaffolds. It also reveals potential for utilization in optimizing design to obtain desired properties, and investigating the quantitative relationship between scaffold structure and function. Future work can focus on studying which of the scaffold characteristics will most likely lead to the successful growth of bioengineered tissues. The development of an OCT-integrated system, such as OCT with two-phone microscopy, holds promise for assessing the structural and functional properties of 3D bioprinted cell-scaffold constructs and for cross-validating.
Acknowledgments
The authors acknowledge the funding support of the Chinese National Natural Science Foundation through projects 61108083 and 81371695.
References and links
- 1.Hollister S. J., “Porous scaffold design for tissue engineering,” Nat. Mater. 4(7), 518–524 (2005). 10.1038/nmat1421 [DOI] [PubMed] [Google Scholar]
- 2.Giannitelli S. M., Accoto D., Trombetta M., Rainer A., “Current trends in the design of scaffolds for computer-aided tissue engineering,” Acta Biomater. 10(2), 580–594 (2014). 10.1016/j.actbio.2013.10.024 [DOI] [PubMed] [Google Scholar]
- 3.Schuurman W., Khristov V., Pot M. W., van Weeren P. R., Dhert W. J. A., Malda J., “Bioprinting of hybrid tissue constructs with tailorable mechanical properties,” Biofabrication 3(2), 021001 (2011). 10.1088/1758-5082/3/2/021001 [DOI] [PubMed] [Google Scholar]
- 4.Shim J. H., Kim J. Y., Park M., Park J., Cho D. W., “Development of a hybrid scaffold with synthetic biomaterials and hydrogel using solid freeform fabrication technology,” Biofabrication 3(3), 034102 (2011). 10.1088/1758-5082/3/3/034102 [DOI] [PubMed] [Google Scholar]
- 5.Billiet T., Vandenhaute M., Schelfhout J., Van Vlierberghe S., Dubruel P., “A Review of trends and limitations in hydrogel-rapid prototyping for tissue engineering,” Biomaterials 33(26), 6020–6041 (2012). 10.1016/j.biomaterials.2012.04.050 [DOI] [PubMed] [Google Scholar]
- 6.Xu M., Wang X., Yan Y., Yao R., Ge Y., “An cell-assembly derived physiological 3D model of the metabolic syndrome, based on adipose-derived stromal cells and a gelatin/alginate/fibrinogen matrix,” Biomaterials 31(14), 3868–3877 (2010). 10.1016/j.biomaterials.2010.01.111 [DOI] [PubMed] [Google Scholar]
- 7.Wang X., Yan Y., Pan Y., Xiong Z., Liu H., Cheng J., Liu F., Lin F., Wu R., Zhang R., Lu Q., “Generation of three-dimensional hepatocyte/gelatin structures with rapid prototyping system,” Tissue Eng. 12(1), 83–90 (2006). 10.1089/ten.2006.12.83 [DOI] [PubMed] [Google Scholar]
- 8.Fedorovich N. E., De Wijn J. R., Verbout A. J., Alblas J., Dhert W. J. A., “Three-dimensional fiber deposition of cell-laden, viable, patterned constructs for bone tissue printing,” Tissue Eng. Part A 14(1), 127–133 (2008). 10.1089/ten.a.2007.0158 [DOI] [PubMed] [Google Scholar]
- 9.Billiet T., Gevaert E., De Schryver T., Cornelissen M., Dubruel P., “The 3D printing of gelatin methacrylamide cell-laden tissue-engineered constructs with high cell viability,” Biomaterials 35(1), 49–62 (2014). 10.1016/j.biomaterials.2013.09.078 [DOI] [PubMed] [Google Scholar]
- 10.Melchels F. P. W., Barradas A. M. C., van Blitterswijk C. A., de Boer J., Feijen J., Grijpma D. W., “Effects of the architecture of tissue engineering scaffolds on cell seeding and culturing,” Acta Biomater. 6(11), 4208–4217 (2010). 10.1016/j.actbio.2010.06.012 [DOI] [PubMed] [Google Scholar]
- 11.Van Bael S., Chai Y. C., Truscello S., Moesen M., Kerckhofs G., Van Oosterwyck H., Kruth J. P., Schrooten J., “The effect of pore geometry on the in vitro biological behavior of human periosteum-derived cells seeded on selective laser-melted Ti6Al4V bone scaffolds,” Acta Biomater. 8(7), 2824–2834 (2012). 10.1016/j.actbio.2012.04.001 [DOI] [PubMed] [Google Scholar]
- 12.Potter K., Sweet D. E., Anderson P., Davis G. R., Isogai N., Asamura S., Kusuhara H., Landis W. J., “Non-destructive studies of tissue-engineered phalanges by magnetic resonance microscopy and X-ray microtomography,” Bone 38(3), 350–358 (2006). 10.1016/j.bone.2005.08.025 [DOI] [PubMed] [Google Scholar]
- 13.Kerckhofs G., Sainz J., Wevers M., Van de Putte T., Schrooten J., “Contrast-enhanced nanofocus computed tomography images the cartilage subtissue architecture in three dimensions,” Eur. Cell. Mater. 25, 179–189 (2013). [DOI] [PubMed] [Google Scholar]
- 14.Yang Y., Dorsey S. M., Becker M. L., Lin-Gibson S., Schumacher G. E., Flaim G. M., Kohn J., Simon C. G., Jr., “X-ray imaging optimization of 3D tissue engineering scaffolds via combinatorial fabrication methods,” Biomaterials 29(12), 1901–1911 (2008). 10.1016/j.biomaterials.2007.12.042 [DOI] [PMC free article] [PubMed] [Google Scholar]
- 15.Yue S., Lee P. D., Poologasundarampillai G., Yao Z., Rockett P., Devlin A. H., Mitchell C. A., Konerding M. A., Jones J. R., “Synchrotron X-ray microtomography for assessment of bone tissue scaffolds,” J. Mater. Sci. Mater. Med. 21(3), 847–853 (2010). 10.1007/s10856-009-3888-9 [DOI] [PubMed] [Google Scholar]
- 16.Appel A. A., Anastasio M. A., Larson J. C., Brey E. M., “Imaging challenges in biomaterials and tissue engineering,” Biomaterials 34(28), 6615–6630 (2013). 10.1016/j.biomaterials.2013.05.033 [DOI] [PMC free article] [PubMed] [Google Scholar]
- 17.Huang D., Swanson E. A., Lin C. P., Schuman J. S., Stinson W. G., Chang W., Hee M. R., Flotte T., Gregory K., Puliafito C. A., Fujimoto J. G., “Optical coherence tomography,” Science 254(5035), 1178–1181 (1991). 10.1126/science.1957169 [DOI] [PMC free article] [PubMed] [Google Scholar]
- 18.Fujimoto J., Drexler W., “Introduction to Optical Coherence Tomography,” in Optical Coherence Tomography, Drexler W., Fujimoto J., eds. (Springer; Berlin Heidelberg, 2008), pp. 1–45. [Google Scholar]
- 19.Liang X., Graf B. W., Boppart S. A., “Imaging engineered tissues using structural and functional optical coherence tomography,” J. Biophotonics 2(11), 643–655 (2009). 10.1002/jbio.200910048 [DOI] [PMC free article] [PubMed] [Google Scholar]
- 20.Zheng K., Rupnick M. A., Liu B., Brezinski M. E., “Three dimensional OCT in the engineering of tissue constructs: a potentially powerful tool for assessing optimal scaffold structure,” Open Tissue Eng. Regen. Med. J. 2(1), 8–13 (2009). 10.2174/1875043500902010008 [DOI] [PMC free article] [PubMed] [Google Scholar]
- 21.Levitz D., Hinds M. T., Choudhury N., Tran N. T., Hanson S. R., Jacques S. L., “Quantitative characterization of developing collagen gels using optical coherence tomography,” J. Biomed. Opt. 15(2), 026019 (2010). 10.1117/1.3377961 [DOI] [PubMed] [Google Scholar]
- 22.Tan W., Oldenburg A. L., Norman J. J., Desai T. A., Boppart S. A., “Optical coherence tomography of cell dynamics in three-dimensional tissue models,” Opt. Express 14(16), 7159–7171 (2006). 10.1364/OE.14.007159 [DOI] [PubMed] [Google Scholar]
- 23.Liu M. J. J., Chou S. M., Chua C. K., Tay B. C. M., Ng B. K., “The development of silk fibroin scaffolds using an indirect rapid prototyping approach: morphological analysis and cell growth monitoring by spectral-domain optical coherence tomography,” Med. Eng. Phys. 35(2), 253–262 (2013). 10.1016/j.medengphy.2011.09.029 [DOI] [PubMed] [Google Scholar]
- 24.Rey S. M., Povazay B., Hofer B., Unterhuber A., Hermann B., Harwood A., Drexler W., “Three- and four-dimensional visualization of cell migration using optical coherence tomography,” J. Biophotonics 2(6-7), 370–379 (2009). 10.1002/jbio.200910027 [DOI] [PubMed] [Google Scholar]
- 25.Chen C. W., Betz M. W., Fisher J. P., Paek A., Chen Y., “Macroporous Hydrogel Scaffolds and Their Characterization By Optical Coherence Tomography,” Tissue Eng. Part C Methods 17(1), 101–112 (2011). 10.1089/ten.tec.2010.0072 [DOI] [PubMed] [Google Scholar]
- 26.Park S., Kim G., Jeon Y. C., Koh Y., Kim W., “3D polycaprolactone scaffolds with controlled pore structure using a rapid prototyping system,” J. Mater. Sci. Mater. Med. 20(1), 229–234 (2009). 10.1007/s10856-008-3573-4 [DOI] [PubMed] [Google Scholar]
- 27.Seyednejad H., Gawlitta D., Kuiper R. V., de Bruin A., van Nostrum C. F., Vermonden T., Dhert W. J. A., Hennink W. E., “In vivo biocompatibility and biodegradation of 3D-printed porous scaffolds based on a hydroxyl-functionalized poly(ε-caprolactone),” Biomaterials 33(17), 4309–4318 (2012). 10.1016/j.biomaterials.2012.03.002 [DOI] [PubMed] [Google Scholar]
- 28.Seyednejad H., Gawlitta D., Dhert W. J. A., van Nostrum C. F., Vermonden T., Hennink W. E., “Preparation and characterization of a three-dimensional printed scaffold based on a functionalized polyester for bone tissue engineering applications,” Acta Biomater. 7(5), 1999–2006 (2011). 10.1016/j.actbio.2011.01.018 [DOI] [PubMed] [Google Scholar]
- 29.Yamada M., Utoh R., Ohashi K., Tatsumi K., Yamato M., Okano T., Seki M., “Controlled formation of heterotypic hepatic micro-organoids in anisotropic hydrogel microfibers for long-term preservation of liver-specific functions,” Biomaterials 33(33), 8304–8315 (2012). 10.1016/j.biomaterials.2012.07.068 [DOI] [PubMed] [Google Scholar]
- 30.LaCroix J. T., Xia J., Haidekker M. A., “A fully automated approach to quantitatively determine thickness of tissue-engineered cell sheets,” Ann. Biomed. Eng. 37(7), 1348–1357 (2009). 10.1007/s10439-009-9694-1 [DOI] [PMC free article] [PubMed] [Google Scholar]
- 31.Bonnema G. T., Cardinal K. O., Williams S. K., Barton J. K., “An automatic algorithm for detecting stent endothelialization from volumetric optical coherence tomography datasets,” Phys. Med. Biol. 53(12), 3083–3098 (2008). 10.1088/0031-9155/53/12/001 [DOI] [PubMed] [Google Scholar]
- 32.A. Paek, M. W. Betz, J. Jiang, A. Cable, J. P. Fisher, and Y. Chen, “Quantitative Assessment of Macroporous Cell Scaffold Structures using Optical Coherence Tomography (OCT),” 2009 IEEE/NIH Life Science Systems and Applications Workshop. (IEEE, 2009), pp. 170–172. 10.1109/LISSA.2009.4906737 [DOI] [Google Scholar]
- 33.Xu M., Li Y., Suo H., Yan Y., Liu L., Wang Q., Ge Y., Xu Y., “Fabricating a pearl/PLGA composite scaffold by the low-temperature deposition manufacturing technique for bone tissue engineering,” Biofabrication 2(2), 025002 (2010). 10.1088/1758-5082/2/2/025002 [DOI] [PubMed] [Google Scholar]
- 34.Sobral J. M., Caridade S. G., Sousa R. A., Mano J. F., Reis R. L., “Three-dimensional plotted scaffolds with controlled pore size gradients: Effect of scaffold geometry on mechanical performance and cell seeding efficiency,” Acta Biomater. 7(3), 1009–1018 (2011). 10.1016/j.actbio.2010.11.003 [DOI] [PubMed] [Google Scholar]
- 35.Rumpler M., Woesz A., Dunlop J. W., van Dongen J. T., Fratzl P., “The effect of geometry on three-dimensional tissue growth,” J. R. Soc. Interface 5(27), 1173–1180 (2008). 10.1098/rsif.2008.0064 [DOI] [PMC free article] [PubMed] [Google Scholar]
- 36.Wüst S., Müller R., Hofmann S., “3D Bioprinting of complex channels-Effects of material, orientation, geometry, and cell embedding,” J. Biomed. Mater. Res. A 103(8), 2558–2570 (2015). 10.1002/jbm.a.35393 [DOI] [PubMed] [Google Scholar]
- 37.Liu G., Jia W., Sun V., Choi B., Chen Z., “High-resolution imaging of microvasculature in human skin in-vivo with optical coherence tomography,” Opt. Express 20(7), 7694–7705 (2012). 10.1364/OE.20.007694 [DOI] [PMC free article] [PubMed] [Google Scholar]
- 38.Huang H., Oizumi S., Kojima N., Niino T., Sakai Y., “Avidin-biotin binding-based cell seeding and perfusion culture of liver-derived cells in a porous scaffold with a three-dimensional interconnected flow-channel network,” Biomaterials 28(26), 3815–3823 (2007). 10.1016/j.biomaterials.2007.05.004 [DOI] [PubMed] [Google Scholar]
- 39.Yang Y., Dubois A., Qin X. P., Li J., El Haj A., Wang R. K., “Investigation of optical coherence tomography as an imaging modality in tissue engineering,” Phys. Med. Biol. 51(7), 1649–1659 (2006). 10.1088/0031-9155/51/7/001 [DOI] [PubMed] [Google Scholar]
- 40.Li Q., Onozato M. L., Andrews P. M., Chen C. W., Paek A., Naphas R., Yuan S., Jiang J., Cable A., Chen Y., “Automated quantification of microstructural dimensions of the human kidney using optical coherence tomography (OCT),” Opt. Express 17(18), 16000–16016 (2009). 10.1364/OE.17.016000 [DOI] [PubMed] [Google Scholar]
- 41.Zhang T., Yan Y. N., Wang X. H., Xiong Z., Lin F., Wu R. D., Zhang R. J., “Three-dimensional gelatin and gelatin/hyaluronan hydrogel structures for traumatic brain injury,” J. Bioact. Compat. Polym. 22(1), 19–29 (2007). 10.1177/0883911506074025 [DOI] [Google Scholar]
- 42.Spiteri C. G., Pilliar R. M., Kandel R. A., “Substrate porosity enhances chondrocyte attachment, spreading, and cartilage tissue formation in vitro,” J. Biomed. Mater. Res. A 78(4), 676–683 (2006). 10.1002/jbm.a.30746 [DOI] [PubMed] [Google Scholar]
- 43.Sun W., Starly B., Nam J., Darling A., “Bio-CAD modeling and its applications in computer-aided tissue engineering,” Comput. Aided Des. 37(11), 1097–1114 (2005). 10.1016/j.cad.2005.02.002 [DOI] [Google Scholar]
- 44.Jia Y., Bagnaninchi P. O., Yang Y., Haj A. E., Hinds M. T., Kirkpatrick S. J., Wang R. K., “Doppler optical coherence tomography imaging of local fluid flow and shear stress within microporous scaffolds,” J. Biomed. Opt. 14(3), 034014 (2009). 10.1117/1.3130345 [DOI] [PMC free article] [PubMed] [Google Scholar]


