

Abstract
Background. Human immunodeficiency virus (HIV) patients who experience poor CD4 T-cell recovery despite viral suppression during antiretroviral therapy (ART) are known as immunological nonresponders. The molecular mechanism(s) underlying incomplete immune restoration during ART is not fully understood.
Methods. Label-free quantitative proteomics on single-cell type central memory T cells were used to reveal relative protein abundance changes between nonresponder, responder (good CD4 recovery during ART), and healthy individuals. Proteome changes were analyzed by protein pathway and network analyses and verified by selected reaction monitoring mass spectrometry.
Results. Proteomic analysis across groups detected 155 significant proteins from 1500 nonredundant proteins. Pathway and network analyses revealed dysregulation in mammalian target of rapamycin and protein translation-related proteins and decreases in stress response-related proteins for nonresponder subjects compared with responders and controls. Actin cytoskeleton signaling was increased for HIV responders and nonresponders alike.
Conclusions. Memory T cells from immunologic nonresponders have increases in proteins related to motility and protein translation and decreases in proteins capable of responding to cellular stresses compared with responders and controls. The potential for T cells to manage stress and modulate metabolism may contribute to their capacity to reconstitute a lymphopenic host.
Keywords: CMTC, ART, HIV, proteomics, SRM
Untreated human immunodeficiency virus (HIV) infection is characterized by depletion of CD4+ T cells and severe immunodeficiency. Treatment with antiretroviral therapy (ART) often leads to suppression of viral replication to undetectable levels and also to substantial gains in CD4+ T-cell counts [1–3]. Subjects with optimal immune restoration, immunological responders (Rs), acquire life expectancies close to healthy individuals [4]. In approximately 15%–25% of patients receiving ART, CD4+ T-cell recovery remains suppressed for years and may ultimately fail to reach normal levels despite sustained and prolonged viral suppression [5–7]. These subjects are referred to as immunological nonresponders (NRs). Both older age and lower CD4 nadir are risk factors for poor CD4 recovery during ART. It is important to note that persons who experience NR are at increased risk for morbidities and mortality [8, 9]. Several immune perturbations have been associated with NR including increased frequencies of activated T cells (defined by CD38 and human leukocyte antigen-antigen D-related coexpression), increased frequencies of proliferating CD4+ T cells (defined by Ki-67 expression), and depletion of both CD4 and CD8 naive T cells [10–12]. Immunological nonresponder subjects also tend to have elevated soluble CD14 in plasma and elevated type I interferon (IFN) gene signatures, indicative of innate immune activation [13, 14].
To investigate the specific connections between NR and T-cell functional states, we have examined the proteomic profile of memory T cells enriched for CD62L+ cells (central memory cells). Central memory T cells are capable of homing to lymph nodes, activating dendritic cells, and producing interleukin-2 [15]. Central memory CD4+ T cells display substantial perturbations in untreated HIV infection in humans and in simian immunodeficiency virus-infected monkeys that have been associated with disease progression [16–18]. Moreover, recent studies in treated HIV-infected patients suggest that central memory CD4+ T cells may also be important in immune reconstitution. In particular, analyses of T-cell subsets in treated HIV-infected patients indicated that central memory T-cell counts were the only parameter that was significantly linked to CD4 cell gains and total CD4 cell counts after ART administration and that central memory cell counts are higher in subjects who normalize CD4 counts after ART [19].
In the present study, we used label-free liquid chromatography-tandem mass spectrometry (LC-MS/MS) followed by protein pathway and network analyses to understand central memory T-cell proteome dysregulations associated with ART and NR. Novel features of the study include interrogation of the functional deficits of purified immune cell type in HIV patients highly relevant to the NR phenotype. In addition, direct proteome analyses have advantages in that protein abundance represents a snapshot of the functional cellular machinery whose levels are quite sensitive to metabolic, motility, and stress-induced cellular changes. The data provide evidence of immune perturbations in cells from NR subjects.
METHODS
Study Subjects
Using University Hospitals of Cleveland Institutional Review Board approved protocols and written consent, blood samples were obtained from healthy controls ([Cs] n = 11), HIV-infected responders ([Rs] n = 8), and HIV-infected nonresponders ([NRs] n = 9). Patients who initiated ART with CD4 cell counts <250 cells/µL and who either achieved CD4 recovery >450 cells/µL (R) or who failed to recover CD4 cell counts above 350 cells/µL (NR) were recruited into the study. All HIV-positive (HIV+) subjects had achieved and sustained durable viral suppression (undetectable HIV ribonucleic acid [RNA] in plasma) for at least 2 years leading up to the study (Table 1). Subjects recruited for the study were similar in age and had similar CD4+ T-cell nadirs (Table 1). Overall, coinfections and various other clinical indices were similar between R and NR subjects with the possible exception of the number of subjects who had experienced a previous acquired immune deficiency syndrome-defining illnesses, which was more frequent among NR subjects (4 of 9 subjects) compared with R subjects (1 of 8 subjects; Supplementary Table 1). There were no marked differences in the racial representation, gender, or ART regimens between the subject groups (data not shown). Sample purity (isolation of CD4+CD45RO+CD62L+ cells) for proteomic studies was similar between all groups (Table 1).
Table 1.
Demographic and Clinical Characteristics for All Study Subjects
| Subject Characteristics | Healthy Control (n = 11) | Responder (n = 8) | Nonresponder (n = 9) |
|---|---|---|---|
| % female | 19 | 11 | 25 |
| Agea (yrs) | 50 (40–64) | 58 (34–66) | 48 (36–66) |
| CD4 nadir | N/A | 62 (1–246) | 24 (0–188) |
| Current CD4 count | N/A | 933 (460–2182) | 266 (191–340) |
| Duration of viral suppressionb during ART (months) | N/A | 79 (36–138) | 42 (25–168) |
| Sample purity proteomic studies | 81.9 (77.4–86.5) | 86.9 (79.8–93.4) | 86.4 (69.9–89.5) |
Abbreviations: ART, antiretroviral therapy; N/A, not applicable/acquired.
a Median (range). Differences were not statistically significant between groups for any of the above indices except current CD4 cell counts that was used to select the HIV+ patient R and NR subsets.
b Consecutive months leading up to the study.
Isolation of Memory T Cells
CD4+CD45RO−CD62L+ central memory T-cell isolation was performed on a Miltenyi AutoMACS Pro. Thirty million peripheral blood mononuclear cells (PBMCs) were labeled with CD4+ Central Memory T Cell Biotin Cocktail (Miltenyi Biotec, Auburn, CA) followed by antibiotin microbead. The negative selection antibody cocktail contained antibodies against CD8, CD14, CD15, CD16, CD19, CD25, CD36, CD45RA, CD56, CD123, TCRγ/Δ, and CD235a (glycophorin A). Cells recovered from the negative selection fraction were then labeled with anti-CD62L phycoerythrin (PE) followed by anti-PE MicroBead positive selection of CD62L+ cells. Purity was assessed by flow cytometry using antibodies reactive to CD3 (peridinin chlorophyll protein [PerCP]; BD Biosciences, San Jose, CA), CD4 (allophycocyanin [APC]; BD Biosciences), CD45RO (fluorescein isothiocyanate [FITC]; BD Biosciences), and CD62L (PE; BD Biosciences). Purified T cells were stored at −80°C.
Flow Cytometry Measurements
Freshly isolated PBMCs were washed twice with staining buffer (phosphate-buffered saline [PBS] containing bovine serum albumin [BSA] 1% and azide 0.1%) then stained with fluorochrome-conjugated antibodies directed at the following markers: CD3 (Pacific Blue), CD4 (Alexa Fluor 700), CD38 (PerCP Cy5.5), CD62L (PE-Cy5), CD27 (APC-Cy7), CD45RO (FITC), CCR7 (PE-Cy7), CD127 (PE), Ki-67 (Alexa Fluor 647; intracellular) (BD Pharmingen, San Diego, CA) using BD Biosciences Cytofix/Cytoperm Fixation/Permeabilization Kit (BD Pharmingen) for surface and intracellular stains. Flow cytometric analyses were performed on a BD LSRII flow cytometer.
Analyses of Spontaneous T-Cell Apoptosis
Peripheral blood mononuclear cells were cultured in media (RPMI containing 10% fetal bovine serum, 1% l-glutamine, 1% penicillin-streptomycin, and 1% HEPES) overnight. The next day cells were harvested, washed with staining buffer (PBS containing 1% BSA and 0.1% azide), and assessed for apoptosis using BD Pharmingin's Annexin V PE Apoptosis Detection Kit I. Antibodies used to stain T cells included anti-CD3 (Pacific Blue), anti-CD4 (Alexa Fluor 700), anti-CD62L (APC), anti-CD45RO (FITC; BD Pharmingen), and anti-CD27 (APC-Cy7; BioLegend). Antibodies and Annexin V PE were added to each tube in a working volume of 100 µL of 1× Annexin V Buffer. Cells were incubated at room temperature for 15 minutes before an additional 200 µL Annexin V Buffer was added to each flow tube to bring the final volume to 300 µL. Cells were immediately examined on an LSRII flow cytometer.
Sample Preparation and Reverse-Phase Liquid Chromatography-Mass Spectrometry
Immune cell subsets were homogenized, detergents were removed, and enzymatic digestion was performed as previously published [20]. Tryptic-digested peptides (125 ng) were analyzed by LC-MS/MS using a LTQ-Orbitrap Velos mass spectrometer (Thermo Scientific, Carlsbad, CA) equipped with a nanoAcquity Ultra-high pressure liquid chromatography system (Waters, Milford, MA). Separation and detection of peptides were performed as previously described [21]. Liquid chromatography-tandem mass spectrometry raw data were acquired using the Xcalibur (2.2 SP1; Thermo Scientific).
Data Processing for Protein Identification and Quantification
The LC-MS/MS raw files were imported into Rosetta Elucidator (3.3.0.1.SP.25; Rosetta) and processed as previously described [21, 22]. The aligned and normalized peaks were annotated at the feature level by generating database search files (*.dta). Files were searched by Mascot (version 2.3.01) against the human International Protein Index (86 392 sequences) database using the following search parameters: trypsin enzyme specificity; mass accuracy window for precursor ion, 10 ppm; mass accuracy window for fragment ions, 0.8 Da; carbamidomethylation of cysteines as fixed modifications; oxidation of methionine as variable modification; and 1 missed cleavage.
Statistical Analysis
Automated differential quantification of peptides was accomplished with Rosetta Elucidator as previously described [23]. Statistical analyses of peptide intensity differences between the 3 groups were carried out using a one-way analysis of variance (ANOVA) test. Peptides with expectation value of P ≤ .05 were considered significant using SAS version 9.2 (SAS Institute Inc., Cary, NC) and R2.15.1. For each peptide, the median intensity for all samples within a group was calculated, and the fold-change was calculated using these median intensity values for the 3 possible pairwise group-based comparisons. Proteins that had ≥2 peptides with P ≤ .05 and fold changes of ±1.5 or more were considered significant.
Ingenuity Pathway Analyses
Proteins meeting the above cutoff criteria (Supplementary Figure 1) and their corresponding fold changes were imported into Ingenuity Pathway Analysis ([IPA] Ingenuity Systems). A right-tailed Fisher's exact test was used to calculate the P value of the probability that the connection between the imported proteins and the canonical pathways was due to chance alone. Molecular networks were generated using existing protein interaction databases and literature.
Cross-Talker Pathway and Network Analysis
Differentially regulated protein sets (Supplementary Figure 1) were also integrated, analyzed, and visualized by the Crosstalker software (NeoProteomics, Inc., Cleveland, OH) [24, 25]. Enrichment analysis is performed using Fisher's exact test to determine overrepresentation of pathway gene sets among the topologically related proteins. BioGRID [26] was selected as the protein-protein interaction network. A set of pathways created from data supplied by Pathway Commons [27] was used for pathway enrichment analysis.
Validation of Selected Targets by Selected Reaction Monitoring Mass Spectrometry
Validation of selected proteins was performed using selected reaction monitoring (SRM) MS as previously described [21]. Sixteen CD4+ T-cell digest samples were used for this SRM verification (8 Cs, 4 Rs, and 4 NRs). One representative peptide for selected protein was chosen with no missed cleavages or modifications and with clear intense y-ion fragments (Supplementary Tables 2). The abundance of each peptide was calculated based on the peak area intensity. Normalization of peak areas for the SRM transition of the target peptide to the internal standard performed allowed for accurate quantitation.
RESULTS
Immune Perturbations in Central Memory T Cells From Nonresponders
To assess immune activation among central memory T cells, we examined the frequencies of CD38+ cells among CD4+CD45RO+CD62L+ and CD4-CD45RO+CD62L+ subsets. The frequency of CD38+ cells among the memory CD3+CD4− cells (predominantly CD8+ T cells) was increased in our NR subjects (data not shown), whereas the frequency of CD38+ cells among the CD4+CD45RO+CD62L+ population was generally increased in our HIV+ donors but not significantly different between groups (Figure 1A). The frequencies of proliferating cells (Ki-67+) cells were significantly increased among memory CD4+CD45RO+CD62L+ T cells from NR subjects (Figure 1B).
Figure 1.
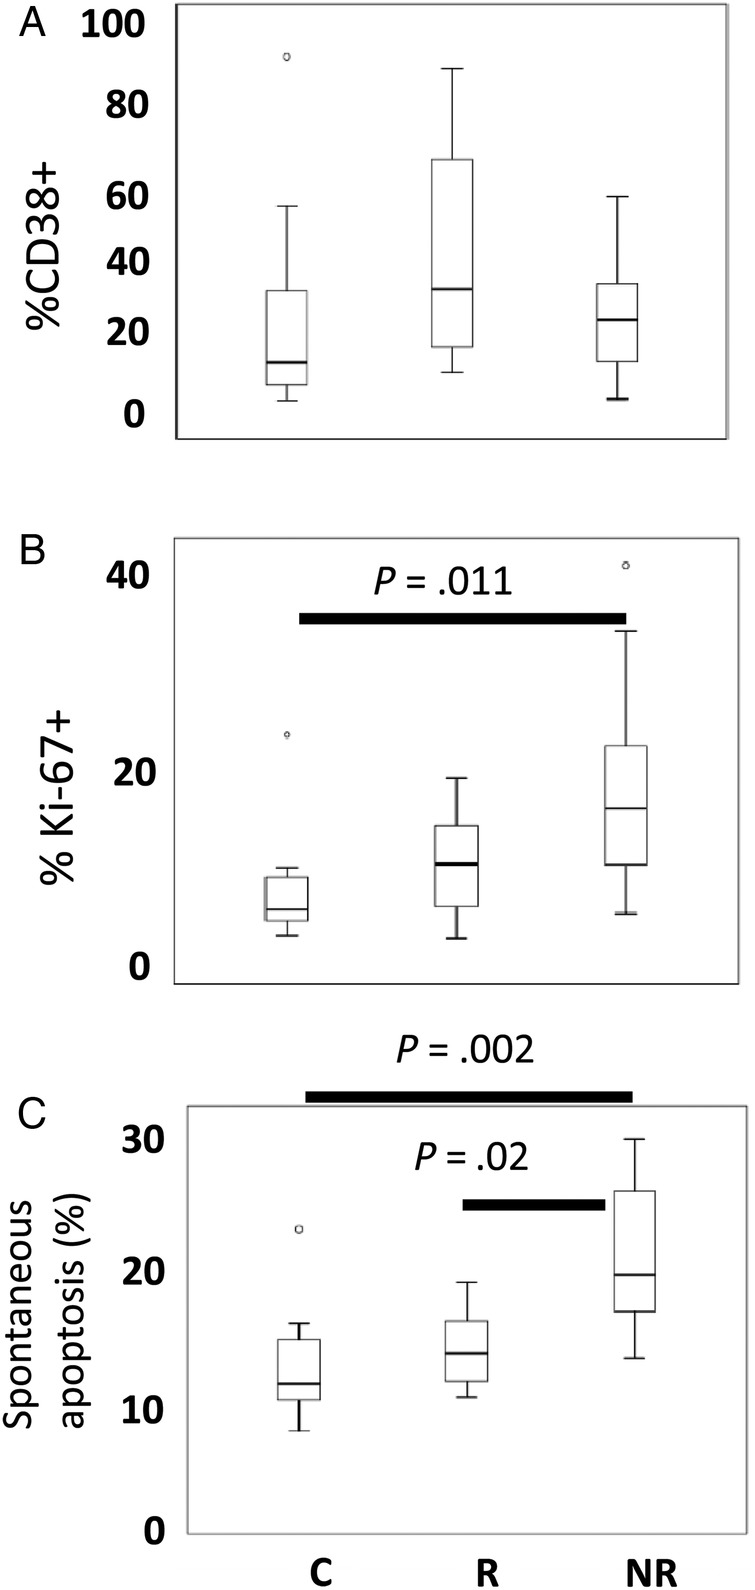
Assessing immune activation. Freshly isolated peripheral blood mononuclear cells were examined by flow cytometry to assess frequencies of activated (CD38+) memory T cells and frequencies of proliferating (Ki-67+) T cells. (A) Box-and-whisker plots show the median, interquartile range (box), range (whiskers), and outliers (symbols). The frequencies of CD38+ cells among the CD4+CD45RO+CD62L+ population were increased in human immunodeficiency virus-positive donors but not significantly different across groups. (B) The frequencies of Ki-67+ cells were significantly increased among memory CD4+CD45RO+CD62L+ T cells from nonresponder (NR) subjects compared with healthy controls (Cs) or responder (R) subjects. (C) The spontaneous apoptosis was more frequent among memory CD4+CD62L+CD45RO+ T cells from NR compared with cells from healthy Cs or from R subjects. Statistical analyses were performed with the Kruskal–Wallis test for multigroup comparisons and the Mann–Whitney U test between specific groups.
We also measured spontaneous apoptosis in cells incubated overnight in vitro. Memory CD4+CD62L+CD45RO+ T cells from NRs more frequently underwent spontaneous apoptosis compared with cells from healthy Cs or to cells from R subjects (Figure 1C). Thus, the CD4+CD45RO+CD62L+ memory T cells from NR subjects are more likely to be proliferating and are more prone to apoptosis. Similar results were obtained when gating on all CD4+ T cells or on CD4+CD45RO+ cells (data not shown).
T-Cell Proteome Analysis Reveals Differences in Protein Abundance Across Groups
Label-free proteomic analysis was performed using purified memory CD4+ T cells enriched for CD62L+ central memory subset (Figure 2A). Protein sample preparation, identification, and relative quantification strategies for proteomic analyses are illustrated in Figure 2B. Our approach provided coverage of over 6800 quantified peptides mapping to 1500 nonredundant proteins across groups. Of those, 804 peptides (mapping to 425 proteins) were significant at P ≤ .05 in the multigroup ANOVA comparison. Filtering these 425 proteins again with a fold change of ±1.5 or more and 2 or more peptides per protein revealed 279 proteins (Supplementary Table 3) where 155 unique proteins were significantly changing across at least 1 group (Supplementary Figure 1 and Figure 2C). Almost all of the significant proteins (153) were associated with the NR versus R (NR/R) group comparison, whereas 99 proteins were associated with the NR versus C (NR/C) group. Furthermore, the NR/R and NR/C groups had overlaps in 97 of the significantly changing proteins, suggesting high similarity in the T-cell proteome changes specific to the NR group. In contrast, the R versus C (R/C) group comparison only identified 27 significantly changing proteins, suggesting the functional similarity among T cells of the R and C groups.
Figure 2.

Workflow for quantitative proteomics profiling of central memory T cell (CMTC) for nonresponder (NR), responder (R), and control (C) subjects. Three groups were analyzed in this work: C (n = 11), R (n = 8), and NR (n = 9). (A) Enrichment and isolation of CMTC from blood samples using Ficoll-Paque and immunomagnetic bead isolation technique. (B) Label-free quantitative proteomic approach based on the comparison of the peak intensity of the same peptide, followed by validation of the target proteins by liquid chromatography (LC)-selected reaction monitoring (SRM). (C) Venn diagram indicating the intersections of the identified 155 significant proteins (P ≤ .05, fold change ± 1.5, and 2 or more peptides per protein) across groups: NR/C, R/C, and NR/R. Abbreviation: UPLC, ultra performance LC.
Pathway and Network Analysis
Cell Motility, Cell Stress, and Mammalian Target of Rapamycin Signaling Pathways Are Altered in T Cells From Nonresponder Subjects
The significant proteins (270 NR/R, 304 NR/C, and 133 R/C) were analyzed using IPA. The top 6 most significant dysregulated canonical pathways and their associated P values for the 3-pairwise group comparisons are shown in Table 2. It is notable that the eukaryotic initiation factor 2 (eIF2) signaling pathway and the mammalian target of rapamycin (mTOR) signaling pathway were significantly dysregulated in the NR/R and NR/C group comparisons but not significant for the R/C group. Proteins related to the translational machinery (eg, ribosomal proteins) in the case of the eIF2 annotation dominated these enrichments, whereas actin-related proteins (eg, RhoA) were frequently observed for the mTOR pathway annotation and the observed actin-related pathway annotations.
Table 2.
The Top 6 Canonical Pathways Revealed From the NR/R, NR/R, and R/C Groups Using Ingenuity Pathway Analysis
| Group | Canonical Pathways | P Valuea | Number of Proteins |
|---|---|---|---|
| NR/C | EIF2 Signaling | 1.29E-10 | 19 |
| Actin Cytoskeleton Signaling | 1.82E-06 | 15 | |
| RhoA Signaling | 2.82E-06 | 11 | |
| mTOR Signaling | 1.29E-05 | 13 | |
| Epithelial Adherens Junction Signaling | 2.19E-05 | 11 | |
| Regulation of Actin-based Motility by Rho | 5.01E-05 | 8 | |
| NR/R | EIF2 Signaling | 1.86E-10 | 18 |
| Epithelial Adherens Junction Signaling | 8.51E-06 | 11 | |
| mTOR Signaling | 2.24E-05 | 12 | |
| Regulation of Actin-based Motility by Rho | 2.40E-05 | 8 | |
| Actin Cytoskeleton Signaling | 6.46E-05 | 12 | |
| RhoA Signaling | 2.95E-04 | 8 | |
| R/C | Actin Cytoskeleton Signaling | 3.16E-07 | 11 |
| RhoA Signaling | 1.70E-06 | 8 | |
| Regulation of Actin-based Motility by Rho | 1.78E-06 | 7 | |
| ILK Signaling | 6.46E-06 | 9 | |
| Remodeling of Epithelial Adherens Junctions | 7.59E-06 | 6 | |
| Epithelial Adherens Junction Signaling | 8.51E-06 | 8 |
Abbreviations: C, control; EIF2, eukaryotic initiation factor 2; ILK, integrin-linked kinase; mTOR, mammalian target of rapamycin; NR, nonresponder; R, responder.
a The P value was calculated using the right-tailed Fisher's exact test (P ≤ .05).
Network analysis identified protein changes across linked pathways. Supplemental Figure 2 shows 3 significant networks (P ≤ .05) of direct connections between altered proteins. The first network (Supplementary Figure 2A) illustrates up-regulated proteins in T-cells of NR that are essential for actin cytoskeleton regulation, stress responses, apoptosis (such gelsolin [GSN]), as well as potential connections between cytoskeletal and inflammatory responses (represented by GSN and IFI16) potentially mediated thru Rac/Raf. The second network (Supplementary Figure 2B) illustrates up-regulation of proteins such S100A8/9 and IFI16 positing connections between oxidative stress or inflammation and IFN-related signaling. In addition, the third network (Supplementary Figure 2C) indicated molecular interactions of altered proteins from the top 3 dysregulated signaling pathways: actin cytoskeleton signaling pathway (including GSN), eIF2 signaling pathway (including EIF4B), and mTOR signaling pathway (including phosphatidylinositol 3-kinase [PI3K] complex).
To provide a comparison to the results revealed using the proprietary databases of Ingenuity and to assess the topological relatedness of the dysregulated proteins, networks were computed by analyzing each of the 3 groups with Crosstalker [24, 25]. Crosstalker assesses the topological connections between input molecular data (seeds) with reference to a known protein-protein interaction network, in this case from BioGrid, returning only those proteins that have a demonstrated “closeness” (as reflected by the Crosstalk score) in the network as scored by page-rank types of statistical measures. An exhaustive random walk of the network is used to compute Crosstalk scores. Genes or proteins lacking significant Crosstalk are discarded to permit visualization of dysregulated “modules” or networks of proteins at the core of the cellular processes of interest. Novel nodes are added to the networks if their Crosstalk scores are ranked highly. These networks and their component proteins can also be assessed for pathway enrichment—in this case using a Pathway Commons framework—and the pathway and network elements can be simultaneously visualized.
Figure 3 shows the most significant Crosstalker network's nodes, their connections, their significantly annotated pathway enrichments, and the fold changes on the nodes for NR/C and NR/R. For the NR/C and NR/R comparisons, the illustrated network is significantly enriched and annotated for translation (green) and cellular responses to stress (purple) and metabolism of RNA (brown) pathways, whereas the R/C group did not show enrichment for these pathways (Supplementary Tables 4). The translation pathway annotations are seen associated with multiple ribosomal proteins and several eukaryotic initiation factors (Figure 3A and B, green). Because the Pathway Commons pathway of translation has significant overlap in its annotated proteins with the eIF2 and mTOR pathways of Ingenuity, overall, these results are consistent with those from IPA.
Figure 3.

Significant protein networks of differentially expressed proteins in nonresponders (NRs) on antiretroviral therapy. Crosstalker networks for the NR/control (C) and NR/responder (R) groups visualize the interactions of proteins in the top enriched pathways. Node circle color indicates relative fold change, and node outline color indicates the pathway within which the protein participates. (A) Three hundred four proteins were input to Crosstalker from the NR/C group, and 284 were mapped to proteins in BioGRID. The analysis removed 82 input proteins, added 6 new proteins, and generated the largest connected network of 140 proteins; 38 of these proteins are in the top enriched pathways and are visualized. (B) Two hundred seventy proteins were input to Crosstalker from the NR/R group, and 249 were mapped to BioGRID. The analysis removed 66, added 6 new proteins, and generated a largest connected network of 133 proteins; 17 of these proteins are in the top enriched pathways and are visualized.
Cellular stress annotations, one of the top 3 significant pathway annotations for the NR/C and NR/R Crosstalker networks, shows MDM2 (Figure 3A and B) and MOV10 (Figure 3B) as important hub connections recruited by the Crosstalk analysis. MDM2 is connected to the seed proteins superoxide dismutase (SOD1), prolyl 4 hydroxylase (P4HB), and peroxiredoxin 2 and 6 (PRDX2 and PRDX6), and MOV10 is connected to ribosomal seed proteins RPS10 and RPS13. MDM2, a ubiquitin 3 ligase that regulates p53 [28], and MOV10, a translation regulator associated with translation [29], provide interesting functional links to the translation pathway mediated by connections to specific ribosomal proteins and initiation factors. Pathways of integrin signaling and cell surface interactions showed enrichment across all 3 groups, whereas apoptosis was seen in 2 of 3 groups, and the citric acid cycle and the respiratory machinery were significant for NR/R.
Altered Expression of Enzymes Regulating Oxidative Stress in T Cells From Nonresponder Subjects
The prominent cell stress pathway signatures in the NR group seen in the Crosstalk analyses led us to assess the expression of specific proteins known to modulate cell stress. In particular, we observed changes in enzymes that modulate oxidative stress in cells from NR subjects (Supplementary Table 5), including decreased expression of SOD1 and PRDXs for NR subjects. Although these perturbations do not directly indicate whether oxidative stress is a cause or effect of nonresponse, the altered enzyme expression patterns suggest that cells from NR subjects may have an altered potential to modulate this cellular stress mechanism.
Validation of Selected Targets by Selected Reaction Monitoring
Our label-free analysis and pathway and network analysis highlighted 5 significantly altered proteins (namely, S100A8, S100A9, GSN, HSPA9, and IFI16) that were selected for validation via SRM quantitative analysis [30]. Selected reaction monitoring allows for selective and quantitative measurements of target peptides by measuring a unique transition of ions from the precursor m/z to their specific fragment ions. Target peptides sequences and transitions were verified by comparing SRM-MS data to synthesized peptides. The targeted SRM analysis for these 5 peptides confirmed the statistically significant alterations in protein expression observed via label-free analysis across groups (Figure 4A–D). It is interesting to note that our label-free proteomic analyses also identified increased expression of Ki-67 protein among the memory CD4+ T cells from NR subjects (data not shown), consistent with our flow cytometric analyses of Ki-67 expression (Figure 1).
Figure 4.

Validation of target proteins. Five target proteins were selected for validation via selected reaction monitoring (SRM)-targeted proteomic technique. For each protein, a target peptide was selected, including the following: (A) S100A8 (LLETEC[C]PQYIR), (B) S100A9 (LGHPDTLNQGEFK), (C) GSN (QTQVSVLPEGGETPLFK), and (D) IFI16 (TEPEEVSIEDSAQSDLK). The left panel highlights the peptide intensity-based quantification via label-free analysis for the 5 selected proteins across groups (nonresponder [NR] = 9, responder [R] = 8, and control [C] = 11). Statistical analysis on the normalized data was performed using analysis of variance (ANOVA) model (P ≤ .05) and was visualized using boxplots. The right panel illustrates box-and-whisker plots of the abundance of each peptide via targeted SRM analysis. Statistical analysis on the SRM data was performed using one-way ANOVA, and it is represented by red box for NRs (n = 4), blue box for R (n = 4), and green box for C (n = 8) subjects. *P ≤ .05 and **P ≤ .01 by 2-tailed Student's t test.
DISCUSSION
These studies reveal consistent and coordinated protein abundance changes in memory CD4+ T cells, which suggest the possibility for dysregulation of several cell signaling pathways and biological processes that may contribute to persistent functional immunologic deficiencies accompanying HIV treatment. We have identified translation and cell stress pathways (annotated by Pathway Commons) and eIF2-alpha, mTOR, and actin cytoskeleton pathways (annotated by Ingenuity) as being consistently dysregulated in the context of poor CD4 recovery during ART. Mammalian target of rapamycin, a member of the PI3K canonical pathway, is a central regulator of cell growth, proliferation, cytoskeletal reorganization, and apoptosis [31–34]. The pathway annotations and network frameworks reveal dysregulations related to multiple mTOR functions including alterations in stress proteins, ribosomal proteins, and initiation factors. Alterations in the mTOR pathway have been previously linked to the dysregulated apoptosis of CD4+ T cells and impaired innate immune response in HIV infection [35]; thus, these additional associations are consistent with overall mTOR functional alteration.
The actin cytoskeleton changes in patients treated for HIV, which were confirmed by the verification of GSN-related changes, may also be important in cell function. The actin cytoskeleton has been shown to have several crucial roles essential for T-cell function and survival, including migration, signaling, and proliferation [36–38], and also plays a role in immune and inflammatory responses [39, 40].
Consistent with previous studies of messenger RNA expression in T cells, we found that NR was associated with increased expression of IFI16 in our proteomic analyses [13]. IFI16 is an IFN-inducible gene that plays a role in inflammasome activation and pyroptosis that may result from HIV abortive infection [41–43]. IFI16 expression has been correlated with immune activation in CD4 central T-memory T cells in HIV subjects [44]. IFI16 expression can be triggered by various stimuli including IFNs, oxidative stress, and proinflammatory cytokines [45, 46]. Our studies also identified abundance changes in S100A8 and S100A9 proteins in memory T cells from HIV NR subjects. S100s are calcium- and zinc-binding proteins that play a crucial role in cell survival, motility, differentiation, proliferation, and inflammatory response and antioxidant defenses [47, 48].
Based on these data, we developed (see Figure 5) a working model illustrating potential network-based (eg, interpathway) connections that could mediate the physiological effects relevant to attenuated T-cell levels in NR. Mammalian target of rapamycin dysregulations can mediate changes in the ribosome machinery through p70, whereas p27 can modulate cell motility and migration through RhoA [49]. The actin-binding protein GSN is regulated by RhoA and Rac and can accelerate actin motility by initiating cleavage events, inducing actin growth and or branching, thereby enhancing cell migration [50, 51]. Cross-pathway feedback loops in NR may mediate increased inflammation [45, 46] (evidenced by increases in IFI16), and our working model proposes connections between inflammation and increases in RhoA and GSN in NR that drive actin mobilization and CD4+ cellular motility (Supplementary Figure 2A). Ultimately, increased metabolic demands along with exposure to inflammation and chronic immune activation result in cellular stresses. Based on our observations that expression of proteins involved in controlling cell stress (eg, enzymes that regulate oxidative stress and heat shock proteins that can alleviate ER stress) are altered in NR, we speculate that the capacity of T cells to compensate for cellular stresses may be decreased in NR, thereby potentially contributing to poor CD4 recovery. Although our observations support this model, an important limitation is that we cannot discern protein expression changes that are a cause or, alternatively, a consequence of poor CD4 reconstitution. Additional longitudinal approaches to explore the role of these pathways in CD4 recovery will be important for confirming these mechanisms.
Figure 5.

Working model. Schematic drawing illustrating the network connections between pathways mediating the physiological effects observed in the nonresponder. Proteins highlighted in red correspond to an increase in abundance. Proteins marked by a star were validated in this study. Abbreviations: GSN, gelsolin; mTOR, mammalian target of rapamycin.
CONCLUSIONS
Overall, we provide a unique approach to identification of protein perturbations in primary T cells from HIV-infected persons who experience poor CD4 recovery during ART. Our studies defined perturbations in cell cycling and apoptosis in memory T cells and corresponding alterations in protein machinery involved in eIF2-α, mTOR, and actin signaling. These studies provide strong rationale for more targeted, detailed analyses of these pathways to understand the underlying mechanisms of poor CD4 recovery during ART administration.
Supplementary Data
Supplementary material is available online at Open Forum Infectious Diseases online (http://OpenForumInfectiousDiseases.oxfordjournals.org/).
Acknowledgments
Financial support. This work was funded by the National Institutes of Health ([NIH]; grant P20-DA-026133), the Case Western Reserve University Center for HIV/AIDS and Drug Abuse, and the Clinical and Translational Science Collaborative of Cleveland (grant UL1TR000439) from the National Center for Advancing Translational Sciences component of the NIH and NIH roadmap for Medical Research. The work was also supported by the CWRU Center for AIDS Research (NIH; AI36219).
Potential conflicts of Interest. All authors: No reported conflicts. All authors have submitted the ICMJE Form for Disclosure of Potential Conflicts of Interest.
References
- 1.Hammer SM, Squires KE, Hughes MD et al. A controlled trial of two nucleoside analogues plus indinavir in persons with human immunodeficiency virus infection and CD4 cell counts of 200 per cubic millimeter or less. AIDS Clinical Trials Group 320 Study Team. N Engl J Med 1997; 337:725–33. [DOI] [PubMed] [Google Scholar]
- 2.Gulick RM, Mellors JW, Havlir D et al. Treatment with indinavir, zidovudine, and lamivudine in adults with human immunodeficiency virus infection and prior antiretroviral therapy. N Engl J Med 1997; 337:734–9. [DOI] [PubMed] [Google Scholar]
- 3.Powderly WG, Landay A, Lederman MM. Recovery of the immune system with antiretroviral therapy: the end of opportunism? JAMA 1998; 280:72–7. [DOI] [PubMed] [Google Scholar]
- 4.Lewden C, Chene G, Morlat P et al. HIV-infected adults with a CD4 cell count greater than 500 cells/mm3 on long-term combination antiretroviral therapy reach same mortality rates as the general population. J Acquir Immune Defic Syndr 2007; 46:72–7. [DOI] [PubMed] [Google Scholar]
- 5.Torti C, Paiardini M, Gori A. Immunity to human immunodeficiency virus (HIV) infection. Clin Dev Immunol 2012; 2012:629356. [DOI] [PMC free article] [PubMed] [Google Scholar]
- 6.Robbins GK, Spritzler JG, Chan ES et al. Incomplete reconstitution of T cell subsets on combination antiretroviral therapy in the AIDS Clinical Trials Group protocol 384. Clin Infect Dis 2009; 48:350–61. [DOI] [PMC free article] [PubMed] [Google Scholar]
- 7.Moore RD, Keruly JC. CD4+ cell count 6 years after commencement of highly active antiretroviral therapy in persons with sustained virologic suppression. Clin Infect Dis 2007; 44:441–6. [DOI] [PubMed] [Google Scholar]
- 8.Engsig FN, Gerstoft J, Kronborg G et al. Long-term mortality in HIV patients virally suppressed for more than three years with incomplete CD4 recovery: a cohort study. BMC Infect Dis 2010; 10:318. [DOI] [PMC free article] [PubMed] [Google Scholar]
- 9.Lapadula G, Cozzi-Lepri A, Marchetti G et al. Risk of clinical progression among patients with immunological nonresponse despite virological suppression after combination antiretroviral treatment. AIDS 2013; 27:769–79. [DOI] [PubMed] [Google Scholar]
- 10.Hunt PW, Martin JN, Sinclair E et al. T cell activation is associated with lower CD4+ T cell gains in human immunodeficiency virus-infected patients with sustained viral suppression during antiretroviral therapy. J Infect Dis 2003; 187:1534–43. [DOI] [PubMed] [Google Scholar]
- 11.Zhang X, Hunt PW, Hammer SM et al. Immune activation while on potent antiretroviral therapy can predict subsequent CD4+ T-cell increases through 15 years of treatment. HIV Clin Trials 2013; 14:61–7. [DOI] [PMC free article] [PubMed] [Google Scholar]
- 12.Lederman MM, Calabrese L, Funderburg NT et al. Immunologic failure despite suppressive antiretroviral therapy is related to activation and turnover of memory CD4 cells. J Infect Dis 2011; 204:1217–26. [DOI] [PMC free article] [PubMed] [Google Scholar]
- 13.Fernandez S, Tanaskovic S, Helbig K et al. CD4+ T-cell deficiency in HIV patients responding to antiretroviral therapy is associated with increased expression of interferon-stimulated genes in CD4+ T cells. J Infect Dis 2011; 204:1927–35. [DOI] [PubMed] [Google Scholar]
- 14.Dunham RM, Vujkovic-Cvijin I, Yukl SA et al. Discordance between peripheral and colonic markers of inflammation during suppressive ART. J Acquir Immune Defic Syndr 2014; 65:133–41. [DOI] [PMC free article] [PubMed] [Google Scholar]
- 15.Sallusto F, Lenig D, Forster R et al. Pillars article: two subsets of memory T lymphocytes with distinct homing potentials and effector functions. Nature 1999; 401:708–12. [DOI] [PubMed] [Google Scholar]
- 16.McGary CS, Cervasi B, Chahroudi A et al. Increased stability and limited proliferation of CD4+ central memory T cells differentiate nonprogressive simian immunodeficiency virus (SIV) infection of sooty mangabeys from progressive SIV infection of rhesus macaques. J Virol 2014; 88:4533–42. [DOI] [PMC free article] [PubMed] [Google Scholar]
- 17.Okoye A, Meier-Schellersheim M, Brenchley JM et al. Progressive CD4+ central memory T cell decline results in CD4+ effector memory insufficiency and overt disease in chronic SIV infection. J Exp Med 2007; 204:2171–85. [DOI] [PMC free article] [PubMed] [Google Scholar]
- 18.Sieg SF, Rodriguez B, Asaad R et al. Peripheral S-phase T cells in HIV disease have a central memory phenotype and rarely have evidence of recent T cell receptor engagement. J Infect Dis 2005; 192:62–70. [DOI] [PubMed] [Google Scholar]
- 19.Rallon N, Sempere-Ortells JM, Soriano V, Benito JM. Central memory CD4 T cells are associated with incomplete restoration of the CD4 T cell pool after treatment-induced long-term undetectable HIV viraemia. J Antimicrob Chemother 2013; 68:2616–25. [DOI] [PubMed] [Google Scholar]
- 20.Schlatzer DM, Sugalski J, Dazard JE et al. A quantitative proteomic approach for detecting protein profiles of activated human myeloid dendritic cells. J Immunol Methods 2012; 375:39–45. [DOI] [PMC free article] [PubMed] [Google Scholar]
- 21.Schlatzer DM, Dazard JE, Dharsee M et al. Urinary protein profiles in a rat model for diabetic complications. Mol Cell Proteomics 2009; 8:2145–58. [DOI] [PMC free article] [PubMed] [Google Scholar]
- 22.Tomechko SE, Lundberg KC, Jarvela J et al. Proteomic and bioinformatics profile of paired human alveolar macrophages and peripheral blood monocytes. Proteomics 2015; 15:3797–805. [DOI] [PMC free article] [PubMed] [Google Scholar]
- 23.Schlatzer DM, Dazard JE, Ewing RM et al. Human biomarker discovery and predictive models for disease progression for idiopathic pneumonia syndrome following allogeneic stem cell transplantation. Mol Cell Proteomics 2012; 11:M111.015479. [DOI] [PMC free article] [PubMed] [Google Scholar]
- 24.Nibbe RK, Markowitz S, Myeroff L et al. Discovery and scoring of protein interaction subnetworks discriminative of late stage human colon cancer. Mol Cell Proteomics 2009; 8:827–45. [DOI] [PMC free article] [PubMed] [Google Scholar]
- 25.Nibbe RK, Koyuturk M, Chance MR. An integrative -omics approach to identify functional sub-networks in human colorectal cancer. PLoS Comput Biol 2010; 6:e1000639. [DOI] [PMC free article] [PubMed] [Google Scholar]
- 26.Chatr-Aryamontri A, Breitkreutz BJ, Oughtred R et al. The BioGRID interaction database: 2015 update. Nucleic Acids Res 2015; 43:D470–8. [DOI] [PMC free article] [PubMed] [Google Scholar]
- 27.Cerami EG, Gross BE, Demir E et al. Pathway Commons, a web resource for biological pathway data. Nucleic Acids Res 2011; 39:D685–90. [DOI] [PMC free article] [PubMed] [Google Scholar]
- 28.Jain AK, Barton MC. Making sense of ubiquitin ligases that regulate p53. Cancer Biol Ther 2010; 10:665–72. [DOI] [PMC free article] [PubMed] [Google Scholar]
- 29.Kenny PJ, Zhou H, Kim M et al. MOV10 and FMRP regulate AGO2 association with microRNA recognition elements. Cell Rep 2014; 9:1729–41. [DOI] [PMC free article] [PubMed] [Google Scholar]
- 30.Picotti P, Aebersold R. Selected reaction monitoring-based proteomics: workflows, potential, pitfalls and future directions. Nat Methods 2012; 9:555–66. [DOI] [PubMed] [Google Scholar]
- 31.Donnelly N, Gorman AM, Gupta S, Samali A. The eIF2alpha kinases: their structures and functions. Cell Mol Life Sci 2013; 70:3493–511. [DOI] [PMC free article] [PubMed] [Google Scholar]
- 32.Asnaghi L, Bruno P, Priulla M, Nicolin A. mTOR: a protein kinase switching between life and death. Pharmacol Res 2004; 50:545–9. [DOI] [PubMed] [Google Scholar]
- 33.Laplante M, Sabatini DM. mTOR signaling at a glance. J Cell Sci 2009; 122:3589–94. [DOI] [PMC free article] [PubMed] [Google Scholar]
- 34.Polivka J Jr, Janku F. Molecular targets for cancer therapy in the PI3K/AKT/mTOR pathway. Pharmacol Ther 2014; 142:164–75. [DOI] [PubMed] [Google Scholar]
- 35.Nicoletti F, Fagone P, Meroni P et al. mTOR as a multifunctional therapeutic target in HIV infection. Drug Discov Today 2011; 16:715–21. [DOI] [PubMed] [Google Scholar]
- 36.Burkhardt JK, Carrizosa E, Shaffer MH. The actin cytoskeleton in T cell activation. Annu Rev Immunol 2008; 26:233–59. [DOI] [PubMed] [Google Scholar]
- 37.Samstag Y, Eibert SM, Klemke M, Wabnitz GH. Actin cytoskeletal dynamics in T lymphocyte activation and migration. J Leukoc Biol 2003; 73:30–48. [DOI] [PubMed] [Google Scholar]
- 38.Spear M, Guo J, Wu Y. The trinity of the cortical actin in the initiation of HIV-1 infection. Retrovirology 2012; 9:45. [DOI] [PMC free article] [PubMed] [Google Scholar]
- 39.Wickramarachchi DC, Theofilopoulos AN, Kono DH. Immune pathology associated with altered actin cytoskeleton regulation. Autoimmunity 2010; 43:64–75. [DOI] [PMC free article] [PubMed] [Google Scholar]
- 40.Radulovic M, Godovac-Zimmermann J. Proteomic approaches to understanding the role of the cytoskeleton in host-defense mechanisms. Expert Rev Proteomics 2011; 8:117–26. [DOI] [PMC free article] [PubMed] [Google Scholar]
- 41.Monroe KM, Yang Z, Johnson JR et al. IFI16 DNA sensor is required for death of lymphoid CD4 T cells abortively infected with HIV. Science 2014; 343:428–32. [DOI] [PMC free article] [PubMed] [Google Scholar]
- 42.Berg RK, Rahbek SH, Kofod-Olsen E et al. T cells detect intracellular DNA but fail to induce type I IFN responses: implications for restriction of HIV replication. PLoS One 2014; 9:e84513. [DOI] [PMC free article] [PubMed] [Google Scholar]
- 43.Ansari MA, Singh VV, Dutta S et al. Constitutive interferon-inducible protein 16-inflammasome activation during Epstein-Barr virus latency I, II, and III in B and epithelial cells. J Virol 2013; 87:8606–23. [DOI] [PMC free article] [PubMed] [Google Scholar]
- 44.Nissen SK, Hojen JF, Andersen KL et al. Innate DNA sensing is impaired in HIV patients and IFI16 expression correlates with chronic immune activation. Clin Exp Immunol 2014; 177:295–309. [DOI] [PMC free article] [PubMed] [Google Scholar]
- 45.Baggetta R, De Andrea M, Gariano GR et al. The interferon-inducible gene IFI16 secretome of endothelial cells drives the early steps of the inflammatory response. Eur J Immunol 2010; 40:2182–9. [DOI] [PubMed] [Google Scholar]
- 46.Mondini M, Vidali M, Airo P et al. Role of the interferon-inducible gene IFI16 in the etiopathogenesis of systemic autoimmune disorders. Ann N Y Acad Sci 2007; 1110:47–56. [DOI] [PubMed] [Google Scholar]
- 47.Donato R. S100: a multigenic family of calcium-modulated proteins of the EF-hand type with intracellular and extracellular functional roles. Int J Biochem Cell Biol 2001; 33:637–68. [DOI] [PubMed] [Google Scholar]
- 48.Duan L, Wu R, Ye L et al. S100A8 and S100A9 are associated with colorectal carcinoma progression and contribute to colorectal carcinoma cell survival and migration via Wnt/beta-catenin pathway. PLoS One 2013; 8:e62092. [DOI] [PMC free article] [PubMed] [Google Scholar]
- 49.Woods TC. Dysregulation of the mammalian target of rapamycin and p27Kip1 promotes intimal hyperplasia in diabetes mellitus. Pharmaceuticals (Basel) 2013; 6:716–27. [DOI] [PMC free article] [PubMed] [Google Scholar]
- 50.Knoch B, Barnett MP, Cooney J et al. Molecular characterization of the onset and progression of colitis in inoculated interleukin-10 gene-deficient mice: a role for PPARalpha. PPAR Res 2010; 2010:621069. [DOI] [PMC free article] [PubMed] [Google Scholar]
- 51.Ehrlich HP, Allison GM, Page MJ et al. Increased gelsolin expression and retarded collagen lattice contraction with smooth muscle cells from Crohn's diseased intestine. J Cell Physiol 2000; 182:303–9. [DOI] [PubMed] [Google Scholar]
Associated Data
This section collects any data citations, data availability statements, or supplementary materials included in this article.