

Abstract
Objective
The purpose of this study was to determine the agreement between actual height or segmental length, and estimated height from segmental measures among individuals cerebral palsy (CP).
Design
A convenience sample of 137 children and young adults with CP (age 2–25 years) was recruited from a tertiary care center. Height, body mass, recumbent length, knee height, tibia length and ulna length were measured. Estimated height was calculated using several common prediction equations. Agreement between measured and estimated height was determined using the Bland-Altman method.
Results
Limits of agreement were wide for all equations, usually in the range of ± 10 cm. Repeatability of the individual measures was high, with a coefficient of variation of 1–2% for all measures. The equation using knee height demonstrated a non-uniform difference where height estimation worsened as overall height increased.
Conclusions
Accurate measurement of height is important, but very difficult in individuals with CP. Segmental measures are highly repeatable, and thus may be used on their own to monitor growth. However, when an accurate measure of height is needed to monitor nutritional status (i.e. for body mass index calculation), caution is warranted as there is only fair to poor agreement between actual height and estimated height.
Keywords: Bland-Altman, Cerebral Palsy, Height, Growth, Pediatrics, Scoliosis
INTRODUCTION
Accurate measurement of height is important for assessment of growth, development and nutritional status. Among individuals with pediatric onset disabilities such as cerebral palsy (CP), accurate height measurement is very difficult due to orthopedic and pathologic factors such as scoliosis, joint contractures, and spasticity. Not only is a measurement of height necessary for tracking growth and development in children, as well as for determining body surface area for pharmacological dosing, it is also needed to calculate body mass index (BMI)-one of the most widely used screening tools to monitor nutritional status and obesity. However, since BMI is calculated by squaring the height dimension (i.e. kg·m−2) any error in the measurement of height would lead to an exponential misrepresentation of BMI. Considering that CP is one of the most common causes of pediatric disability in the U.S.,1,2 and that most individuals with CP have significantly impaired movement, growth and nutritional status, accurate monitoring of development, maturation, and health is critical.
Height estimation equations using segmental limb measurements have been developed in an attempt to address the challenges of obtaining accurate height among individuals with mobility impairments. For example, Chumlea and colleagues developed prediction equations using knee height, with the goal of applying the equations to mobility impaired populations.3 They used historical data from national health surveillance studies in the 1960s and 70s to construct race and gender-specific prediction models applicable to children from 6–18 years old.3 Thereafter, and in an attempt to address the specific growth abnormalities in CP, Stevenson and colleagues developed regression equations from segmental limb lengths using a population of children with CP.4 However, the level of Gross Motor Function Classification System (GMFCS) was not accounted for, and individuals with scoliosis or contractures were excluded. Thus, the collective sample used to develop the prediction equations was younger and less severely affected than the general CP population. Another commonly used equation by Gauld et al.5 was developed from a large population of healthy Australian schoolchildren. For their analyses, age was adjusted in sex-stratified linear modeling, and accuracy of the prediction was presented with R2 values. Although “measurement performance” was assessed among a small group of children and adolescents with Duchene muscular dystrophy, the performance of the estimation to actual height in this sample (i.e. measurement “agreement”) was not conducted.
Therefore, the objective of this study was to determine the limits of agreement using the Bland-Altman method,6 between height estimated from single segmental measurement (estimated height) and total length measured by segment (segmental length) or standing height (actual height), in a heterogeneous, clinically-representative sample of individuals with CP. A secondary objective was to determine the repeatability of the measures to document whether poor repeatability was an influential factor in determining the agreement between methods.
METHODS
Participants with a primary diagnosis of CP were recruited from a pediatric physiatry clinic at a tertiary care center. Individuals with a primary diagnosis other than CP, genetic disorders, or medical conditions other than CP known to significantly affect growth were excluded. Individuals who were unable to cooperate for measurements were also excluded. All measurements were taken during a routine outpatient clinic visit. The same two trained clinicians performed the measurements during the course of the study. To assess repeatability, all the measurements were done in triplicate on a subset of subjects by the same examiner, and with repeated measurements separated by equal time to lessen recall bias. All unilateral measurements were taken on the less involved side of the body. If there were no bilateral differences, the left side of the body was used. All measurements were recorded to the nearest 0.01 cm. Subjects with scoliosis were included in the study, and separate analyses were conducted to determine the mediating influence of scoliosis on height. Approval for this study was obtained through the institutional review board for human subject’s protection. The consent was obtained in clinic at the time of the clinic appointment. No family declined to participate.
Gross Motor Function
The GMFCS level of each participant was assessed.7 GMFCS assesses activity limitations for gross motor function with a five-level ordinal grading scale.8 Specifically, the GMFCS describes gross motor function of individuals with CP on the basis of self-initiated movement and with emphasis on sitting, walking, and wheeled mobility. Distinctions between levels are also based on the need for assistive devices, including hand-held mobility devices (walkers, crutches, etc.) or wheeled mobility. Studies of the GMFCS show it to be reliable (interclass correlation coefficient (ICC) = 0.93)9 and have interrater reliability (quadratic kappa value of 0.978).10 In order to preserve reliability, all patients were examined by the same physician investigator to classify GMFCS level. The individuals were also classified into two categories of functional impairment: GMFCS levels I–III and GMFCS levels IV–V.
Height Measurement and Total Segmental Length
For individuals without significant contractures or scoliosis, and who were able to stand straight without any assistance, height measurements were directly taken using a standard stadiometer. Total segmental recumbent length measurement was performed using a flexible steel measuring tape for individuals who were unable to stand, and/or had scoliosis or contractures. The recumbent length was measured in four continuous segments: (1) from the top of the head to the acromion process of the shoulder; (2) from the acromion process of the shoulder to the greater trochanter of the hip; (3) from the greater trochanter of the hip to the lateral joint line of the knee; and (4) from the knee joint line to the bottom of the heel. Each individual segment was measured twice, which took less than 1 minute, and the average was recorded. In the event that any two measurements for a given segment were greater than 1–2 mm different, a third measurement was taken. The supine measurement technique (i.e., all four measures) took approximately 4 minutes collectively, including recording the information. For the repeatability subset, all participants were measured using the recumbent length method and standing height was also measured in individuals who were able to stand and had no scoliosis or contractures.
Tibia Length Measurement
Using a flexible tape measure, tibia length was measured from the superior border of the medial tibia condyle to the inferior border of the medial malleolus, with both the knee and the ankle at 90 degrees.
Knee Height Measurement
Using a knee height caliper (The Shorr Knee-Height Caliper, Weigh and Measure, LLC, Olney, Maryland), knee height was measured by placing the one blade of the caliper under the heel, with the other blade placed over the anterior surface of the femoral condyles of the thigh, just proximal to the patella. The shaft of the caliper remained parallel to the long axis of the tibia.4
Ulna Length Measurement
Ulna length was obtained with the forearm fully pronated and the elbow bent at 90–110 degrees. Using a flexible tape measure the ulna was measured from the styloid process to the olecranon process.5
Prediction Equations for Height
Estimated heights for each participant were calculated using segmental lengths with one or more of the previously published equations. The prediction equations are provided in Table 1. Each equation was integrated into the analyses only for the specific age ranges from which they were originally derived. Specifically, the equations by Stevenson et al.4 were applied to individuals age 12 years and under. The equations by Chumlea et al.3 were applied to individuals age six years and older. The equations by Gauld et al.5 were applied to participants age seven years and older. Since the equation by Gauld et al. includes age as a model predictor, age 18 years was used for individuals older than 18 years.
Table 1.
Height prediction equations (using segmental lengths)
| Stevenson (Age 0–12) | |
| Knee height | H = (2.68 × KH) + 24.2 |
| Tibia length | H = (3.26 × TL) + 30.8 |
| Gauld | |
| Males | |
| Ulna length | H = 4.605U + 1.308A + 28.003 |
| Knee height | H = 2.423KH + 1.327A + 21.818 |
| Tibia length | H = 2.758T + 1.717A + 36.509 |
| Females | |
| Ulna length | H = 4.459U + 1.315A + 31.485 |
| Knee height | H = 2.473KH + 1.187A + 21.151 |
| Tibia length | H = 2.771T + 1.457A + 37.748 |
| Chumlea (Age 6–18) | |
| White male | H = (2.22 × KH) + 40.54 |
| Black male | H = (2.18 × KH) + 39.60 |
| White female | H = (2.15 × KH) + 43.21 |
| Black female | H = (2.02 × KH) + 46.59 |
H=estimated height, KH=knee height, A=age, T= tibia length, U=ulna length
Statistical Analysis
Descriptive characteristics were stratified by GMFCS (i.e. GMFCS I–III and IV–V) and scoliosis status (curvature greater than ten degrees, yes/no). Differences in height or segmental length between categories were determined for general demographic and anthropometric characteristics by an independent-sample t-test, and difference in proportions for sex by Chi-square test. General linear models (GLM) were also conducted to determine whether scoliosis influenced height while adjusting for age. A minimum criterion alpha level of p ≤ 0.05 was used to determine statistical significance.
The Bland-Altman method was performed for each estimated height versus actual measured height or summed segmental lengths. In all cases the difference between the measures was calculated as estimated height using the prediction equation minus the mean of the two measures. For the subset of participants who underwent triplicate measures, the mean of the triplicate measure was used for calculating estimated height and for the measured height. The mean difference, standard deviation of the difference and 95% limits of agreement (LOA) (average difference ± 1.96 standard deviation of the difference) were calculated for each graph. The sample was split by severity and the mean difference and limits of agreement were recalculated.
Repeatability Analysis
The subset of 40 individuals who underwent triplicate measures was used for the repeatability analysis (i.e. intra-observer). The subgroup for repeatability was randomly chosen and representative of the entire sample. To preserve validity and reduce risk of recall bias, all measurements were completed in triplicate and separated by time and by multiple other anthropometric measurements (e.g., the other segments, waist circumference, hip circumference, body mass). Each patient was repositioned between subsequent measures of the same segment to accommodate other measures. Moreover, all measurements were taken and recorded to the nearest 0.01 cm, and no measurement was taken consecutively. For each measurement the clinician called out the length to a data recorder and then visually checked the accuracy of each in sequence. The repeatability of each individual measurement was assessed by obtaining the standard deviation (SD), mean, coefficient of variation, and range between minimum and maximum measurement. Plots of the SD against the mean were done to examine association and determine if the error was scale-free. The difference between each estimated height and measured height was plotted against the mean. An intra-class correlation coefficient (ICC) was obtained to observe whether disagreement between methods depended on scale of the measure.
Inter-rater Reliability
Inter-rater reliability analysis was performed on 16 individuals. Measurements were taken within several minutes of each other. The segmental height measurement was performed on all individuals, with ulna length and tibia length performed on a subset. Cronbach’s α were calculated to determine inter-rater reliability (i.e. inter-observer). All statistical analysis was performed using SPSS version 13.0 for Windows (SPSS, Inc., Chicago, IL, USA), and SAS software version 9.3 (SAS Institute, Cary, NC).
RESULTS
One hundred thirty seven participants, ranging in age from 2 to 25 years were included in the study. Mean age of the study sample was 11.3 years, with 58% male participants. Demographic data for the participants are displayed in Table 2. Of the 137 subjects, approximately 57% had documented scoliosis, which followed a predictable trend of increased prevalence of scoliosis with increased level of GMFCS (GMFCS: I–III 35.1% versus GMFCS IV–V: 85.0%; p<0.001). Topographical classification prevalence was: Hemiplegia (18.2%), Diplegia (22.6%) Quadriplegia (46.7%), Triplegia (2.2%), and non-specific (10.2%).
Table 2.
Demographic information by GMFCS level.
| Total Sample | GMFCS I | GMFCS II | GMFCS III | GMFCS IV | GMFCS V | |
|---|---|---|---|---|---|---|
| N | 137 | 41 | 14 | 22 | 23 | 37 |
| Female (%) | 41.6 | 36.6 | 35.7 | 36.4 | 52.2 | 46 |
| Scoliosis (%) | 56.9 | 19.5 | 50.0 | 57.1 | 69.6 | 95.0 |
| Age (yrs) | 11.3 (5.6) | 8.8 (5.0) | 12.1 (4.8) | 12.6 (5.7) | 13.1 (5.1) | 11.9 (5.9) |
| Segmental or Standing Height (cm) | 132.5 (23.9) | 127.9 (26.3) | 141.4 (19.8) | 142.4 (25.7) | 134.7 (18.2) | 127.1 (8.83) |
| Ulna Length (cm) | 20.9 (4.3) | 20.0 (4.7) | 22.2 (3.7) | 22.7 (4.7) | 21.6 (3.5) | 20.0 (3.8) |
| Tibia Length (cm) | 29.7 (6.8) | 28.7 (7.5) | 31.7 (5.6) | 32.0 (7.7) | 30.3 (5.2) | 28.3 (6.5) |
| Knee Height (cm) | 39.2 (8.6) | 38.6 (9.8) | 43.6 (7.4) | 41.7 (8.8) | 39.1 (6.2) | 36.7 (8.1) |
Mean Difference Results
Mean difference values for each equation, with the entire group as a whole and split by severity, are displayed in Table 3. There were no significant differences in height between individuals with (132.7 ± 23.3 cm) and without (132.2 ± 24.8 cm) scoliosis; however, when assessed using GLM, there was a significant negative effect for scoliosis (β = −4.69; p=0.02) after adjusting for age.
Table 3.
Mean difference between estimated and directly measured recumbent length.
| All Severities | Mild CP | Moderate to Severe CP | ||||
|---|---|---|---|---|---|---|
| Equation | N | Mean Diff ± SD | N | Mean Diff ± SD | N | Mean Diff ± SD |
| Stevenson knee height | 85 | −1.77 ± 5.39 | 41 | 0.68 ± 4.28 | 44 | −4.04 ± 5.36 |
| Stevenson tibia length | 85 | −2.97 ± 5.91 | 41 | −2.64 ± 6.53 | 44 | −3.27 ± 5.33 |
| Gauld knee height | 98 | 0.23 ± 6.40 | 33 | 2.46 ± 5.08 | 65 | −0.90 ± 6.73 |
| Gauld ulna length | 98 | 7.37 ± 6.72 | 33 | 4.68 ± 5.38 | 65 | 8.74 ± 6.96 |
| Gauld tibia length | 98 | 5.67 ± 6.97 | 33 | 3.38 ± 6.45 | 65 | 6.85 ± 6.97 |
All differences are estimated height using prediction equation minus directly measured height in cm.
The mean difference between the estimated height, using the estimation from knee height equation by Stevenson et al.4 (“Stevenson KH”), and the actual measured height or segmental length, was −1.77 ± 5.4 cm. When separated by severity, the mean difference for the individuals with GMFCS I–III decreased to 0.68 ± 4.3 cm (Figure 1a). However, the mean difference for the individuals with GMFCS IV–V increased to −4.04 ± 5.3 cm (Figure 1b). Mean difference values using the estimation from tibia length by Stevenson et al. (“Stevenson TL”) demonstrated similar findings, with a mean difference of −2.97 ± 5.9 cm for the group as a whole, −2.6 ± 6.5 cm for the individuals with GMFCS I–III and −3.3 ± 5.3 cm for the individuals with GMFCS IV–V.
Figure 1.
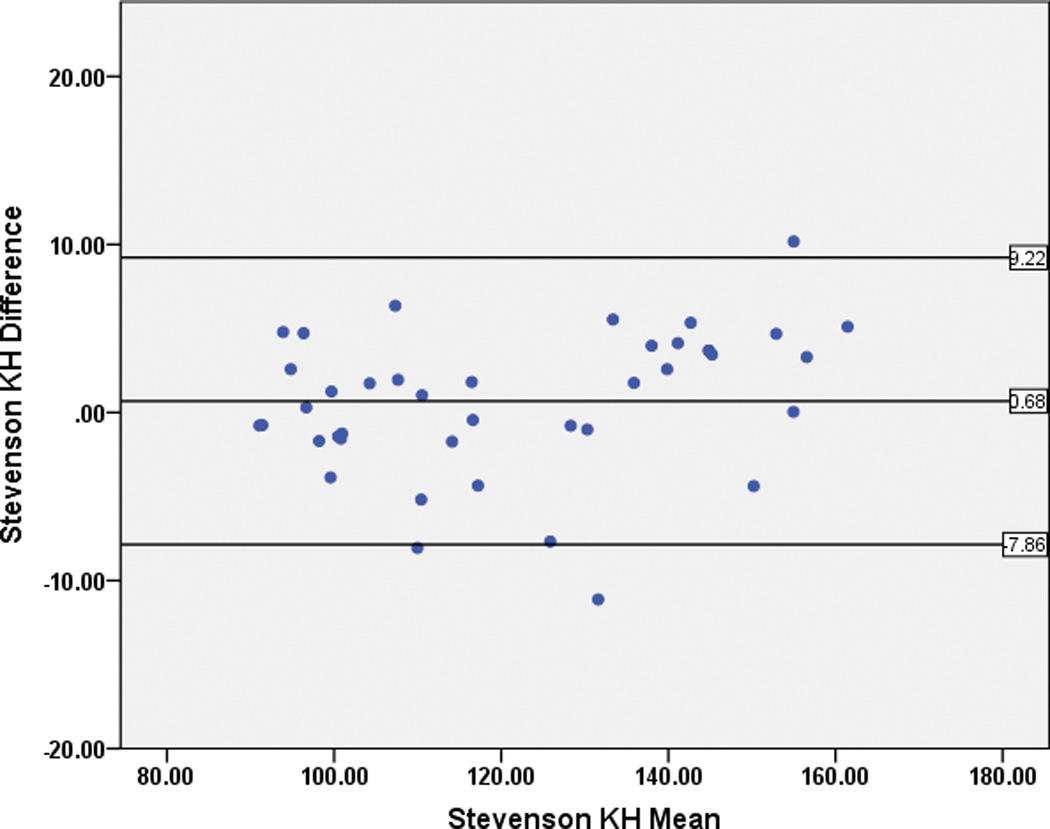
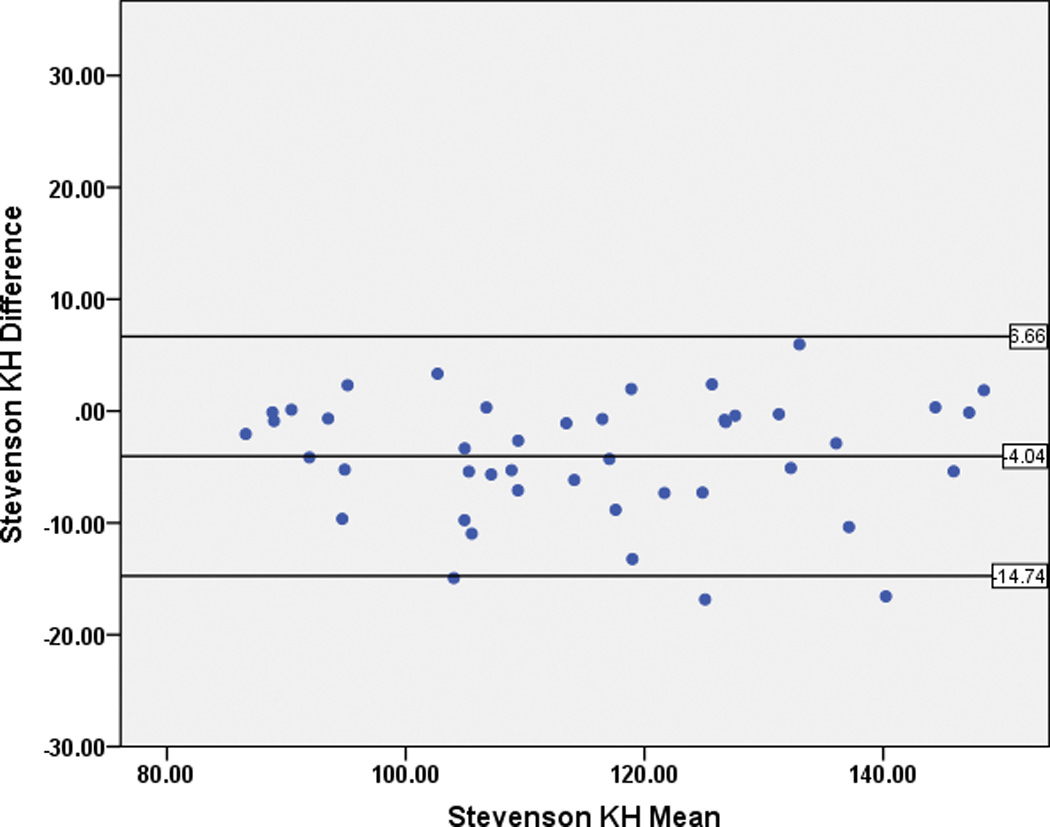
Bland-Altman plots for the Stevenson Knee Height estimation (“Stevenson KH”) for individuals with GMFCS I–III (Figure 1a), and GMFCS IV–V (Figure 1b).
The mean difference between the estimated height and the actual measured height or segmental length using the knee height equation by Chumlea et al.3 (“Chumlea KH”) demonstrated a non-uniform difference, with height estimation deteriorating as the height increased (Figure 2).
Figure 2.
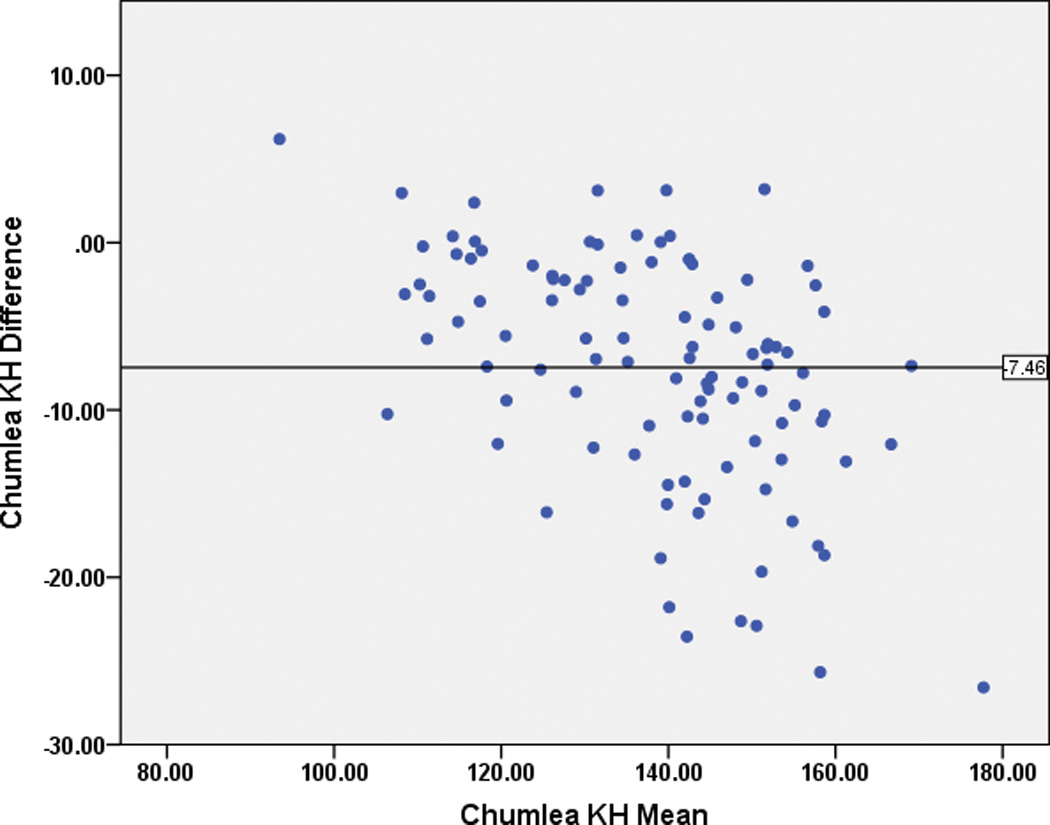
Bland-Altman plots for the Chumlea Knee Height estimation (“Chumlea KH”) demonstrating non-uniform differences, with height estimation deteriorating as the height increased.
Differences between the estimated height and the actual measured height or segmental length was smallest using the knee height equation by Gauld et al.5 at 0.23 ± 6.4 cm for the entire group, 2.46 ± 5.1 cm with GMFCS I–III, and −0.90 ± 6.7 cm with GMFCS IV–V. The ulna length height equation by Gauld et al demonstrated a significant positive bias, with a mean difference of 7.34 ± 6.7 cm for the group (Figure 3) as a whole, 4.68 ± 5.4 cm for GMFCS I–IIIs and 8.74 ± 7.0 cm for GMFCS IV–Vs.
Figure 3.
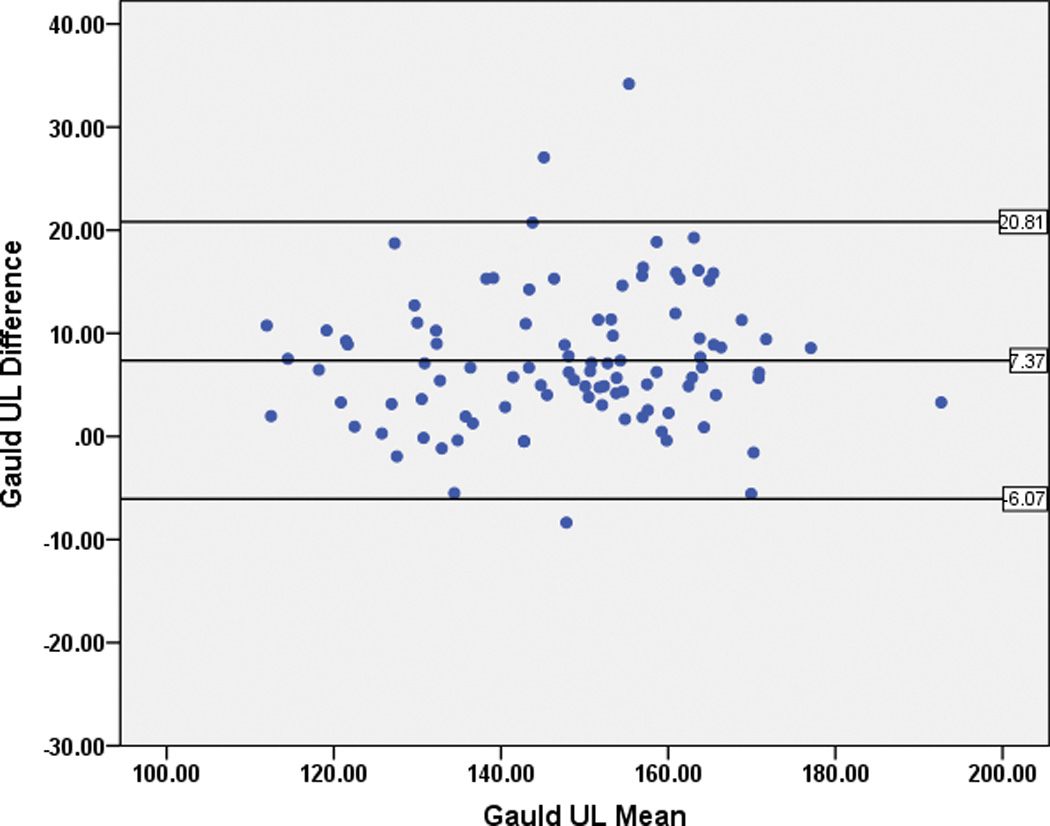
Bland-Altman plots for the Gauld Ulna Length (“Gauld UL”) revealing positive bias for height estimation.
Agreement between Standing Height and Segmental Recumbent Length
For a small subset (n=12, 58.3% male, age 11.3 ± 5.5 years) of individuals with GMFCS I–III who were able to stand straight without hip or knee flexion contractures, both standing height and supine recumbent length were measured, and agreement between the two measures was calculated. Ulna length, tibia length, and knee heights were 20.9 ± 4.3, 29.7 ± 6.8, and 39.2 ± 8.6 respectively. The mean difference between measured and recumbent length was −1.4 ± 2.2 cm, which was not significant (p>0.05).
Repeatability Analysis
For the subset of 40 individuals that underwent the repeatability analysis, the ICCs were excellent (ICC of >0.9) for all the segmental measures, recumbent length, and standing height. There were no statistically significant differences in any demographic, anthropometric, or impairment (GMFCS distribution) characteristic between the subgroup and the entire sample.
Inter-rater Reliability
The inter-rater reliability analysis demonstrated Cronbach’s α between 0.98 to 0.99 for all measures.
DISCUSSION
The primary finding of this study demonstrates that, although previously validated height estimation equations have excellent repeatability for segmental length measures, the limits of agreement with measured height is poor-to–moderate, for a clinically-representative sample of individuals with CP. The mean difference between measured and estimated height was the best (i.e., lowest) using knee height, with the equations by Stevenson et al.4 and Gauld et al.5 Ulna length demonstrated a positive bias, where the segmental height equation tended to overestimate height by an average of 6.86 cm. The 95% limits of agreement (LOA) for all of the equations were large, and thus indicate poor agreement between estimated height and actual measured height: at the lowest ±10 cm, at the highest over ±14 cm. Whereas the issue of bias (i.e. mean difference) in an equation can be addressed with the application of an appropriate correction factor, large LOAs are substantially more difficult to address.
There are two possible explanations for the poor agreement found in this study. First, the issue may have been caused by erroneous or clumsy measurement procedures, in this case either in measured height or in the segmental measures. However, we found that the repeatability of each individual measure was excellent as was the inter-rater reliability. In addition, for the small group of individuals from the repeatability subset who were able to stand and be measured, the agreement between standing height and segmental recumbent length was also excellent. Secondly, the poor agreement may be due to the prediction equation itself. Prediction equations rely on growth patterns that are both predictable and proportional. Previous studies to evaluate growth patterns in CP have documented significant discrepancy from the general population, particularly in the lowest functioning groups.11 Growth in individuals with CP is influenced by both nutritional and non-nutritional factors,12 and thus individuals tend to grow differently than their typically developing peers, with delayed onset and stunting of pubertal growth peak.13 Moreover, evidence suggests that growth and development of the affected side or extremities may be compromised to a greater extent than the less affected limbs, with smaller limb size and delayed skeletal maturation noted in the more affected side in hemiplegic CP.12
Our data also indicate that growth patterns may be influenced by the degree of neurologic involvement. The equations by Gauld et al.5 were constructed from typically-developing Australian schoolchildren with no spinal deformities, no issues related to muscular weakness or abnormal tone, and/or no any other medical illnesses or growth disturbance. Interestingly, using the knee height equation by Gauld and colleagues, our study demonstrated that height estimation revealed a mean difference close to zero in mild CP; however, for higher GMFCS levels the equation significantly underestimated height. Conversely, the prediction equation using ulna length by Gauld and colleagues overestimated height in both persons with GMFCS I–III as well as among those with GMFCS IV–V. The pattern of height underestimation when using knee height, and overestimation with ulna length in more severely impaired persons with CP, indicates that the deviation in growth patterns in upper and lower body segments alters as severity increases. These data suggest that lower extremity growth may be more hypoplastic than upper extremity growth and can result in bias when attempting to predict height in this population. In an effort to better understand these findings, we explored the deviation in ratios between ulna length and knee height, across GMFCS levels. After adjustment for age, the ratio was indeed greater in patients with GMFCS IV–V as compared to GMFCS I–III (β=0.03, p<0.001), thus supporting our agreement findings. Unfortunately, we could not account for the general trend of lower age among the mildly affected subjects. Thus, it is indeed possible that the associations between segmental lengths and height may be confounded by the interaction between age and GMFCS. Future research is needed to account for age or maturation and level of impairment when determining growth trajectories in CP.
An argument may be made that summing the individual segmental recumbent lengths is an inaccurate method to estimate actual height. However, this method attempts to reduce the error related to contractures as the segments are measured separately. Unfortunately, there is no gold-standard for height assessment among individuals with moderate to severe CP, who have significant contractures and scoliosis. Indeed, scoliosis is a common problem in CP (~57% of the current sample), and was found to negatively affect height once age was accounted for. Segmental length has been used previously as an alternative to standing height,14 and thus provides clinicians a legitimate way to directly measure height with the least error. Future studies are certainly needed to confirm this method in a larger, more heterogeneous sample of children, adolescents, and adults with CP. Our mean difference measurement for younger individuals with GMFCS levels I–III was close to zero when using knee height equation by Stevenson et al.,4 which included only individuals with no contractures or spinal deformities. However, for individuals with GMFCS levels IV–V, knee height significantly underestimated recumbent length. This seems to be a result of lower extremity growth and development abnormality, which leaves leg length significantly affected. Thus, for a given lower extremity length (i.e. knee height), the prediction equation seems to estimate a shorter trunk than actual trunk length.
CONCLUSION
Height measurement among individuals with CP is difficult to perform, due to factors such as contractures, scoliosis, and muscle spasticity. Height estimation equations may be used for individuals with little-to-no growth abnormalities, and/or musculoskeletal orthopedic conditions that would influence standing erect with perfect posture. For individuals with greater impairment, caution is strongly warranted when using prediction equations, as there is fair to poor agreement and high risk for bias. Conversely, estimation of height using a segmental approach, as described in this study, seems to be the most repeatable and reliable method. Thus, direct measurement in the supine position may be the only way to accurately monitor growth in the clinical setting, as growth is neither predictable nor proportional in CP. Regardless, the use of an estimated height for calculation of BMI may be precarious since height is squared and thus any error is exponential.
Limitations of the supine segmental measurements still include scoliosis and fixed contractures, but the problems with disproportionate growth due to neurological and nutritional factors are inherently controlled. When an estimation of height is needed, caution must be taken particularly for individuals with greater impairment (e.g., GMFCS IV and V). In all cases, if standing height cannot be obtained, the preferred method is to take the sum of the individual segmental lengths as a proxy of standing height. For children less than 12 years, the equation Stevenson et al. is the least biased and provides the narrowest limits of agreement. For individuals over age seven years, the equation published by Gauld et al. may be appropriate. For individuals with GMFCS levels IV–V, the equation by Gauld et al. demonstrates less bias than the equation by Stevenson.
Footnotes
Disclosures:
Financial disclosure statements have been obtained, and no conflicts of interest have been reported by the authors or by any individuals in control of the content of this article.
REFERENCES
- 1.Yeargin-Allsopp M, Van Naarden Braun K, Doernberg NS, Benedict RE, Kirby RS, Durkin MS. Prevalence of cerebral palsy in 8-year-old children in three areas of the United States in 2002: a multisite collaboration. Pediatrics. 2008 Mar;121(3):547–554. doi: 10.1542/peds.2007-1270. [DOI] [PubMed] [Google Scholar]
- 2.Kirby RS, Wingate MS, Van Naarden Braun K, et al. Prevalence and functioning of children with cerebral palsy in four areas of the United States in 2006: a report from the Autism and Developmental Disabilities Monitoring Network. Res Dev Disabil. 2011 Mar-Apr;32(2):462–469. doi: 10.1016/j.ridd.2010.12.042. [DOI] [PubMed] [Google Scholar]
- 3.Chumlea WC, Guo SS, Steinbaugh ML. Prediction of stature from knee height for black and white adults and children with application to mobility-impaired or handicapped persons. J Am Diet Assoc. 1994 Dec;94(12):1385–1388. 1391. doi: 10.1016/0002-8223(94)92540-2. quiz 1389–1390. [DOI] [PubMed] [Google Scholar]
- 4.Stevenson RD. Use of segmental measures to estimate stature in children with cerebral palsy. Arch Pediatr Adolesc Med. 1995 Jun;149(6):658–662. doi: 10.1001/archpedi.1995.02170190068012. [DOI] [PubMed] [Google Scholar]
- 5.Gauld LM, Kappers J, Carlin JB, Robertson CF. Height prediction from ulna length. Dev Med Child Neurol. 2004 Jul;46(7):475–480. doi: 10.1017/s0012162204000787. [DOI] [PubMed] [Google Scholar]
- 6.Bland JM, Altman DG. Measuring agreement in method comparison studies. Stat Methods Med Res. 1999 Jun;8(2):135–160. doi: 10.1177/096228029900800204. [DOI] [PubMed] [Google Scholar]
- 7.Palisano R, Rosenbaum P, Walter S, Russell D, Wood E, Galuppi B. Development and reliability of a system to classify gross motor function in children with cerebral palsy. Dev Med Child Neurol. 1997 Apr;39(4):214–223. doi: 10.1111/j.1469-8749.1997.tb07414.x. [DOI] [PubMed] [Google Scholar]
- 8.Rosenbaum P, Palisano R, Bartlett D, Galuppi B, Russel D. Development of the Gross Motor Functional Classification System for cerebral palsy. Developmental Medicine and Child Neurology. 2008;50:249–253. doi: 10.1111/j.1469-8749.2008.02045.x. [DOI] [PubMed] [Google Scholar]
- 9.McCormick A, Brien M, Plourde J, Wood E, Rosenbaum P, McLean J. Stability of the Gross Motor Function Classification System in adults with cerebral palsy. Developmental Medicine and Child Neurology. 2007;49:265–269. doi: 10.1111/j.1469-8749.2007.00265.x. [DOI] [PubMed] [Google Scholar]
- 10.Jahnsen R, Aamodt G, Rosenbaum P. Gross Motor Function Classification System used in adults with cerebral palsy: agreement of self-reported versus professional rating. Developmental Medicine and Child Neurology. 2006;48:734–738. doi: 10.1017/S0012162206001575. [DOI] [PubMed] [Google Scholar]
- 11.Day SM, Strauss DJ, Vachon PJ, Rosenbloom L, Shavelle RM, Wu YW. Growth patterns in a population of children and adolescents with cerebral palsy. Dev Med Child Neurol. 2007 Mar;49(3):167–171. doi: 10.1111/j.1469-8749.2007.00167.x. [DOI] [PubMed] [Google Scholar]
- 12.Stevenson RD, Roberts CD, Vogtle L. The effects of non-nutritional factors on growth in cerebral palsy. Dev Med Child Neurol. 1995 Feb;37(2):124–130. doi: 10.1111/j.1469-8749.1995.tb11981.x. [DOI] [PubMed] [Google Scholar]
- 13.Worley G, Houlihan CM, Herman-Giddens ME, et al. Secondary sexual characteristics in children with cerebral palsy and moderate to severe motor impairment: a cross-sectional survey. Pediatrics. 2002 Nov;110(5):897–902. doi: 10.1542/peds.110.5.897. [DOI] [PubMed] [Google Scholar]
- 14.Krick J, Murphy-Miller P, Zeger S, Wright E. Pattern of growth in children with cerebral palsy. J Am Diet Assoc. 1996 Jul;96(7):680–685. doi: 10.1016/s0002-8223(96)00188-5. [DOI] [PubMed] [Google Scholar]