Abstract
Modeling protein complex structures based on distantly related homologues can be challenging due to poor sequence and structure conservation. Therefore, utilizing even low-resolution experimental data can significantly increase model precision and accuracy. Here, we present models of the two key functional states of the yeast γ-tubulin small complex (γTuSC): one for the low-activity “open” state and another for the higher-activity “closed” state. Both models were computed based on remotely related template structures and cryo-EM density maps at the 6.9 Å and 8.0 Å resolution, respectively. For each state, extensive sampling of alignments and conformations was guided by the fit to the corresponding cryo-EM density map. The resulting good-scoring models formed a tightly clustered ensemble of conformations in most regions. We found significant structural differences between the two states, primarily in the γ-tubulin subunit regions where the microtubule binds. We also report a set of chemical cross-links that were found to be consistent with equilibrium between the open and closed states. The protocols developed here have been incorporated into our open-source Integrative Modeling Platform (IMP) software package (http://integrativemodeling.org), and can therefore be applied to many other systems.
Keywords: microtubule nucleation, allosteric regulation, integrative modeling, computational structure prediction, comparative models
Introduction
Biologists are often interested in computing structural models of protein assemblies for which electron microscopy density maps and atomic structures of remotely related systems are available. In such cases, the integrative approach that relies on input structural information of multiple types can provide models that are more accurate, precise, and complete than models based on traditional methods, such as X-ray crystallography, NMR spectroscopy, and electron microscopy (Alber et al., 2008; Alber et al., 2007; Russel et al., 2012; Sali et al., 2015; Ward et al., 2013). Key challenges include: data ambiguity, such as regions of a density map that are not assignable to particular components of the system or cross-links that may apply to one of many states or copies of the structure; information uncertainty, including the limited resolution of the map, errors in the template structures, and target-template differences; and data completeness, including missing regions of the density map and incomplete coverage by the templates and cross-links (Schneidman-Duhovny et al., 2014). While numerous tools exist to construct models based on density maps (Topf et al., 2008; Trabuco et al., 2008), it is essential to find all models that fit the data, allowing an estimate of model precision. Here, we describe an ad hoc approach to inferring a pseudo-atomic model from a cryo-EM density map and atomic structures of related proteins, with an estimate of model precision based on variation among good-scoring models, and an estimate of model accuracy based on agreement with an independently determined set of chemical cross-links. We illustrate the approach by its application to the γ-tubulin small complex (γTuSC).
γ-tubulin complexes control the location and timing of microtubule nucleation. γTuSC is a 300 kDa complex consisting of four components: GCP2, GCP3, and two copies of γ-tubulin in a V-shaped structure with the γ-tubulin subunits at the top (Choy et al., 2009; Kollman et al., 2008). As revealed by an ∼8 Å cryo-EM map, the complex assembles into a single helical turn in yeast consisting of 7 γTuSC units, leaving 13 exposed γ-tubulins, thus allowing 13-protofilament microtubule filaments to template from the complex (Kollman et al., 2010). γTuSC comprises the “minimal” nucleation machinery, as it lacks numerous accessory proteins found in related complexes from other species. In previous studies, we have shown that γTuSC adopts two conformations that differ significantly in the geometry of the γ-tubulin ring, a low-activity “open” state and a higher-activity “closed” state, and have proposed that this conformational switch provides a mechanism for regulating microtubule nucleation in vivo (Kollman et al., 2011). We have reported the cryo-EM structure of the “open” state at 8 Å resolution, and more recently reported the cryo-EM structure of the “closed” state at 6.9 Å resolution, by trapping this transient conformation with engineered disulfides (Kollman et al., 2015). Here, we describe reliable pseudo-atomic models of both open and closed complexes, and present new data consistent with equilibrium between two conformational states.
Materials and Methods
Closed-state model building
We followed an iterative procedure (Fig. 1) to generate and fit comparative models (Topf et al., 2006). The initial alignment of the entire TUBGCP family was performed in Promals3D (Pei et al., 2008). Additionally, we aligned yeast γ-tubulin to representative proteins from the tubulin family (including human γ-tubulin, the template). After alignment, regions of the human GCP4 sequence that were not present in the crystal structure were omitted. We utilized an iterative procedure to improve the alignment and optimize models with respect to the density map, including the following steps:
Four copies of each template (human GCP4 and human γ-tubulin) were rigidly docked into the closed-state map to form an approximate shape of two side-by-side γTuSC structures using UCSF Chimera (Pettersen et al., 2004).
The template complex in step 1 was used as the basis for simultaneous homology modeling of yeast GCP2, GCP3, and γ-tubulin in MODELLER using the current alignment. Symmetry restraints were added to preserve the complex structure.
The γTuSC homology model was flexibly fitted into the closed density map using Molecular Dynamics Flexible Fitting (MDFF) (Trabuco et al., 2008), with additional secondary structure restraints. Symmetry restraints were added between the two copies of γTuSC. The “gscale” parameter of MDFF was set to 1.0, and 200ps simulations were run.
Upon inspection of the fitted model, the pairwise human-GCP4/yeast-GCP2 and human-GCP4/yeast-GCP3 alignments were edited. Changes included adding secondary structure restraints when these elements were clearly observed in the density map and were predicted using PSIPRED (Buchan et al., 2013) and removing long insertions (>5 residues) unless the insertions could be unambiguously assigned to density. The γ-tubulin alignment was left unchanged.
Fig. 1.
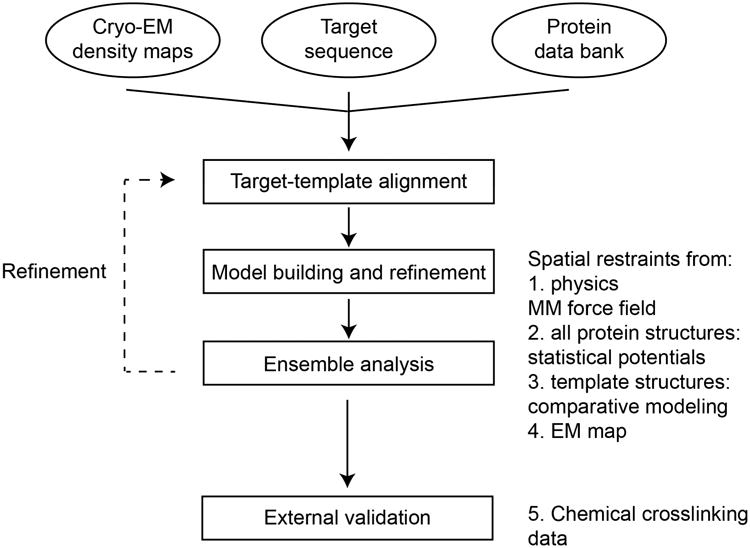
Method overview.
Steps 2-4 were repeated until no further adjustments to the alignment improved the model. With the alignment fixed via the above procedure, we produced 300 comparative models as in Step 2. Finally, these models were optimized into the closed-state density map using MDFF with the same restraints as above. Results contained a number of clear outliers, with structural helices crossing obvious helices in the map. We removed these common local minima by performing k-means clustering with k=10, keeping the largest two clusters containing 158 total structures, which formed a narrow ensemble with average Cα root-mean-square fluctuation (RMSF) 1.88 Å. The top 5 scoring structures from each cluster were deposited into the PDB: 5FLZ.
Open-state model building
Reasoning that the closed-state model was more accurate than the starting comparative model, we used the closed-state model ensemble as the initial structures for open-state modeling. For every closed model, each component was rigidly fitted into the open-state density map. These models were refined into the open-state density map using MDFF, with the “gscale” parameter set to 0.1 (reflecting our increased uncertainty in the data due to its lower resolution) and allowed to sample for 250ps. Secondary structure, domain (rigidity), and symmetry restraints were added as in the closed state. The open-state ensemble consisted of all fitted structures, since the lower resolution did not allow us to remove obvious outliers. We performed k-means clustering with k=10 and selected the top-scoring structure in each cluster—this forms the ensemble deposited into the PDB: 5FM1.
Model Evaluation
To evaluate model precision, we calculated the RMSF for each Cα position in the model ensemble. To evaluate sampling density, we divided the ensemble into half sets, computed the RMSF values for each set, and verified that they were similar. For contact evaluation (Table S2), UCSF Chimera's “find H-bond” tool was used on each model in the ensemble, relaxing H-bond parameters by 2 Å and 90°. The final reported contacts were those present in at least 25% of the structures in each ensemble.
To evaluate model accuracy, we compared models against external data not used in the modeling process. A set of 135 chemical cross-links, with DSS as the linker, was obtained. We computed the distance between cross-linked residues within the closed- and open-state models, allowing for ambiguity in the cross-links’ assignments due to the presence of two γ-tubulin molecules in γTuSC, as well as multiple copies of γTuSC. A cross-link was considered a “violation” if the median ensemble distance was greater than a threshold in both the closed- and open-state models. The maximal cross-link distance of 35 Å was based on flexibility of the cross-linker (Chen et al., 2010).
Cross-linking of recombinant γTuSC and mass spectrometry analysis
γTuSC (146 μg protein in 331 μL 40 mM HEPES, 100 mM NaCl, pH 8) was cross-linked for 2 min at room temperature with disuccinimidyl suberate (Pierce, 0.86 mM final). The reaction mix was quenched with 26 μL of 500 mM NH4HCO3 and the buffer was exchanged to 40 mM HEPES, 500 mM NaCl, pH 7.5 using protein desalting spin columns (Pierce) according to the manufacturer's instructions. Two 90 uL aliquots of cross-linked protein were subsequently reduced with 10 mM dithiothreitol for 30 min at 37°C and alkylated with 15 mM iodoacetamide for 30 min at room temperature. Heavy oxygen labeling (Zelter et al., 2010) was performed by adding 25% volume of heavy water to one (labeled) aliquot. A second, unlabeled, sample was produced by adding 25% volume of standard water. Both aliquots were then separately subjected to overnight digestion with trypsin at a substrate to enzyme ratio of 60:1. Samples were acidified with 5 M HCl and stored at -80°C.
0.5 to 1.5 μg of each sample was loaded onto a fused-silica capillary tip column (75-μm i.d.) packed with 40 cm of Reprosil-Pur C18-AQ (3-μm bead diameter, Dr. Maisch). Peptides were eluted from the column at 250 nL/min using a gradient of 2-35% acetonitrile (in 0.1% formic acid) over 120 min, followed by 35-60% acetonitrile over 10 min. Mass spectrometry was performed on a Q-Exactive (Thermo Scientific), operated using data dependent acquisition where a maximum of six MS/MS spectra were acquired per MS spectrum (scan range of m/z 400-1600). At m/z 200, the resolution for MS and MS/MS was 70,000 and 35,000, respectively. Six technical replicates were performed using the heavy oxygen labeled sample and 14 technical replicates were performed using the unlabeled sample. Cross-linked peptides were identified using the Kojak cross-link identification software (Hoopmann et al., 2015) (version 1.4.1) available at (http://www.kojak-ms.org/). The Kojak results of all 20 LCMS runs were combined and exported to Percolator (Kall et al., 2007) to produce a statistically validated set of cross-linked peptide identifications at a false discovery rate threshold of 1%.
The full cross-link dataset is available online at http://proxl.yeastrc.org/proxl/viewProject.do?project_id=15.
Results
Initial model accuracy and coverage
GCP2 and GCP3 are members of the TUBGCP family, which are named Spc97 and Spc98 in yeast. The TUBGCP family also includes GCP2/3/4/5/6 in humans. The architecture of the complex is shown in Fig. 2A.
Fig. 2.
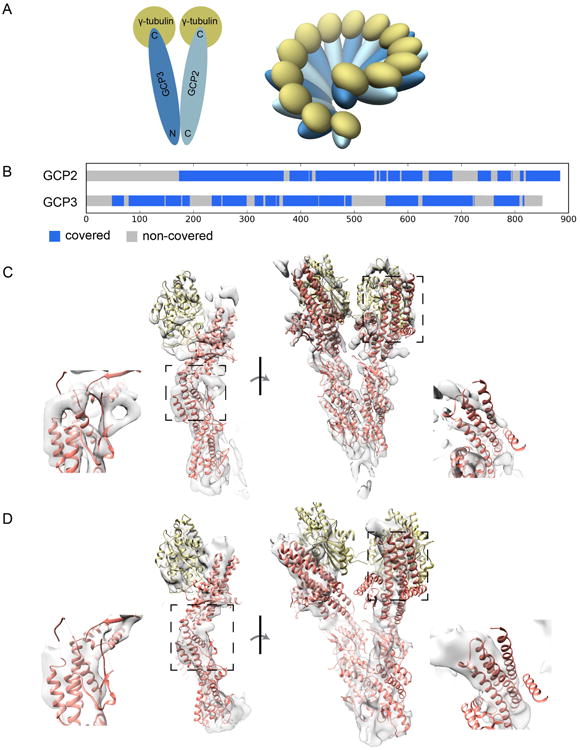
Data overview. (A) Architecture of γ-TuSC. Left, single γ-TuSC V structure with sequence endpoints. These colors are used in all figures. Right, ring structure. (B) Coverage map. Blue regions have structure coverage from the homologue GCP4. (C) Rigid fit of templates into closed cryo-EM density map. Details indicate regions of significant difference between the model and the map. (D) Rigid fit of templates into open cryo-EM density map.
A crystal structure of human GCP4 provided a suitable starting point for homology modeling of both GCP2 and GCP3 (Guillet et al., 2011) (Fig. 2B,C). Additionally, a crystal structure of human γ-tubulin (PDB: 3CB2) served as a suitable template (sequence identity 37%) for yeast γ-tubulin. Modeling challenges included the presence of several large insertions in GCP2 and GCP3, regions of GCP4 that were not observed in the crystallographic density, and low sequence identity to GCP4 (13% and 18% for GCP2 and GCP3, respectively) (Fig. 2B). We first modeled the closed-state structure due to the higher resolution of the corresponding EM map.
Despite the low sequence identity to the homologue GCP4, the initial model of closed- state γTuSC, consisting of flexibly fitted homology models of GCP2 and GCP3 and two identical homology models of yeast γ-tubulin, fit the EM map surprisingly well (Fig. S1). Most secondary structure elements could be uniquely assigned to regions of the map; however, there were clear errors in the length and location of some helices. We improved the model using an iterative process, editing the GCP2/3/4 alignment to improve the fit and using other sources of information to reduce over-fitting. The best-scoring model resolves the locations of all secondary structure elements, though many loops were difficult to localize (Fig. 3A). Large insertions are still missing from the model; these would likely need higher-resolution data to complete de novo building of these sections.
Fig. 3.
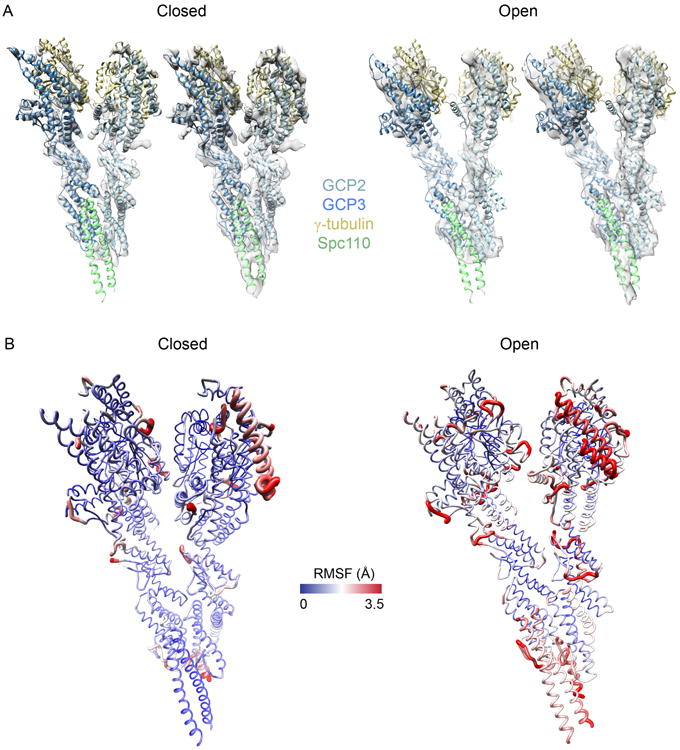
Modeling results. (A) Left, closed-state final fit, shown in closed-state density map at two different contour levels. Right, open-state final fit, again at two contour levels. (B) Sausage plots of the variability in the model ensemble fits. Red regions are more variable than blue regions. Left, closed-state; and right, open-state.
In comparison to the closed-state density map, the open-state map is lower resolution. We reasoned that the final closed-state model is likely closer to the open-state structure than the initial homology model. Therefore, we used closed-state models as starting points for open-state modeling. While the resolution limits our ability to precisely localize secondary structure segments, the overall shape could be determined from the density map. The final model has significantly improved cross-correlation in comparison to the starting closed-state model (Fig. S1).
Estimating model precision and accuracy
The final structures of the closed and open states were selected based on the crosscorrelation coefficient against their respective maps. To use any model judiciously, it is essential to assess its precision and accuracy. Here, we estimate the precision by quantifying the variation in the ensemble of good-scoring solutions. For each state, we defined the precision of each Cα position as the root-mean-square fluctuation (RMSF) from the mean position in the models scoring at least one standard deviation above the median score, with each model fit in the EM map (Fig. 3B). We verified our estimate of precision by showing similar estimates for two random halves of the solution ensemble (data not shown). Regions with high variability were primarily in loops, and appear to be largely a result of the limited map resolution. RMSF is generally larger in the closed state.
Additionally, we validated the γTuSC models by comparing them against a set of DSS cross-links not used in the modeling process (Fig. 4). An ensemble of models satisfies a given cross-link if the ensemble median of the shortest distance among possible Cα-Cα assignments within a model was less than 35 Å (corresponding to the maximum DSS length with small tolerance (Chen et al., 2010)). Only 67 of the 135 observed cross-links could be used for this assessment because others applied to missing regions. Of these 67 cross-links, 62 were consistent with either the closed or open state, including some that matched exclusively with a single state (Table S1). Of the 5 “violated” cross-links, one had median distance just over the threshold, and the remaining 4 had median distances over 50Å and are likely false positives.
Fig. 4.
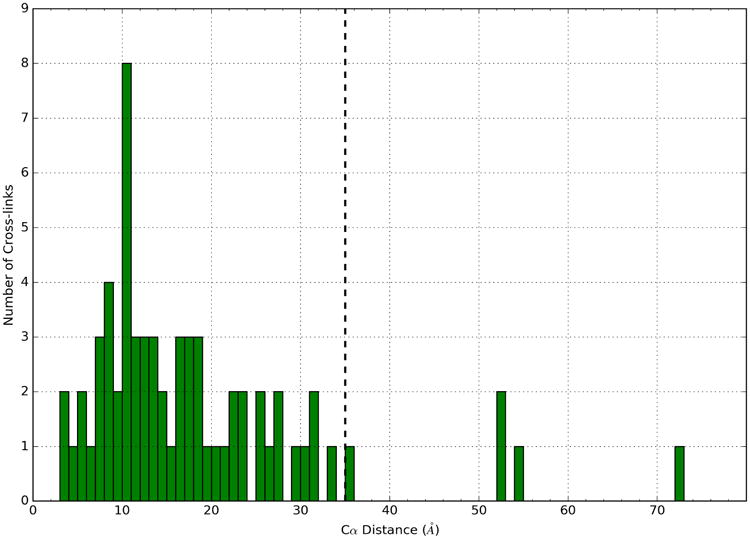
Cross-linking data analysis. Illustrating the histogram of median crosslink distances in the models. Dotted line is “violation” cutoff at 35Å.
Comparing the open and closed states
After aligning models from the two states, significant differences—which are larger than the estimated precision—are apparent (Fig. 5, Movie S1). The differences are particularly notable for the locations of the γ-tubulin subunits, which bind to the minus end α-tubulin subunits within the microtubules. In the open state, microtubule symmetry is broken: GCP2 is bent ∼8° towards the helical axis and GCP3 is bent ∼8° backwards, creating varying spacing and orientation between the γ-tubulin subunits. The helical parameters of the open state, rotation of 54.3° and rise of 22.2 Å, do not match those of a microtubule, with rotation of 55.4° and rise of 18.7 Å. In contrast, in the closed state, the γ-tubulin subunits are evenly distributed around the ring, with the same side facing the helical axis, matching the symmetry of a microtubule. Helical spacing parameters of the closed state also match those of a microtubule: rotation of 55.4° and rise of 18.8 Å. The arrangement of three contiguous α-tubulin subunits from a mammalian microtubule (PDB: 3JAL) is similar to that of the yeast γ-tubulin subunits in the closed state, with 90% Cα overlap at 4 Å. While the centers of mass of the γ-tubulin subunits vary significantly between the two states, there is no clear pivot point. The structural changes are widely distributed from the central to C-terminal regions of GCP2 and GCP3.
Fig. 5.
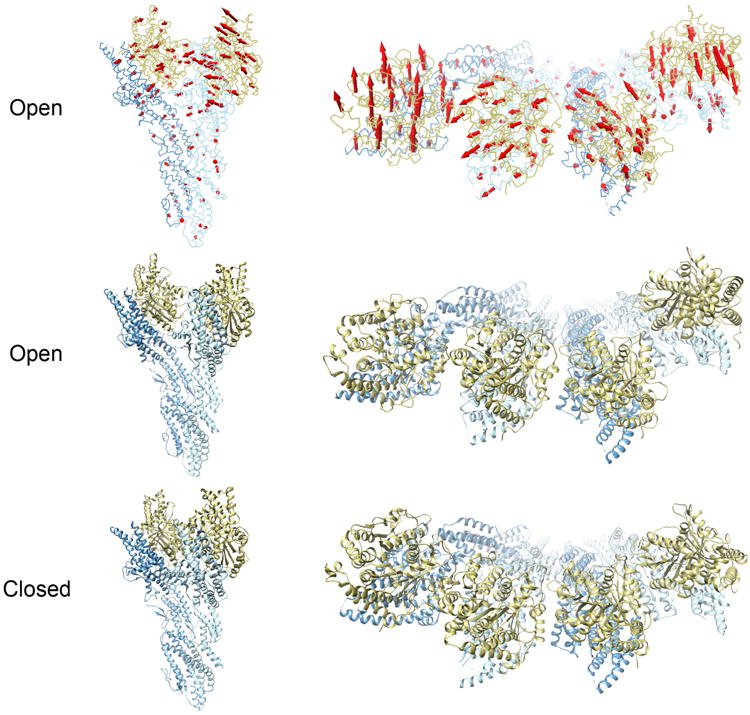
Model comparison. Arrows indicate structural changes from open (top two rows) to closed state (bottom row). Each row depicts only the state listed at the left. Left column is side view of a single γ-TuSC subunit, right column is top view showing two side-by-side subunits.
Two key interfaces underlie the stability of each state: “intra”- γTuSC (within the V structure) and “inter”- γTuSC (between each copy of the complex). We examined each interface in detail to explore which contacts are unique to each state in our models (Table S2). First, we observed that the N-terminal regions of GCP2 and GCP3 are largely static, whereas the C-terminal interfaces shear ∼15 Å. Secondly, the C-terminal contacts are primarily made between the γ-tubulin subunits. Multiple key interactions at the closed “inter” interface are also preserved at the “intra” interface, supporting the observation of symmetry. Furthermore, many of these contacts also occur at the open “inter” interface, despite the significant conformational differences. This observation is consistent with the apparent rotation around this interface (Fig. 5). In contrast, the open “intra” interface shares no contacts with the other three, though a similar list of residues are involved in contacts.
Discussion
Our goal was to compute and validate models for the two structural states of the γ-tubulin small complex, followed by comparing the two states. For modeling, we used all available information (Fig. 2). We used the known structures of homologues of GCP2, GCP3, and γ-tubulin to create initial models; used predicted secondary structure segments to explore alternative alignments; and used cryo-EM density maps to refine a model for each state. We also utilized chemical cross-linking data as an external validation, finding that 62/67, or 93%, of the cross-links are consistent with the two models (Fig. 4). This finding is particularly notable due to the low sequence identity of the templates (13%, 18%, and 37% for GCP2, GCP3, and γ-tubulin, respectively) including large insertions (Fig. 1). To evaluate the precision of these models, we performed extensive sampling and reported the fluctuations of each Cα atom (Fig. 3B). As expected, we found that the largest fluctuations were in regions with relatively low density in EM maps, which were typically loop regions. Thus, we are relatively confident in the placement of secondary structure units and the overall fold (Fig. 3A).
The structural differences between the closed and open states include both rigid body and conformational changes (Fig. 5). However, despite the significant differences between the states, many key interface contacts are preserved, particularly at the “inter”- γTuSC interface, which may be critical for ring assembly. The “intra”- γTuSC interface, while making a completely different set of contacts between the open and closed states, does involve a similar set of residues, suggesting that any evolutionary pressure that preserves ring assembly may also maintain the activation mechanism. A more complete understanding of the cause of conformational change may require modeling that is more precise, accurate, and complete, including building models for the substantial numbers of insertions (with respect to the template, human GCP4), some of which are located at γTuSC interfaces (Fig. 1).
The description of the differences between the two end states does not allow us to speculate about the order of events corresponding to a transition between them. However, the cross-linking data suggests that the system exists in equilibrium between the two states, thus transiently exploring both states; the equilibrium between the two states is suggested because both are needed to explain all the cross-links (Fig. 4). In a previous study (Kollman et al., 2015), we showed that the open state nucleates less well than the disulfide-closed state, suggesting that some activation event likely takes place in the cell to optimize nucleation efficiency.
The approach we have developed here is suitable for challenging problems, where structural information is incomplete or low-resolution. The increased uncertainty in these cases requires sampling the full range of models consistent with the available data, evaluating the precision of the ensemble, and if possible using independent data to estimate model accuracy. We have incorporated tools to perform these steps in our open-source Integrative Modeling Platform (IMP) package, available at http://integrativemodeling.org. Specific code used to generate the models is available at https://github.com/integrativemodeling/gamma-tusc. Future improvements include using scoring functions and sampling techniques that do not rely on manually set data weights—for example, Bayesian methods (Rieping et al., 2005).
Supplementary Material
Fig. S1. Progress of modeling of each state. On the left, showing three stages of the closed model: initial comparative model, improved alignment model, and flexibly fitted model. Numbers show the cross-correlation coefficient. Arrow to the right indicates using the final structure of the closed state to fit into the open map. Two open-state modeling stages are shown: initial rigid fit and flexible fit.
Table S1: All cross-links
Table S2: Contact overlap
Acknowledgments
The authors would like to thank Michael R. Hoopmann for help with cross-link identifications using Kojak. This work was funded by the Howard Hughes Medical Institute, US National Institutes of Health grants P01 GM105537, R01 GM031627 to D.A.A., P41 GM103533 to M.J.M. and the NSF Graduate Student Research Fellowship to C.H.G.
Footnotes
Accession Numbers: Coordinates have been deposited in the Protein Data Bank with accession numbers PDB: 5FLZ (closed state) and PDB: 5FM1 (open state). Closed-state and open-state maps were previously deposited as EMD-2799 and EMD-1731, respectively.
Publisher's Disclaimer: This is a PDF file of an unedited manuscript that has been accepted for publication. As a service to our customers we are providing this early version of the manuscript. The manuscript will undergo copyediting, typesetting, and review of the resulting proof before it is published in its final citable form. Please note that during the production process errors may be discovered which could affect the content, and all legal disclaimers that apply to the journal pertain.
Contributor Information
Trisha N. Davis, Email: tdavis@uw.edu.
David A. Agard, Email: agard@msg.ucsf.edu.
Andrej Sali, Email: sali@salilab.org.
References
- Alber F, Forster F, Korkin D, Topf M, Sali A. Integrating diverse data for structure determination of macromolecular assemblies. Annual review of biochemistry. 2008;77:443–477. doi: 10.1146/annurev.biochem.77.060407.135530. [DOI] [PubMed] [Google Scholar]
- Alber F, Dokudovskaya S, Veenhoff LM, Zhang W, Kipper J, Devos D, Suprapto A, Karni-Schmidt O, Williams R, Chait BT, Rout MP, Sali A. Determining the architectures of macromolecular assemblies. Nature. 2007;450:683–694. doi: 10.1038/nature06404. [DOI] [PubMed] [Google Scholar]
- Buchan DW, Minneci F, Nugent TC, Bryson K, Jones DT. Scalable web services for the PSIPRED Protein Analysis Workbench. Nucleic acids research. 2013;41:W349–357. doi: 10.1093/nar/gkt381. [DOI] [PMC free article] [PubMed] [Google Scholar]
- Chen ZA, Jawhari A, Fischer L, Buchen C, Tahir S, Kamenski T, Rasmussen M, Lariviere L, Bukowski-Wills JC, Nilges M, Cramer P, Rappsilber J. Architecture of the RNA polymerase II-TFIIF complex revealed by cross-linking and mass spectrometry. The EMBO journal. 2010;29:717–726. doi: 10.1038/emboj.2009.401. [DOI] [PMC free article] [PubMed] [Google Scholar]
- Choy RM, Kollman JM, Zelter A, Davis TN, Agard DA. Localization and orientation of the gamma-tubulin small complex components using protein tags as labels for single particle EM. Journal of structural biology. 2009;168:571–574. doi: 10.1016/j.jsb.2009.08.012. [DOI] [PMC free article] [PubMed] [Google Scholar]
- Guillet V, Knibiehler M, Gregory-Pauron L, Remy MH, Chemin C, Raynaud-Messina B, Bon C, Kollman JM, Agard DA, Merdes A, Mourey L. Crystal structure of gamma-tubulin complex protein GCP4 provides insight into microtubule nucleation. Nature structural & molecular biology. 2011;18:915–919. doi: 10.1038/nsmb.2083. [DOI] [PMC free article] [PubMed] [Google Scholar]
- Hoopmann MR, Zelter A, Johnson RS, Riffle M, MacCoss MJ, Davis TN, Moritz RL. Kojak: efficient analysis of chemically cross-linked protein complexes. Journal of proteome research. 2015;14:2190–2198. doi: 10.1021/pr501321h. [DOI] [PMC free article] [PubMed] [Google Scholar]
- Kall L, Canterbury JD, Weston J, Noble WS, MacCoss MJ. Semi-supervised learning for peptide identification from shotgun proteomics datasets. Nature methods. 2007;4:923–925. doi: 10.1038/nmeth1113. [DOI] [PubMed] [Google Scholar]
- Kollman JM, Merdes A, Mourey L, Agard DA. Microtubule nucleation by gamma-tubulin complexes. Nature reviews. Molecular cell biology. 2011;12:709–721. doi: 10.1038/nrm3209. [DOI] [PMC free article] [PubMed] [Google Scholar]
- Kollman JM, Polka JK, Zelter A, Davis TN, Agard DA. Microtubule nucleating gamma-TuSC assembles structures with 13-fold microtubule-like symmetry. Nature. 2010;466:879–882. doi: 10.1038/nature09207. [DOI] [PMC free article] [PubMed] [Google Scholar]
- Kollman JM, Zelter A, Muller EG, Fox B, Rice LM, Davis TN, Agard DA. The structure of the gamma-tubulin small complex: implications of its architecture and flexibility for microtubule nucleation. Molecular biology of the cell. 2008;19:207–215. doi: 10.1091/mbc.E07-09-0879. [DOI] [PMC free article] [PubMed] [Google Scholar]
- Kollman JM, Greenberg CH, Li S, Moritz M, Zelter A, Fong KK, Fernandez JJ, Sali A, Kilmartin J, Davis TN, Agard DA. Ring closure activates yeast gammaTuRC for species-specific microtubule nucleation. Nature structural & molecular biology. 2015;22:132–137. doi: 10.1038/nsmb.2953. [DOI] [PMC free article] [PubMed] [Google Scholar]
- Pei J, Tang M, Grishin NV. PROMALS3D web server for accurate multiple protein sequence and structure alignments. Nucleic acids research. 2008;36:W30–34. doi: 10.1093/nar/gkn322. [DOI] [PMC free article] [PubMed] [Google Scholar]
- Pettersen EF, Goddard TD, Huang CC, Couch GS, Greenblatt DM, Meng EC, Ferrin TE. UCSF Chimera--a visualization system for exploratory research and analysis. Journal of computational chemistry. 2004;25:1605–1612. doi: 10.1002/jcc.20084. [DOI] [PubMed] [Google Scholar]
- Rieping W, Habeck M, Nilges M. Inferential structure determination. Science. 2005;309:303–306. doi: 10.1126/science.1110428. [DOI] [PubMed] [Google Scholar]
- Russel D, Lasker K, Webb B, Velazquez-Muriel J, Tjioe E, Schneidman-Duhovny D, Peterson B, Sali A. Putting the pieces together: integrative modeling platform software for structure determination of macromolecular assemblies. PLoS biology. 2012;10:e1001244. doi: 10.1371/journal.pbio.1001244. [DOI] [PMC free article] [PubMed] [Google Scholar]
- Sali A, Berman HM, Schwede T, Trewhella J, Kleywegt G, Burley SK, Markley J, Nakamura H, Adams P, Bonvin AM, Chiu W, Peraro MD, Di Maio F, Ferrin TE, Grunewald K, Gutmanas A, Henderson R, Hummer G, Iwasaki K, Johnson G, Lawson CL, Meiler J, Marti-Renom MA, Montelione GT, Nilges M, Nussinov R, Patwardhan A, Rappsilber J, Read RJ, Saibil H, Schroder GF, Schwieters CD, Seidel CA, Svergun D, Topf M, Ulrich EL, Velankar S, Westbrook JD. Outcome of the First wwPDB Hybrid/Integrative Methods Task Force Workshop. Structure. 2015;23:1156–1167. doi: 10.1016/j.str.2015.05.013. [DOI] [PMC free article] [PubMed] [Google Scholar]
- Schneidman-Duhovny D, Pellarin R, Sali A. Uncertainty in integrative structural modeling. Current opinion in structural biology. 2014;28:96–104. doi: 10.1016/j.sbi.2014.08.001. [DOI] [PMC free article] [PubMed] [Google Scholar]
- Topf M, Baker ML, Marti-Renom MA, Chiu W, Sali A. Refinement of protein structures by iterative comparative modeling and CryoEM density fitting. J Mol Biol. 2006;357:1655–1668. doi: 10.1016/j.jmb.2006.01.062. [DOI] [PubMed] [Google Scholar]
- Topf M, Lasker K, Webb B, Wolfson H, Chiu W, Sali A. Protein structure fitting and refinement guided by cryo-EM density. Structure. 2008;16:295–307. doi: 10.1016/j.str.2007.11.016. [DOI] [PMC free article] [PubMed] [Google Scholar]
- Trabuco LG, Villa E, Mitra K, Frank J, Schulten K. Flexible fitting of atomic structures into electron microscopy maps using molecular dynamics. Structure. 2008;16:673–683. doi: 10.1016/j.str.2008.03.005. [DOI] [PMC free article] [PubMed] [Google Scholar]
- Ward AB, Sali A, Wilson IA. Biochemistry. Integrative structural biology. Science. 2013;339:913–915. doi: 10.1126/science.1228565. [DOI] [PMC free article] [PubMed] [Google Scholar]
- Zelter A, Hoopmann MR, Vernon R, Baker D, MacCoss MJ, Davis TN. Isotope signatures allow identification of chemically cross-linked peptides by mass spectrometry: a novel method to determine interresidue distances in protein structures through cross-linking. Journal of proteome research. 2010;9:3583–3589. doi: 10.1021/pr1001115. [DOI] [PMC free article] [PubMed] [Google Scholar]
Associated Data
This section collects any data citations, data availability statements, or supplementary materials included in this article.
Supplementary Materials
Fig. S1. Progress of modeling of each state. On the left, showing three stages of the closed model: initial comparative model, improved alignment model, and flexibly fitted model. Numbers show the cross-correlation coefficient. Arrow to the right indicates using the final structure of the closed state to fit into the open map. Two open-state modeling stages are shown: initial rigid fit and flexible fit.
Table S1: All cross-links
Table S2: Contact overlap


