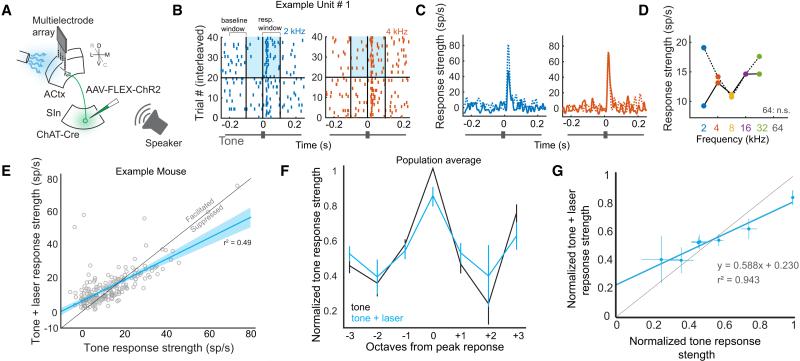
Figure 4. SInACh Neurons Facilitate Weak and Suppress Strong Auditory Responses.
(A) Schematic of the experimental strategy. AAV-FLEX-ChR2-GFP was injected into SIn of ChAT-Cre mice. Multielectrode extracellular recordings were made from ACtx while photostimulating ChR2-expressing SInACh axons and playing sounds. (B) Raster plots for an isolated single unit in response to tone playback (2 kHz, blue or 4 kHz, orange) alone (bottom half), or with photostimulation of SInACh axons (top half). The blue shaded box indicates the light stimulation period. (C) Peristimulus time histograms of response strength (RS) to tone stimulation alone (solid blue/orange traces), or tone + light stimulation (dashed blue/orange traces). (D) Tuning curve for the example unit without (solid trace) or with (dashed trace) stimulation of SInACh axons. (E) Tone RS without light plotted against tone RS with light, for a single experiment. All significantly driven tone responses for each unit are included as individual data points. On average, tone responses are facilitated with light (p = 0.0058). The lighter blue shading indicates the functional prediction bounds for the linear regression. (F) Population tuning curve without (black) and with (blue) light stimulation (data are from 5 mice). (G) Population tone RS plotted against population tone + light RS for each group of responses (± 0, 1, 2, 3 octaves from peak response). The blue line is the linear fit. Values are mean ± SEM.

