Abstract
A microarray-based analytical platform has been utilized as a powerful tool in biological assay fields. However, an analyte depletion problem due to the slow mass transport based on molecular diffusion causes low reaction efficiency, resulting in a limitation for practical applications. This paper presents a novel method to improve the efficiency of microarray-based immunoassay via an optically induced electrokinetic phenomenon by integrating an optoelectrofluidic device with a conventional glass slide-based microarray format. A sample droplet was loaded between the microarray slide and the optoelectrofluidic device on which a photoconductive layer was deposited. Under the application of an AC voltage, optically induced AC electroosmotic flows caused by a microarray-patterned light actively enhanced the mass transport of target molecules at the multiple assay spots of the microarray simultaneously, which reduced tedious reaction time from more than 30 min to 10 min. Based on this enhancing effect, a heterogeneous immunoassay with a tiny volume of sample (5 μl) was successfully performed in the microarray-integrated optoelectrofluidic system using immunoglobulin G (IgG) and anti-IgG, resulting in improved efficiency compared to the static environment. Furthermore, the application of multiplex assays was also demonstrated by multiple protein detection.
INTRODUCTION
A microarray consists of a two-dimensional array of reaction spots on a solid substrate, typically a glass slide. Each spot immobilized on the array contains a type of biological receptors that can specifically capture target molecules. Since multiple target molecules can be simultaneously measured from different reaction spots, multiplex assays can be conducted on the microarray format.1 Due to the multiplex performance, microarray technologies have been widely utilized in biological fields such as genetics,2 protein–protein interaction study,3 antibody screening,4 immunoassays,5 and food research.6 In general, microarray-based assays have been performed by soaking the array substrate in a sample solution.7 However, a depletion problem of free target molecules near the reaction surface of the microarray occurs, which is intensified as target molecules are captured by the immobilized receptors because the mass transport of target molecules depends on only diffusion under the static environment, resulting in poor reaction efficiency. Therefore, to improve the efficiency of microarray-based assays, a stirring method has been applied to solve the depletion problem by enhancing the mass transport of free target molecules compared to the static method.8 On the other hand, microfluidic approaches, such as geometric mixing structure,9 micropump integration,10 and isotachophoresis (ITP),11 have been conducted to overcome diffusion limitation. Although these approaches provide several advantages, including low sample consumption, high sensitivity, and rapid reaction time, they have some limitations for applying to conventional microarray format. Since working principle of the geometric method depended on geometrical factors such as the positions and shapes of mixing structures and microarray spots, microfluidic chips should be redesigned and refabricated for different microarrays. A micropump method required a pneumatic working for multiple microvalves with serial sequences, which was of limited practical use in biological laboratories due to the requirement of additional equipment for pressure control. In the case of ITP method, continuously monitoring the position of an ITP zone after an initial focusing was required for a redistribution step that should be performed at the constriction region of a microchannel. Besides, this method could not be applied in conventional microarray formats without channel structures, resulting in a loss of compatibility. Therefore, a novel approach was required to solve the diffusion limitation problem, which was compatible with conventional microarray formats without any requirement of an additional fabrication of a redesigned system even if different microarrays were applied. On the other hand, electrokinetic approaches have drawn much attention in recent years to solve the diffusion limitation problem. By generating a convective flow under an AC electric field, a transport time could be reduced in biological sensing applications such as bioparticle detection,12 bacteria detection,13 and immunoassays.14,15 For these approaches, however, complex fabrication processes for electrode construction were required for different microarrays, which was not cost effective. Recently, optoelectrofluidics has been actively applied in biological applications with an electrokinetic convective flow since any complex fabrication process for electrode arrangement was required. Nanoparticles could be transported and concentrated using light-actuated AC electroosmosis (ACEO) based on a photoconductive layer.16 Moreover, an optoelectrokinetic particle patterning technique based on dielectrophoresis and AC electrothermal force was mathematically investigated and applied in bead-based immunosensing.17,18 Our group also demonstrated an optoelectrofluidic immunoreaction based on the ACEO for enhancing antibody–analyte binding efficiency on a single reaction spot of a surface-based assay system in the previous work.19 By optically induced electrokinetic flows at the assay region, the binding efficiency between immobilized receptors and target molecules was enhanced due to effective mass transport of molecules. Furthermore, the convective flow could be generated by an optical manner, resulting in high compatibility. In this study, we propose a novel immunoassay system where a conventional microarray format is integrated with an optoelectrofluidic device based on the advantages of the optoelectrofluidic enhancing effect. Under the microarray-integrated optoelectrofluidic immunoassay system, multiple assay spots on the microarray can be simultaneously controlled via an optical method. To investigate an effect of the optically induced electrokinetic flows on the microarray, multiple immunoreactions are performed using immunoglobulin G (IgG) and anti-IgG, by comparing the results of mathematical simulation studies. Furthermore, a quantitative measurement of a target analyte and an applicability of multiple protein detection are demonstrated.
MATERIALS AND METHODS
Materials
Fluorescent nanoparticle (50 nm) was obtained from Polysciences (Warrington, PA, USA). Quantum dot (with a fluorescence emission at 605 nm) conjugated anti-rabbit IgGs from goat and quantum dot (with a fluorescence emission at 525 nm) conjugated anti-mouse IgGs from goat were purchased from Thermo Fisher Scientific (Waltham, MA USA). Anti-goat IgGs, rabbit IgGs, mouse IgGs, bovine serum albumin (BSA), Tween 20, glutaraldehyde solution, (3-aminopropyl)trimethoxysilane (APTMS), and ethanol were obtained from Sigma-Aldrich (St. Louis, MO, USA). Phosphate-buffered saline (PBS) containing 0.05% (v/v) Tween-20 (PBST) was used as a washing buffer. A buffer solution containing 1% BSA was used as a blocking solution. Diluted PBS (25 μS/cm) was used as a reaction buffer. Doubly deionized water was used throughout the experiments.
Device fabrication
The optoelectrofluidic device was composed of two transparent glass electrodes, which were coated with indium tin oxide (ITO) on a glass substrate. One transparent electrode was used as a substrate for microarray preparation and another was a photoconductive layer-deposited electrode. The photoconductive layer consisted of three layers, including a 50 nm-thick heavily doped hydrogenated amorphous silicon (n+ a-Si:H) layer, a 1 μm-thick intrinsic hydrogenated amorphous silicon (intrinsic a-Si:H) layer, and a 20 nm-thick silicon nitride (SiNx) layer, which was fabricated by a plasma enhanced chemical vapor deposition method. Detailed fabrication processes have been described in the previous paper.20
Preparation of microarray
First, an ITO-glass slide was cleaned by serially sonicating in acetone solution for 10 min and isopropyl alcohol solution for 10 min and was rinsed by deionized water three times. After a glass slide was dried at room temperature, the cleaned slide was immersed in ethanol with 10% APTMS at room temperature for 1 h to form self-assembled monolayers (SAMs) of aminosilane, and rinsed with ethanol, the reaction buffer, and deionized water three times. It was then dried at room temperature and heat-treated at 120 °C for 5 h. After cooling, the amino groups formed on ITO-glass slide were activated with 2.5% glutaraldehyde solution for 1 h at room temperature, dipped into deionized water for 1 min, and dried at room temperature. Protein assay spots were produced using a pin-type microarrayer (OmniGrid Accent™ Microarrayer; Digilab Inc., MA, USA) onto the activated-glass slide.
Experimental setup of optoelectrofluidic immunoassay system
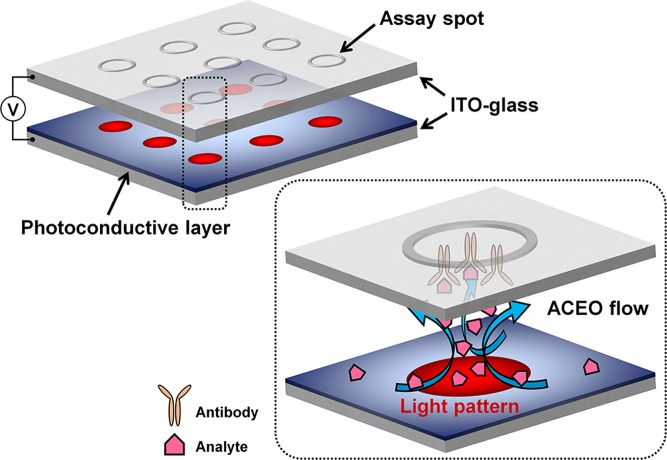
An experimental system is illustrated in Figure 1. Five microliters of sample droplet were placed in a 30 μm-height liquid chamber between the transparent glass slide with a microarray and the photoconductive layer-deposited glass slide. An AC voltage generated from a function generator (AFG310; Tektronix, OR, USA) was applied across the ITO electrodes. A light source (2.2 × 10⁴ lx) was patterned with a dynamic light pattern through a liquid crystal display in a conventional projector (CP-S225; Hitachi, Tokyo, Japan) by a common software installed on a laptop. The immunoassay results within the optoelectrofluidic device were observed using a fluorescence microscope (IX72; Olympus, Tokyo, Japan) and captured by a charge-coupled device (DP72; Olympus).
FIG. 1.
Schematic illustration of a microarray-integrated optoelectrofluidic immunoassay system. Optically induced AC electroosmosis (ACEO) flows actively transport target analytes to the assay spots on a microarray to improve the assay efficiency, which are controlled simultaneously by a microarray-patterned light.
Immunoassay procedure
Prior to sample injection, excess active sites of microarray-spotted functionalized glass slide were blocked by 1% BSA solution for 30 min to reduce nonspecific binding, and the glass slide was rinsed by the washing buffer. After assembling the microarray slide where antibodies were immobilized on the photoconductive layer-coated glass slide to form an optoelectrofluidic device, an antibody–antigen reaction was performed under the optoelectrofluidic enhancing manner where a light pattern was projected on the assay spot with an applied AC voltage with 15 Vpp at 10 kHz between two glass slides. Following the reaction, the microarray slide was detached from the optoelectrofluidic device and then was serially rinsed with PBST, PBS, and deionized water to remove unbound sample. After the final washing step, the results were imaged for data acquisition by a fluorescence microscope. Fluorescent intensities in experimental results were determined by subtracting background signal. Error bars represent the standard deviation between the replicate spots on a single microarray chip.
RESULTS AND DISCUSSION
Optically induced ACEO with microarray format
The AC electroosmosis is one of the electrohydrodynamic phenomena widely utilized in microfluidic approaches, which is caused by the motion of ions in the electric double layer along the surface of electrode by tangential electric field. When a light pattern is irradiated onto the photoconductive layer of an optoelectrofluidic device, the projected region becomes conductive, resulting in a nonuniform electric field between two electrode layers under an AC voltage source. An optically induced nonuniform electric field generates strong convective flows, which is defined by
| (1) |
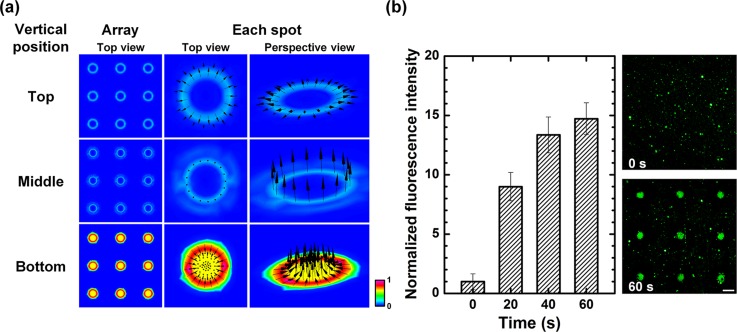
where λD is the Debye length; η is the fluid viscosity; σq is the charges contained in the Debye layer; and Et is the tangential electric field.21 Then, the electrically driven body force creates fluid's motion called ACEO. In order to investigate the optically induced ACEO with a microarray-typed light pattern in the proposed system, a commercial software, CFD − ACE + (ESI Group, Huntsville, AL, USA), was used for computational fluidic dynamic (CFD) analysis. The continuity and momentum equations are ∇·u = 0 and ∂ρu/∂t + u·∇ρu = −∇p + ∇·(μ∇u) + εκ2ζ∇V, respectively, where u is the fluid's velocity, t is the time, p is the pressure, ρ is the liquid's density, μ is the viscosity, κ is the inverse of Debye thickness, ζ is the zeta potential, ε is the electrical permittivity, and V is the electric potential. The applied voltage and the Debye length were assumed to be 15 V at 10 kHz and 80 nm. The chamber height was 30 μm. The liquid conductivity and the liquid permittivity were 2.5 × 10⁻³ S/m and 80.2, respectively. When a light pattern with a 3 × 3 microarray format where the center-to-center distance between the spots was 600 μm and each spot had a diameter of 200 μm was irradiated on the photoconductive layer, multiple convective flows with a 3 × 3 microarray pattern were simultaneously generated on the device with a maximum velocity magnitude value of 1.1 mm/s (Figure 2(a)). Each light pattern generated counter-rotating convective flows, which showed strong flow streams from the surroundings to the light pattern at the side of photoconductive layer (bottom position), vertical flow streams at the middle of chamber, and spreading flow streams at the side of transparent electrode (top position). These counter-rotating convective flows could be utilized to transport molecules from the surrounding region to the irradiated region. The existence of ACEO flow could be experimentally verified using nanoparticles (Figure 2(b)). Due to the multiple counter-rotating convective flows, nanoparticles were concentrated at the center of each light pattern under the ACEO flow. Here, an electrothermal flow could be ignored because the electrothermal flow in an optoelectronic tweezers system required an irradiation with a high energy source (>100 W/cm2),22 which was much stronger than a light source used in this work. Experimental results showed temporal changes of the concentration of nanoparticles with a microarray-typed arrangement, indicating that simultaneous generation of ACEO flows on the multiple spots of the microarray could be successfully controlled by applying optically induced convective flows. Furthermore, the arrangement of ACEO flow patterns could be freely adjusted via an optical manner, resulting in high compatibility with microarray formats.
FIG. 2.
Simultaneous control of AC electroosmotic (ACEO) flows on multiple spots of a microarray format. (a) Mathematical simulation results of ACEO flow velocity distribution under an applied AC voltage of 15 Vpp at 10 kHz. (b) Experimental results for the confirmation of optically induced ACEO flow generation with a 3 × 3 microarray-typed pattern using nanoparticles. Fluorescence intensities were normalized by the initial intensity (at 0 s) (scale bar: 200 μm, n = 9).
Optically controlled enhancement of immunoreaction on microarray
Reaction kinetics between antibody and analyte at the surface of microarray can be described as a two-step process, including a mass transport step and a chemical reaction step, which is described as
| (2) |
where A0 is the concentration of analyte in solution, As is the concentration of the analyte near the surface, B is the concentration of free antibody immobilized on a surface, AB is the concentration of binding complex of antibody and antigen, km and k−m are the mass transport coefficients for the analyte flux to the sensor surface and away from it, and kon and koff are the on and off rates of the bimolecular interaction.23 The chemical reaction is assumed to follow the pseudo-first order Langmuir kinetic mode and can be expressed by
| (3) |
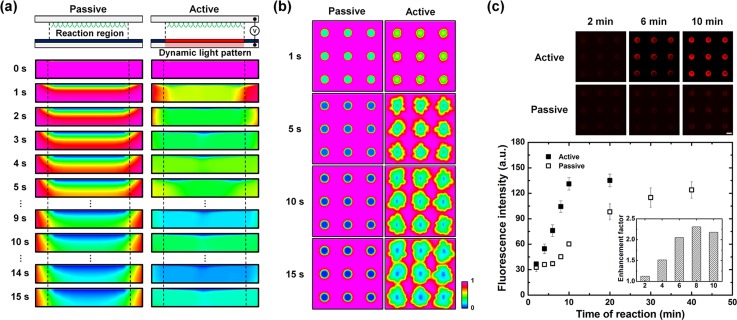
where [M1] is the concentration of the antibody–analyte complex, Cs is the concentration of the analyte at the reaction surface by mass transport, [M0] is the surface concentration of the antibody, and k1 and k−1 are the rate of association and dissociation, respectively.24,25 Generally, microarray-based immunoassay systems follow diffusion-limited reaction due to the surface-based reaction. That is, the total reaction time of such systems is determined by the diffusion rate to transport molecules rather than the reaction rate at the surface. Therefore, the mass transport of target molecules in microarray systems was studied to improve the assay efficiency. First, in order to investigate mass transport phenomena on the microarray-integrated optoelectrofluidic system, mathematical simulation studies were conducted (Figures 3(a) and 3(b)). The simulation results showed that an analyte depletion problem was observed at the reaction region under the passive mode where the analyte transport depended on only random diffusion due to the decrease of local concentration of free analyte. On the other hand, in the case of active mode, electrohydrodynamic flows were applied with a dynamically changed light pattern (Figure S1 in the supplementary material).26 The decreased local concentration of free analyte at the reaction region could be continuously replenished from the surrounding region thanks to the optically induced convective flows, which overcame the analyte depletion problem occurred on the assay spots of the microarray system under the passive mode. Based on the simulation results, the optically induced ACEO flow with array-typed light patterns was applied to improve the immunoreaction efficiency on a microarray system (Figure 3(c)). The experimental results showed that the reaction time more than 30 min was required for immunoreaction under the passive mode. However, the reaction time could be reduced to 10 min via an optoelectrofluidic manner with an enhancement factor of 2.2. Furthermore, the convective flow for enhancing immunoreaction could be continuously generated with only 5 μl sample droplet rather than continuous flow injection, which was thought to be a very significant issue by considering expensive reagents for immunoassays. In this respect, the proposed system benefits from reduced time and cost.
FIG. 3.
Optoelectrofluidic enhancement of immunoreaction on multiple spots of a microarray. (a) Simulation results of the temporal distribution change of free analyte concentration at an assay spot with a side view under an applied AC voltage of 15 Vpp at 10 kHz. (b) Simulation results of the temporal distribution change of free analyte concentration on a 3 × 3 microarray with a top view. (c) Fluorescence immunoreaction results with respect to an optoelectrofluidic manner. The enhancement factor in an inset indicates the ratio of fluorescence intensity under the active mode compared to the passive mode (scale bar: 200 μm, n = 9).
Effect of distance between assay spots
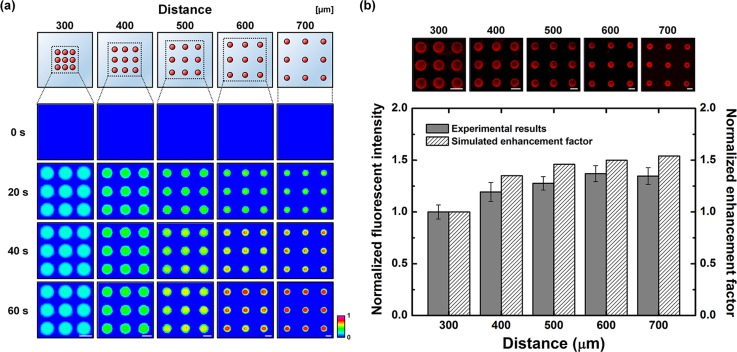
Conventionally, assay spots in a microarray format were produced with a uniform spacing distance. To investigate the effect of the distance on immunoreaction efficiency, various microarray configurations with different spacing distances from 300 to 700 μm were applied to immunoreaction within an optoelectrofluidic enhancing system (Figure 4). A mathematical simulation study showed that the binding efficiency was improved as the distance increased. This tendency with different distances seemed to be caused by mass transport phenomena. When an AC voltage was applied with the microarray-typed light patterns, optically induced ACEO flows were generated on each assay spot with the identical distance. These counter-rotating convective flows delivered target analytes from the surroundings to the reaction region. At this time, the amount of analytes in the space between two assay spots was divided and delivered by multiple convective flows induced on both assay spots. Therefore, the potential amount of target analytes to be replenished for reaction surfaces via an optically induced electrokinetic flow increased as the spacing distance between assay spots increased, resulting in the improvement of binding efficiency. Based on this mass transport phenomenon, the experimental results showed that the immunoreactions were improved according to the distance and saturated after the distance of 600 μm in the proposed system.
FIG. 4.
Effect of distance between the assay spots of a microarray on optoelectrofluidic immunoreaction. (a) Simulation results of the temporal distribution change of antibody–analyte complexes under an applied AC voltage of 15 Vpp at 10 kHz with different distance conditions. (b) Fluorescence immunoreaction results and simulated enhancement factors. The simulated enhancement factor indicates the ratio of initial slope of temporal immunoreaction results compared to the passive mode. The results were normalized by the value from the distance condition of 300 μm (scale bar: 200 μm, n = 9).
Optoelectrofluidic immunoassays on a microarray
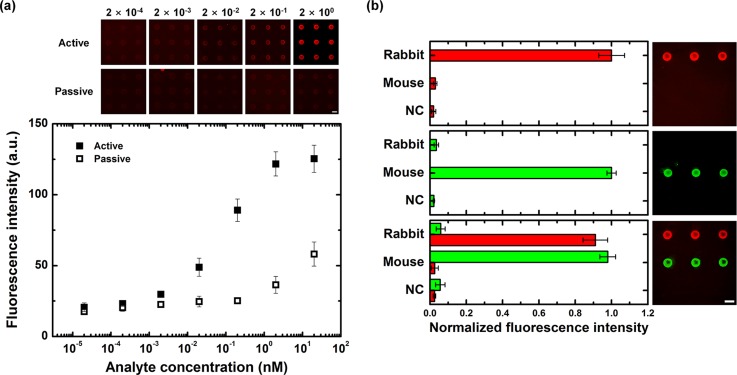
To investigate the effect of the proposed optoelectrofluidic system to detect target analytes on microarray formats, heterogeneous immunoassays using antibodies and quantum dot-conjugated analytes were conducted under the passive and active modes. Different concentrations of analytes from 20 fM to 20 nM were loaded on the microarray-integrated optoelectrofluidic immunoassay system. Immunoassay results were quantitatively analyzed by measuring the fluorescence signal of assay spots on the microarray after the incubation under the both modes (Figure 5(a)). The experimental results showed that the fluorescence intensity increased as the concentration of target molecules increased in both cases. However, the fluorescence intensities under the active mode were notably larger compared to the passive mode. This significant improvement was considered to be mainly caused by the difference of mass transport phenomena under two cases. In other words, target analytes could be actively transported to the assay spots on the microarray by optically induced ACEO flows, resulting in improved binding efficiency. Thanks to the optoelectrofluidic method, distinct differences between the active and passive modes were shown at the analyte concentrations above 2 pM. The four parameter logistic (4PL) regression model was used to analyze the optoelectrofluidic immunoassay results, resulting in a good correlation with a determination coefficient (R2) of 0.9968. The limit of detection was determined by the analyte concentration for which the fluorescence intensity exceeds the baseline noise by a factor of 3 (0.05 ± 1.18). From the results, the detection limit was 20 fM and fluorescence signals of immunoassays were saturated above 2 nM. Based on these results, the proposed system could be effectively employed to detect and measure the concentration of target analytes due to the active mass transport rather than the diffusion-limited environment. Furthermore, to investigate an applicability of the microarray-integrated optoelectrofluidic system on multiple protein detection, a reverse phase immunoassay format was applied (Figure 5(b)). The reverse phase immunoassays have been widely utilized in microarray-based qualitative biological study such as drug screening,27 protein–protein interaction,28 and biomarker discovery.29 In these experiments, three types of proteins, including a rabbit IgG, a mouse IgG, and a BSA protein as a negative control (NC), were immobilized line by line on a surface-treated ITO-coated glass slide. After blocking the microarray to reduce nonspecific binding, the quantum dot-conjugated antibodies for immobilized IgGs were loaded on the system for optoelectrofluidic immunoreaction. The red and green fluorescence signals represented the bindings of anti-rabbit IgG and anti-mouse IgG at the assay spots on the microarray, respectively. When a type of antibody was loaded, the fluorescence signal was observed only in a specific line, while both lines showed specific fluorescence signals when a mixture of both antibodies was loaded. As a result, the positive signals for target proteins with their distinct colors could be provided with limited cross-talk signal under the optoelectrofluidic method, which implies that the proposed system could be utilized for multiple protein detection in biological assay fields.
FIG. 5.
Demonstration of immunoassays using a microarray-integrated optoelectrofluidic system. (a) Fluorescence results of heterogeneous immunoassay with respect to an optoelectrofluidic manner under an applied AC voltage of 15 Vpp at 10 kHz (scale bar: 200 μm, n = 9). (b) Fluorescence results of reverse phase immunoassays with three cases, including only anti-rabbit IgG loading, only anti-mouse IgG loading, and a mixture of anti-rabbit IgG and anti-mouse IgG loading. The concentration of each antibody was 20 nM (scale bar: 200 μm, n = 3).
CONCLUSION
In this study, we have presented a novel approach to conduct microarray-based immunoassays based on an optoelectrofluidic technology. The effect of optically induced convective flows to improve the reaction efficiency between target molecules and receptors immobilized on a conventional glass slide-based microarray format was investigated by simulation studies and experiments using IgGs and anti-IgGs as a model set for immunoassays. The enhancing effect was successfully occurred on multiple assay spots of the microarray by overcoming the diffusion limitation, which was simultaneously controlled via an optical method, resulting in the reduction of reaction time from more than 30 min to 10 min. Based on this enhancing effect, a heterogeneous immunoassay under the optoelectrofluidic environment was conducted, which showed rapid signal saturation compared to the static mode where the mass transport depended on only molecular diffusion. Furthermore, simultaneous detection of multiple proteins using different IgGs was demonstrated that multiplex immunoassays could be performed on the microarray-integrated optoelectrofluidic immunoassay system. In conclusion, our proposed assay system provided high compatibility with conventional glass-based microarray formats thanks to the optical method for active mass transport, resulting in improved reaction efficiency with minimal sample consumption (5 μl). Based on these technological attractions, the proposed optoelectrofluidic immunoassay system is considered as one of the potential candidates to develop optically controlled micro total analysis systems (μTAS) for biological fields such as protein expression study and diagnostics by integrating various versatile manipulation methods for cells,30 biomolecules,31 and micro- and nano-sized particles32 of optoelectrofluidic technologies.
ACKNOWLEDGMENTS
This research was supported by a National Leading Research Laboratory Program (Grant No. NRF-2013R1A2A1A05006378), a Bio & Medical Technology Development Program (Grant NRF-2015M3A9B3028685), and a Converging Research Center Program (Grant 2011K000864) through the National Research Foundation of Korea funded by the Ministry of Science, ICT and Future Planning. The authors also acknowledge a KAIST Systems Healthcare Program.
References
- 1. Situma C., Hashimoto M., and Soper S. A., Biomol. Eng. 23, 213 (2006). 10.1016/j.bioeng.2006.03.002 [DOI] [PubMed] [Google Scholar]
- 2. Zhang Y., Coyne M. Y., Will S. G., Levenson C. H., and Kawasaki E. S., Nucl. Acids Res. 19, 3929 (1991). 10.1093/nar/19.14.3929 [DOI] [PMC free article] [PubMed] [Google Scholar]
- 3. MacBeath G. and Schreiber S. L., Science 289, 1760 (2000). 10.1126/science.289.5485.1760 [DOI] [PubMed] [Google Scholar]
- 4. Büssow K., Nordhoff E., Lübbert C., Lehrach H., and Walter G., Genomics 65, 1 (2000). 10.1006/geno.2000.6141 [DOI] [PubMed] [Google Scholar]
- 5. Silzel J. W., Cercek B., Dodson C., Tsay T., and Obremski R. J., Clin. Chem. 44, 2036 (1998). [PubMed] [Google Scholar]
- 6. Kang H., Park B.-R., Yoo H.-S., Kwon K.-R., and Kang I.-C., BioChip J. 9, 222 (2015). 10.1007/s13206-015-9308-6 [DOI] [Google Scholar]
- 7. Ekins R. P. and Chu F., Clin. Chem. 37, 1955 (1991). [PubMed] [Google Scholar]
- 8. Kusnezow W., Syagailo Y. V., Rüffer S., Baudenstiel N., Gauer C., Hoheisel J. D., Wild D., and Goychuk I., Mol. Cell. Proteomics 5, 1681 (2006). 10.1074/mcp.T500035-MCP200 [DOI] [PubMed] [Google Scholar]
- 9. Lynn N. S., Martínez-López J.-I., Bocková M., Adam P., Coello V., Siller H. R., and Homola J., Biosens. Bioelectron. 54, 506 (2014). 10.1016/j.bios.2013.11.027 [DOI] [PubMed] [Google Scholar]
- 10. Rupp J., Schmidt M., Münch S., Cavalar M., Steller U., Steigert J., Stumber M., Dorrer C., Rothacher P., and Zengerle R., Lab Chip 12, 1384 (2012). 10.1039/c2lc21110f [DOI] [PubMed] [Google Scholar]
- 11. Han C. M., Katilius E., and Santiago J. G., Lab Chip 14, 2958 (2014). 10.1039/C4LC00374H [DOI] [PubMed] [Google Scholar]
- 12. Wu J., Ben Y., and Chang H.-C., Microfluid. Nanofluid. 1, 161 (2005). 10.1007/s10404-004-0024-5 [DOI] [Google Scholar]
- 13. Wu J., Ben Y., Battigelli D., and Chang H.-C., Ind. Eng. Chem. Res. 44, 2815 (2005). 10.1021/ie049417u [DOI] [Google Scholar]
- 14. Sigurdson M., Wang D., and Meinhart C. D., Lab Chip 5, 1366 (2005). 10.1039/b508224b [DOI] [PubMed] [Google Scholar]
- 15. Feldman H. C., Sigurdson M., and Meinhart C. D., Lab Chip 7, 1553 (2007). 10.1039/b706745c [DOI] [PubMed] [Google Scholar]
- 16. Chiou P.-Y., Ohta A. T., Jamshidi A., Hsu H.-Y., and Wu M. C., J. Microelectromech. Syst. 17, 525 (2008). 10.1109/JMEMS.2008.916342 [DOI] [PMC free article] [PubMed] [Google Scholar]
- 17. Kim D., Shim J., Chuang H.-S., and Kim K. C., Biomicrofluidics 9, 034102 (2015). 10.1063/1.4921232 [DOI] [PMC free article] [PubMed] [Google Scholar]
- 18. Wang J.-C., Ku H.-Y., Shieh D.-B., and Chuang H.-S., Biomicrofluidics 10, 014113 (2016). 10.1063/1.4940938 [DOI] [PMC free article] [PubMed] [Google Scholar]
- 19. Han D. and Park J.-K., Lab Chip 16, 1189 (2016). 10.1039/C6LC00110F [DOI] [PubMed] [Google Scholar]
- 20. Hwang H., Choi Y. J., Choi W., Kim S. H., Jang J., and Park J. K., Electrophoresis 29, 1203 (2008). 10.1002/elps.200700415 [DOI] [PubMed] [Google Scholar]
- 21. Ramos A., Morgan H., Green N. G., and Castellanos A., J. Colloid. Interf. Sci. 217, 420 (1999). 10.1006/jcis.1999.6346 [DOI] [PubMed] [Google Scholar]
- 22. Valley J. K., Jamshidi A., Ohta A. T., Hsu H.-Y., and Wu M. C., J. Microelectromech. Syst. 17, 342 (2008). 10.1109/JMEMS.2008.916335 [DOI] [PMC free article] [PubMed] [Google Scholar]
- 23. Hofmann O., Voirin G., Niedermann P., and Manz A., Anal. Chem. 74, 5243 (2002). 10.1021/ac025777k [DOI] [PubMed] [Google Scholar]
- 24. Huang K.-R., Chang J.-S., Chao S. D., Wu K.-C., Yang C.-K., Lai C.-Y., and Chen S.-H., J. Appl. Phys. 104, 064702 (2008). 10.1063/1.2981195 [DOI] [Google Scholar]
- 25. Sadana A. and Sii D., J. Colloid. Interf. Sci. 151, 166 (1992). 10.1016/0021-9797(92)90248-K [DOI] [Google Scholar]
- 26.See supplemental material at http://dx.doi.org/10.1063/1.4950787E-BIOMGB-10-007603 for a detailed description of the dynamic light pattern.
- 27. Havaleshko D. M., Smith S. C., Cho H., Cheon S., Owens C. R., Lee J. K., Liotta L. A., Espina V., Wulfkuhle J. D., and Petricoin E. F., Neoplasia 11, 1185 (2009). 10.1593/neo.09898 [DOI] [PMC free article] [PubMed] [Google Scholar]
- 28. Sahin Ö., Löbke C., Korf U., Appelhans H., Sültmann H., Poustka A., Wiemann S., and Arlt D., Proc. Natl. Acad. Sci. U.S.A. 104, 6579 (2007). 10.1073/pnas.0606827104 [DOI] [PMC free article] [PubMed] [Google Scholar]
- 29. VanMeter A. J., Rodriguez A. S., Bowman E. D., Jen J., Harris C. C., Deng J., Calvert V. S., Silvestri A., Fredolini C., and Chandhoke V., Mol. Cell. Proteomics 7, 1902 (2008). 10.1074/mcp.M800204-MCP200 [DOI] [PMC free article] [PubMed] [Google Scholar]
- 30. Liu N., Liang W., Liu L., Wang Y., Mai J. D., Lee G.-B., and Li W. J., Lab Chip 14, 1367 (2014). 10.1039/c3lc51247a [DOI] [PubMed] [Google Scholar]
- 31. Hwang H. and Park J. K., Anal. Chem. 81, 5865 (2009). 10.1021/ac901047v [DOI] [PubMed] [Google Scholar]
- 32. Hwang H. and Park J. K., Lab Chip 9, 199 (2009). 10.1039/B811740C [DOI] [PubMed] [Google Scholar]
Associated Data
This section collects any data citations, data availability statements, or supplementary materials included in this article.
Data Citations
- See supplemental material at http://dx.doi.org/10.1063/1.4950787E-BIOMGB-10-007603 for a detailed description of the dynamic light pattern.


