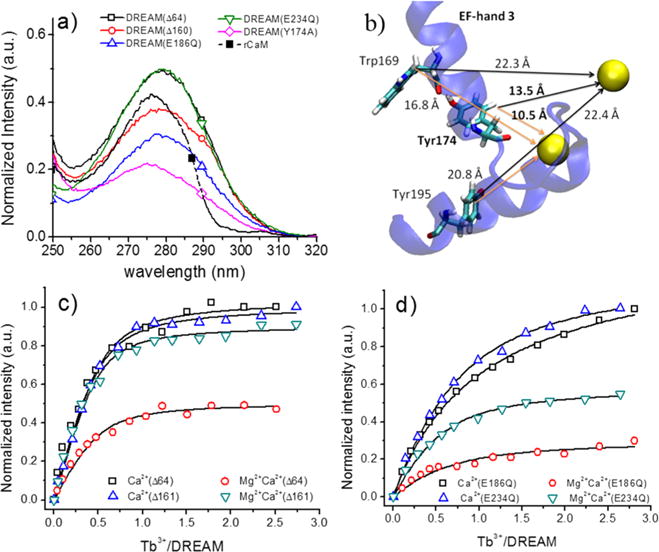
Figure 3.

(a) Excitation spectra of DREAM constructs bound to Tb3+ (20 μM protein with 40 μM Tb3+). The spectra were normalized so that the intensity corresponding to backbone to Tb3+ energy transfer at 240 nm is the same for DREAM(Δ64), DREAM(Δ160), and DREAM(Y174A) while the magnitude is half for DREAM(E186Q) and DREAM(E234Q). (b) Calcium/terbium binding sites of EF-hands 3 and 4. Only EF-hand 3 is shown (blue) for the sake of clarity. (c) Titrations of Tb3+ into DREAM(Δ64) and DREAM(Δ160) in 20 mM TRIS (pH 7.4) and 100 μM Ca2+ with and without 5 mM Mg2+. (d) Titration of Tb3+ into DREAM(E186Q) and DREAM(E234Q) under the conditions described for panel c. Solid lines represent the best fit using the quadratic equation for N binding sites.
