Abstract
Properly regulated angiogenesis and arteriogenesis are essential for effective wound healing. Tissue injury induces robust new vessel formation and subsequent vessel maturation, which involves vessel regression and remodeling. Although formation of functional vasculature is essential for healing, alterations in vascular structure over the time course of skin wound healing are not well understood. Here, using high-resolution ex vivo X-ray micro-computed tomography (microCT), we describe the vascular network during healing of skin excisional wounds with highly detailed three-dimensional (3D) reconstructed images and associated quantitative analysis. We found that relative vessel volume, surface area and branching number are significantly decreased in wounds from day 7 to day 14 and 21. Segmentation and skeletonization analysis of selected branches from high-resolution images as small as 2.5 μm voxel size show that branching orders are decreased in the wound vessels during healing. In histological analysis, we found that the contrast agent fills mainly arterioles, but not small capillaries nor large veins. In summary, high-resolution microCT revealed dynamic alterations of vessel structures during wound healing. This technique may be useful as a key tool in the study of the formation and regression of wound vessels.
Keywords: angiogenesis, wound healing, micro-computed tomography, three-dimensional, angiography
Introduction
Angiogenesis and arteriogenesis are processes of blood vessel formation that are required for healing and/or regeneration of damaged tissue. Inadequate or dysregulated angiogenesis and/or arteriogenesis contributes to non-healing wounds and poor tissue regeneration, which are often seen in chronic metabolic conditions such as diabetes (1, 2). Excessive or prolonged angiogenesis during healing often results in tissue scar formation, resulting in keloids and peritoneal adhesions (3). Thus, neovascularization in wounds is tightly regulated to ensure proper healing in a multitude of tissue types.
After tissue injury in a normal host, the deficit in oxygen supply and the initial inflammatory response induce an exuberant angiogenic response, resulting in robust endothelial cell proliferation, cell migration and nascent vessel formation including capillaries--a process known as angiogenesis (4). Arteriogenesis, in parallel, is a process that involves the remodeling of pre-existing arterio-arteriolar anastomoses into established and developed arteries (5). The growing phase of these processes involves pericyte coverage and, importantly, removal of selected vascular branches (4) --also known as vascular pruning (6). In normal tissue, the diameter of capillaries or arterioles is 3–10 μm or 10–50 μm, respectively (7, 8). In cutaneous wound healing in healthy mice, we previously demonstrated significant regression of wound vasculature following robust angiogenesis in the early phase (9). Others showed that many small vessels formed in early healing wounds are not well perfused (10). These data indicate that the formation and regression of vascular structures during wound healing is a dynamic process that involves changes in vessel number, branching number, morphological structure and functionality (11). However, understanding of this process has been limited due to reliance on histological analysis and the typical associated small microscopic field of view that can lead to sampling variability and potential bias.
Recent studies demonstrated that detailed microstructure of blood vessels can be obtained with X-ray micro-computed tomography (microCT). For example, highly detailed anatomical information obtained at high-resolution by ex vivo microCT has been used to quantitatively analyze the three-dimensional (3D) micromorphology of tumor blood vessels (12) (13). However, a review of the literature revealed no high-resolution ex vivo microCT studies that investigated the dynamic regulation of wound vessels over time.
In the present study, we utilized ex vivo microCT as small as 2.5 μm scanning voxel size to visualize wound vessel formation and remodeling over time after skin excisional wounding. Using systemic perfusion of bismuth-gelatin contrast media, we investigated functionally connected vessel structure in normally healing wounds. Three-dimensional reconstruction of vessel architecture from microCT images revealed dynamic changes in perfused vessels from early to late wound healing with a large field of view, which allows analysis of vessel formation, regression and remodeling during wound healing. Importantly, we performed three-dimensional reconstruction and analysis using a computer typically available in a biology laboratory to date. Thus, microCT analysis may prove to be a powerful tool for future wound vessel research as well as studies to test pro- or anti-angiogenesis strategies.
Materials and Methods
Mice
Fifteen C57Bl/6J male mice at the age of between 12 to 16 weeks were used for all experiments. For diet-induced obese (DIO) mice, male C57Bl/6 mice were fed a high fat diet (60 kcal% fat diet, D12492 from Research Diets, Inc) for 18 weeks beginning at 5-weeks of age. For surgical procedures, mice were anesthetized with isoflurane. Perioperative analgesia was achieved with subcutaneous injection of 0.1 mg/kg body weight of buprenorphine. All procedures involving animals were approved by The Animal Care Committee at the University of Illinois at Chicago and conducted in accordance with institutional guidelines.
Skin wound model
Two 8 mm diameter full thickness excisional skin wounds were made on the back of each mouse with a dermal biopsy punch under anesthesia and analgesia. To determine the wound biopsy location, we drew a centerline on the back of each mouse along its spine and folded the skin along the centerline. Two wounds were made in the folded skin such that the wounds were at least once centimeter apart. The wounds were placed near the midpoint between the neck and base of the tail avoiding skin regions with dense hair. The wounds were covered with Tegaderm (3M) to keep the wounds moist until day 7 after wounding; Tegaderm also helped to maintain a circular wound shape. To analyze wound closure, hair was shaved on day 7, 14 or 21 if necessary. At indicated time points, mice were euthanized by isoflurane asphyxiation and bilateral thoracotomy, and immediately followed by the systemic perfusion procedure described below.
Systemic vascular perfusion with X-ray contrast media
Bismuth-gelatin contrast medium was prepared as previously described (14). Bismuth nanoparticle solution (Yale Translational Research Imaging Center) was diluted with saline and mixed with 10% gelatin (Sigma-Aldrich) solution (volume ratio 2:3:5). The 20% Bismuth in 5% gelatin as well as the following perfusion solutions were kept at 38°C. Mice deeply anesthetized with isoflurane inhalation were euthanized by opening the chest cavity. While the heart was still beating, mice with a beating heart were first perfused with 0.9% saline containing 0.1% (w/v) adenosine (Sigma-Aldrich) and 0.4% (w v) papaverin hydrochloride (Sigma-Aldrich) through the ascending aorta with a cannulated 18 G Surflo IV catheter (Thermo) under physiological pressure for 3 minutes to ensure vasodilation, while simultaneously nicking the right atrium. The heart stopped beating during above perfusion, and the dilated vasculature was immediately fixed by perfusing with 20 ml of 2% paraformaldehyde solution. Finally, 1 ml per 30g body weight of the bismuth-gelatin contrast media was perfused at a speed 1 ml/min until the media reached the right atrium of the heart. The whole body of the perfused animals was immediately dipped in ice water to solidify the media. The skin of the dorsum containing the wounded area was then carefully resected from subdermal structures with a scalpel and scissors. The harvested skin was trimmed using an 8 mm diameter dermal biopsy punch with the wound lesion located at the center of the harvested tissue.
MicroCT scanning
Samples were scanned with μCT50 (Scanco USA) at the MicroCT Core Laboratory at Rush University. Column sample holders of 9 mm diameter were used to accommodate up to 4 specimens. Each specimen was aligned horizontally and separated by soft sponges. The holders were placed vertically on the turntable of the microCT system. The following settings were used: 70 kV X-ray tube voltage, 114 μA X-ray tube current, 10.5 mm field of view, 2.7 mm total thickness, 2.5 μm voxel size, 1112 slices and 55.1 minutes scan time.
Image processing and resampling
Acquired images were converted to DICOM format and processed by DICOM viewer software, OsiriX 64-bit or MD (Pixmeo). For 3D rendering and segmentation of a selected branch, slice images were resampled by 50% (which maintains a 5-μm spatial resolution) to reduce image processing time and because of the large file size of the data (21.8 GB). This was done using a plugin “resample data” in Image Filters. The resized images were exported and saved as a new image stack. For 3D analysis of entire wound specimens only, we applied 10% resampling (25-μm voxel resolution). After resampling data, each file was exported as a separate file. To eliminate background noise, we set the pixel value in ROI menu to lower than 3000 to −1000. Files that were about 120 MB in stacked TIFF format were used for 3D analysis of entire wound lesion.
Three-dimensional reconstruction and segmentation
We used the 3D maximum intensity projection (3D MIP) program in OsiriX software to display 3D rendering of the vasculature. To perform 3D-based blood vessel segmentation, we chose selected blood vessels based on 3D projection of entire wounds. The following selection criteria were used: a main supplying artery that typically runs from the periphery to the center of wounds can be identified; a branch structure of a vessel tree can be selected by the automatic ROI selection program; and ROI selection applied up to several times can visualize reasonable vessel tree structure compared to that in the entire 3D rendered image. Based on our preliminary ROI selection for the segmentation, we used a confidence algorithm with multiplier=1.5, number of iteration=0 and initial radius=2. If necessary, multiple ROIs were merged using “Merge with existing Brush ROIs”. Next, we saved the image stack that contained the segmented vessels in DICOM file format. We repeated the segmentation for at least 3 vessel tree structures per wound. Successful segmentation was verified by comparing to the target vessels in the entire 3D projection.
Three-dimensional analysis
The 3D reconstruction analysis from compiled 2D stacks was performed using Fiji software (15), an image processing package based on ImageJ. To calculate volume and surface area of the entire vessel structure of wound, we used the 3D object counter plugin on uploaded 2D compiled image stacks converted to binary images. To calculate branch numbers, total length and Euclidean distance, we used the skeletonize3D plugin. Euclidean distance divided by the length of the branch was used as an index of tortuosity of the branch.
Histological Analysis
Wounds were mounted in tissue freezing medium and frozen in isopentane chilled with liquid nitrogen for histological analysis. Ten-μm cryosections taken from the center of the wound (found by serial sectioning through the entire wound) were stained with either Masson’s Trichrome via manufacturer’s instructions (IMEB) or CD31 via immunohistochemistry. For immunohistochemical staining, sections were air-dried, washed with PBS, quenched with 0.3% hydrogen peroxide, and washed with PBS. Sections were blocked with buffer containing 3% bovine serum albumin and then incubated with anti-CD31 antibody to label endothelial cells (1:100, BD Pharmingen). Sections were then washed with PBS and incubated with biotinylated anti-rat secondary antibody (1:200, Vector Laboratories). After washing with PBS, sections were incubated with avidin D-horseradish peroxidase (1:1000, Vector Laboratories) and developed with ImmPACT™ DAB Substrate Kit (Vector Laboratories). Histological analysis of trichrome-stained cryosections was performed on three to four representative images at ×40 magnification per wound. For each field, the diameter of the smallest filled artery size was measured, and data were averaged over sections to provide a representative value across all wounds. CD31-stained cryosections were taken at ×20 magnification per wound. All digital images were obtained using a Nikon Instruments 80i microscope with a DS-QI1 digital camera and analyzed using NIS Elements image analysis software (Nikon).
Statistical analysis
Data are expressed as mean±SEM. GraphPad Prism 6 was used for statistical analysis. One-way ANOVA with Tukey’s multiple comparisons test or two-way ANOVA were used for all statistical comparisons except for the tortuosity analysis in the supplemental figure, in which the distribution of two groups was compared by Kolmogorov-Smirnov test. P<0.05 was considered to be statistically significant.
Results
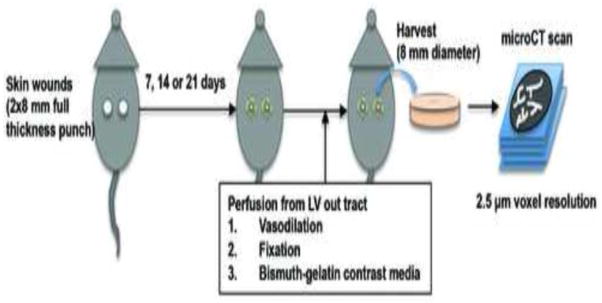
We analyzed alterations in vascular structures during wound healing in our established circular excisional wound model using novel microCT angiography and 3D reconstruction techniques. We optimized methods for contrast agent perfusion, tissue sampling, microCT scanning, image processing and analysis of 3D reconstructions to visualize and quantify the wound vascular network while minimizing background noise (Figure 1). This protocol allowed us to assess vascular structures within a large area (8 mm diameter field of view) as well as narrow vessels (capillaries) in our image data sets.
Figure 1.
Schematic overview of study protocol for micro-computed tomography (microCT) of wound vascular structure during mouse skin wound healing. C57Bl/6 mice were subjected to two 8 mm full-thickness wounds on the dorsal skin. At the indicated times, mice received systemic perfusion of vasodilation solution, fixative and bismuth-gelatin X-ray contrast media through the left ventricle (LV) out tract of the heart. Wound specimens were harvested as 8 mm diameter skin samples, and were scanned by X-ray microCT with very high-resolution (2.5 μm voxel size) setting.
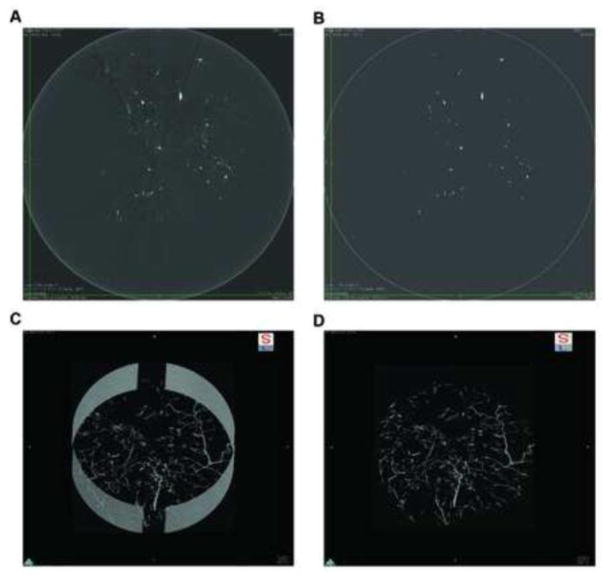
To visualize wound vessel architecture, we performed postmortem systemic perfusion from the outflow tract of the left ventricle of the heart through a tightly inserted catheter. Before contrast media perfusion, we fixed vessels in a dilated condition. The viscosity of the contrast media is lower than that of Microfil, another well-established contrast media, which allowed us to perfuse the vessels under near physiological blood pressure even though the vessels were fixed. By gross examination, we did not find any leakage of the bismuth-gelatin contrast media from the circulation into the surrounding tissue in the normal mice, indicating that our method accurately marks vessel structures and high-resolution microCT images showed vascular-like structures of variable sizes with excellent signal to noise ratio (Figure 2A).
Figure 2.
Image processing of micro-computed tomography (microCT) images for three-dimensional (3D) rendering and analysis. A, a representative image slice of the wound specimen scanned by microCT with high-resolution, visualized by DICOM viewer, OsiriX. B, a resampled image of the same cross section from A with empirically determined threshold to eliminate background X-ray absorbance. C, 3D reconstructed image using maximum image projection program on OsiriX (5 μm voxel size). D, the same 3D image as C trimmed to eliminate artifacts from the specimen holder (9 mm diameter).
Our goal was to analyze the image data on computers that are typically available in a biological laboratory. We found that the entire image stack from each wound specimen was as large as 21 GB. As DICOM is an image format widely used in medical imaging modalities in the clinical setting, we chose OsiriX, one of the most widely used DICOM viewers, for further image processing. For 3D construction of vessel network in entire wound lesion using the maximum intensity projection, we found that resampling by 50% reduction of voxel size helped to reduce image processing time. Of note, we used those image stacks in 3D image projections and in the following vessel tree analysis. Together with the resampling, we performed thresholding to distinguish signals of the contrast media from background noise. Because of the excellent signal-to-noise ratio, it was easy to find a setting to generate binary images. We could apply the fixed value to specimens without losing pixels from the vessel structure, which was verified by careful comparison of processed to raw images (Figure 2B). Because our skin samples do not contain tissues that have similar X-ray attenuation values such as bone or calcified tissue, our thresholding allowed for an accurate selection of the voxels containing the contrast media without interference. The only exception included artificial signals from the stainless steel specimen holder that is visualized outside of the vasculature without interference from signals that have similar X-ray attenuation values. Maximum intensity projection is a volume rendering technique for 3D images that projects those voxels in a visualization plane with maximum intensity that fall within parallel rays traced from the viewpoint to the plane of projection. We used this for display of reconstructed 3D images (Figure 2C) and eliminated artificial signals from the specimen holder by a scissor tool to complete 3D constructed wound vessel visualization (Figure 2D). All the quantitative analysis was performed on 3D volume data using Fiji (ImageJ) software, which is an open source software with plugin programs that are widely available.
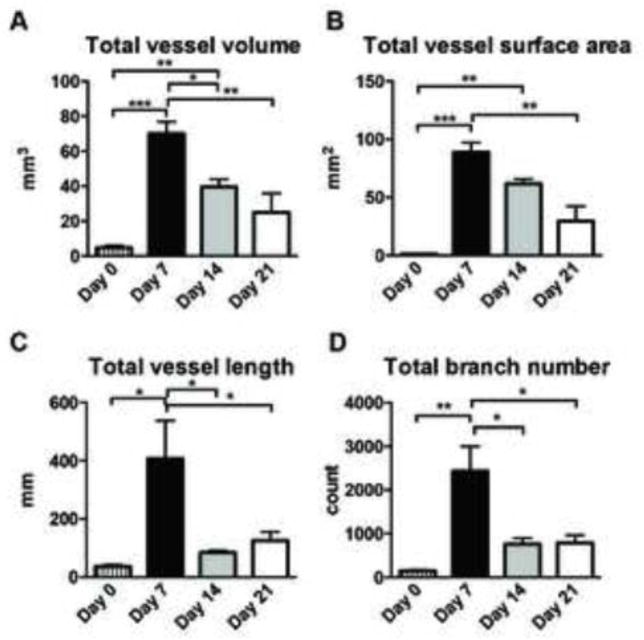
We successfully created 3D reconstructions of wound vasculature from wound specimens collected on days 7, 14 and 21 post-wounding (Figure 3A–C, Supplemental Movie S1 and S2). We also analyzed unoperated intact skin collected in the same manner (Figure 3H). The closure of these wounds was consistent with what we have demonstrated in previous publications (16, 17) (Figure 3D–F). Gross visual observation of those images revealed that large vessels enter the periphery of the wound and run toward the wound center with sprouting of many smaller branches of tree-like structures. Many of these small branches appear to terminate near the wound edge, which results in very dense capillary formation in that area. In addition, formation of perfused vessels was heterogeneous around the wound (Figure 3G). To analyze the entire wound vasculature within 8 mm diameter and 2.7 mm thickness volume, we resampled the entire 3D images to 10% of the original scanned images, maintaining a 25-μm voxel size. Using this condition, our data revealed that vessel volume, vessel surface area, total vessel length and branch number was significantly increased on day 7 compared to unoperated skin, and reduced on day 14 and/or 21 compared to day 7 (Figure 4A–D).
Figure 3.
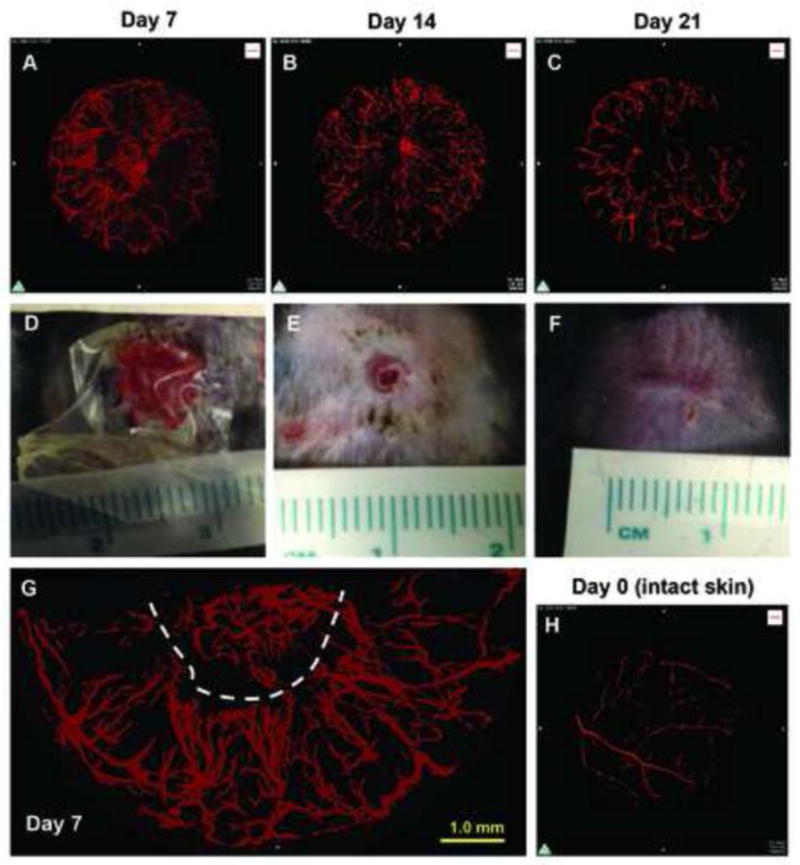
Three-dimensional reconstruction of the vascular network in healing wounds of mouse dorsal skin by micro-computed tomography (microCT) angiography in C57Bl/6 mice. A–C, representative images of 3D reconstructions of wound vasculature at indicated time points as acquired by X-ray microCT at 2.5-μm voxel resolution followed by post scan processing and 3D reconstruction. D–F, photos of one of two dorsal skin wounds at indicated time points after introduction of 8 mm excisional wounds. G, representative magnified 2D projection of 3D image from day 7 (the same sample as A). Dotted line indicates estimated wound edge. H, 3D reconstructions of vasculature on day 0 or of intact skin.
Figure 4.
Three-dimensional analysis of vasculature structures of skin wounds obtained by microCT angiography. To handle data from a wound volume (8 mm diameter and around 2.7 mm thickness), image files were resampled by 10% on OsiriX, resulting in reduced image resolution to 25-μm voxel. This newly created image file was loaded to Fiji (ImageJ) software and was analyzed by the 3D object counter and the Skeletonize3D/AnalyzeSkeleton plugin programs. A, total vessel volume, B, total vessel surface area, C, total vessel length and D, total branch number per effective wound volume, which was measured by total scanned volume subtracted by avascular volume (n=3, n=6, n=3 and n=3 on day 0, 7, 14 and 21, respectively). Statistics was performed by two-way ANOVA with Tukey’s multiple comparison test (*p<0.05, **p<0.01 and ***p<0.001). Data are shown as mean±SEM.
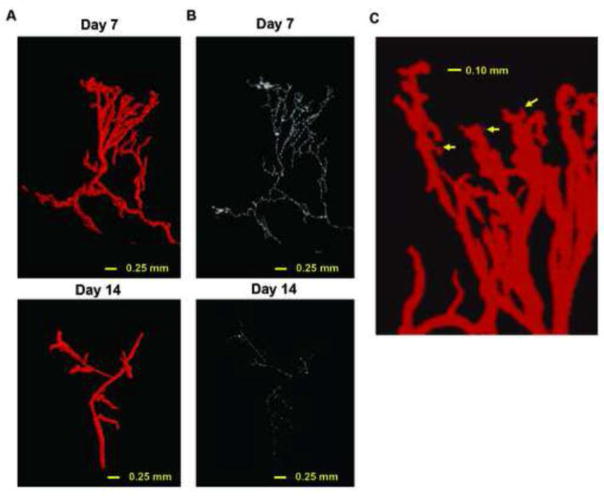
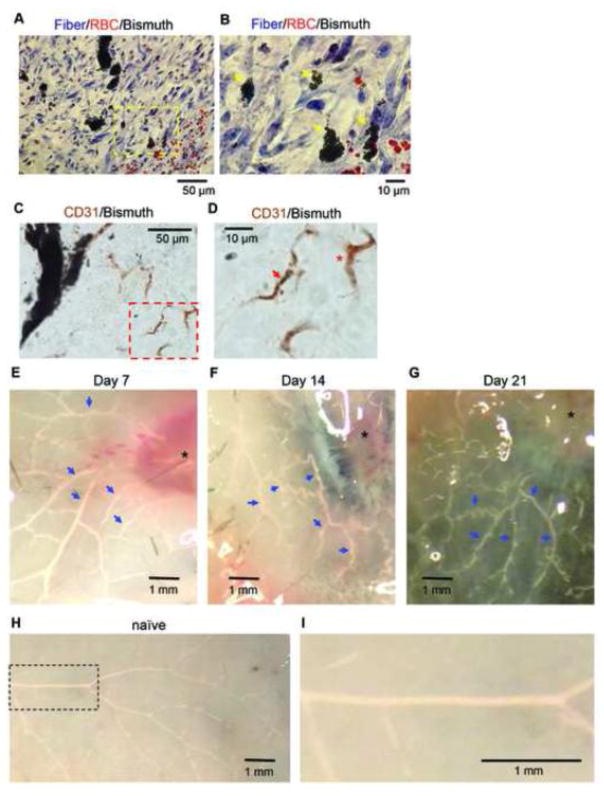
We next performed segmentation analysis on selected vessel tree structures in healing wounds by resizing the raw images to 50%, which maintained 5 μm isotropic voxels. Using this approach, we performed ROI segmentation using an algorithm implemented on OsiriX program and generated a 3D reconstruction of the wound vasculature and its skeleton (Figure 5A and B). Note that a skeleton represents the centerline of each branch in the vessel tree. The zoom-in image of a vascular tree from the day 7 sample shows the branching of small vessels as small as 10 μm diameter (arrows in Figure 5C). However, these small vessels end within 0.1 mm of their origin, suggesting that the contrast agent was not perfused in the capillary system. In addition, we performed histological analysis of the wound samples with the contrast perfusion. Masson’s Trichrome staining displayed contrast media filled vascular structures (shown in black) in collagen-rich wounds (blue) together with red blood cells that are a good indicator for scale. The high power field images of sections on day 7 with this staining revealed that the smallest vessels filled with the contrast agent are 7.3±3.4 SD μm (total 19 high power field images, n=3) in diameter (Figure 6A and 6B). We also found that a certain amount of CD31-stained endothelial cells are not associated with the contrast media (Figure 6C and 6D), confirming inefficient contrast perfusion or retention in capillaries. By gross observation, no veins could be visualized in the lesion five millimeters distant from the wounds at all time points examined (Figure 6E, 6F and 6G). In addition, corresponding veins in naïve mice were not perfused with the contrast agent using the same technique (Figure 6H and 6I). These results indicate that our microCT angiography visualizes mainly arterioles, but not large veins nor capillaries. Small arterioles less than 10 μm in diameter can be observed a short distance from their branching points.
Figure 5.
Segmentation of vessel branches and very high-resolution three-dimensional analysis of vasculature structures of skin wounds obtained by microCT angiography. A, representative 3D segmented branch from wound vessels on day 7 (upper) and 14 (lower). B, skeletonized 3D branch from the segmented branch shown in A on day 7 (upper) and 14 (lower). C, zoom-in snapshot of maximum intensity projection image of wound edge lesion on day 7 (the same sample as A but from different angle of view). Arrows indicate small arteriole-like branches.
Figure 6.
A, a representative histologic image from day 7 with Masson Trichrome staining (40x objective, from n=3 mice perfused with the contrast agent). B, magnified image of yellow-dotted rectangle area in (A). Black small particle accumulations are the bismuth-gelatin contrast (yellow arrows). Red staining particles are red blood cells. C, a representative histologic image from day 7 demonstrating immunostaining for CD31, an endothelial cell marker (40x objective, from n=4 mice perfused with the contrast agent). D, magnified image of red-dotted rectangle area in (C) shows CD31 positive capillary-like structure with bismuth particles (red arrow) and without the particles (asterisk). E–H, photo snapshots of harvested skin after the contrast perfusion at indicated time points. Vessels filled with the contrast agent are seen as white (blue arrows). Asterisks indicate wounds. I, a magnified image of a dotted rectangle in (G).
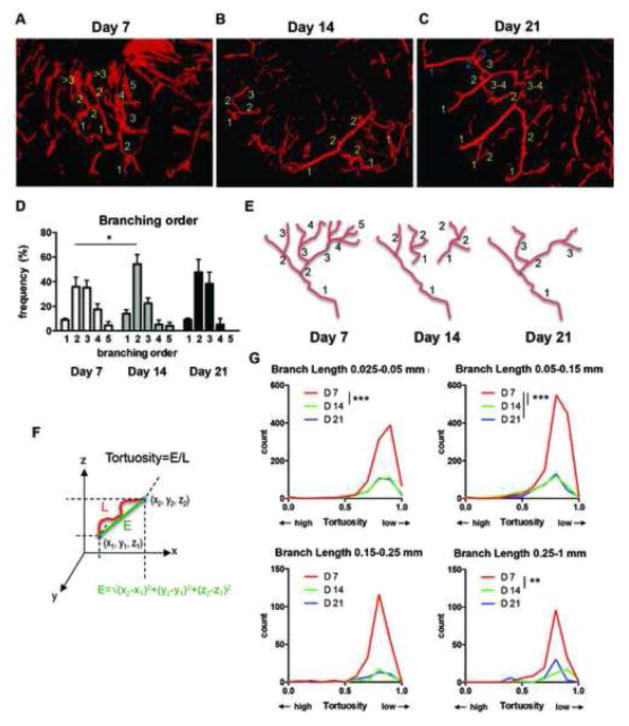
Analysis of these segmented vessel trees was conducted on ImageJ program followed by manual counting for branching order. To this end, we first identified a feeding vessel in the 3D image stack, which was defined as the vessel that originates from the perimeter lesion or from the bottom of the wounds that has the largest diameter. We then assigned a “branching order” to vascular segments between one branching point to another based on how many branching points the segments passed. Branching order was decreased from day 7 to day 14, while we did not see a significant difference between day 7 and day 21 (Figure 7A–D). With reduction of total branch number from day 7 to day 14 (Figure 4D), we found many small vascular segments that have lower branch orders on day 14 (Figure 7B). On day 21 vascular segments appeared to be more highly connected than those on day 14, resulting in increased branching order on day 21 (Figure 7C). These results revealed dynamic remodeling of vascular structure over time during wound healing, which involve reduced branching and connection of vascular segments (Figure 7E).
Figure 7.
A–C, representative 3D reconstruction of skin vascular structures by microCT angiography at indicated time point after wounding. The numbers of each different color represent examples of branching orders counted manually on 3D skeletonized branches. D, results from 252, 144 and 48 total segmented branches from day 7, 14 and 21 specimens, respectively. Statistics was made by two-way ANOVA with Tukey’s multiple comparisons test (*P<0.05). E, a model of alteration of the branching order over time during wound healing (see text). F, schematic presentation of Euclidean distance (E) and tortuosity=E/L. L indicates length of a vessel segment. G, vessel tortuosity of each branch was defined by Euclidean distance/length of each skeletonized branch (2085, 1514 and 345 total segmented branches from day 7, 14 and 21 specimens, respectively). Distribution of number of vessel with particular tortuosity in 8 mm diameter volume of wounds was calculated based on skeletonized branch length distribution (see Supplemental Figure) and total vessel number obtained in Figure 4D. Statistics were made by nonparametric Kruskal-Wallis test with Dunn’s multiple comparisons test (**P<0.01, ***P<0.001). Data are shown as mean±SEM.
Next we examined tortuosity of segmented vessels empirically defined by Euclidian distance/branch length, both of which were provided by the AnalyzeSkeleton plugin (18). By definition of the Euclidian distance, distance between two points defined as the square root of the sum of the squares of the differences between the corresponding coordinates of the points (Figure 7F). Therefore, in Euclidian distance/branch length, a straight segment is assigned the value ‘1’, and thus a lower value means higher tortuosity. The tortuosity of each vessel segment of selected vascular trees (between one branching point to another) was calculated. Distribution plots of the tortuosity and the vessel branch segment length revealed that tortuosity values are distributed from 0.5 to near 1 with a peak at around 0.8 in all the time points (Figure 7G and Supplemental Figure). Reflecting the higher total branch number per vascular tree, however, the number of tortuous vessels (less than 0.8) was significantly higher at day 7 compared to day 14 and day 21 (Figure 7G). In long segmented branches (0.25–1 mm length), we found a shift of the distributions of branch tortuosity toward less tortuous from day 7 to day 14 (Figure 7G and Supplemental Figure).
Finally, to demonstrate a use of this technique in an example of pathology, we examined skin excisional wounds in DIO mice. In these mice, even though the number of samples was limited (n=3 mice), we successfully visualized reduced vascular formation in three-dimensional reconstruction from our microCT angiography (Figure 8).
Figure 8.
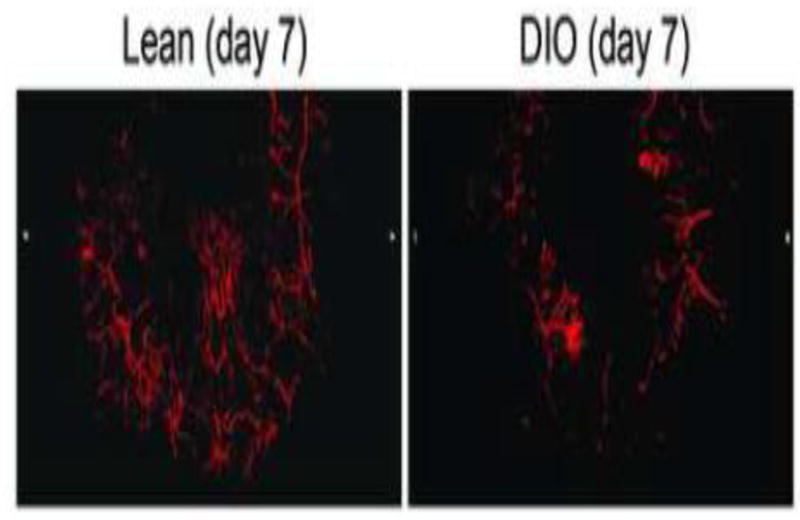
Representative 3D reconstruction of skin vascular structures by microCT angiography on day 7 after wounding in lean mice (left) and diet-induced obesity (DIO) mice (n=3).
Discussion
We developed a novel microCT angiography protocol to assess the 3D structure of the vasculature of healing wounds in mice. To this end, we optimized wound perfusion methods, microCT scanning settings and image post-processing. Using computers ordinarily available in a typical laboratory setting, we performed post-processing of scanned images, which is required for 3D reconstruction and subsequent analysis. We used the combination of a DICOM viewer, OsiriX, and an open-source image processing software, Fiji (ImageJ), to generate quantitative parameters from 3D analysis of the entire wound vasculature and the manually segmented branches, both of which can be used to characterize alteration of vessel structures during mouse skin wound healing.
The microCT angiography technique relies on the perfusion of radiopaque contrast agent to visualize the wound vasculature. We used the bismuth-gelatin contrast media, which has been used for detecting arteriogenesis (14) and is less viscous than another widely used contrast media, Microfil, which requires higher pressure and longer working time to fill the vessels, often resulting in the filling of both arteries and veins (unpublished observation by N.U.). Of note, increasing or decreasing the working time and viscosity, as per the manufacturer’s instructions, can modify total perfusion mass of these contrast media. In this study, the vessel networks filled with the contrast media are perfused with near physiological blood pressure due to the low viscosity of the bismuth-gelatin contrast media. Therefore, our method may reflect the more functionally relevant subset of vessels that contribute to actual perfusion during wound healing.
Our 3D analyses of the entire wound vessel structure (Figure 4) as well as that of segmented branches (Figure 5) demonstrate robust wound vessel formation in the proliferative phase (day 7 post-wounding) and regression of wound vessels over time to day 21. Quantitative analysis of microCT angiographic images allowed measurement of specific parameters such as vessel volume, vessel length, branching orders and vessel tortuosity, all of which help to characterize vascular architecture. We also demonstrated the usefulness of this technique to study wound vasculature in a pathological condition using DIO mice. Future studies will focus on the relationship between vascular parameters assessed by 3D microCT analysis and conditions of impaired healing, such as diabetes.
Our analysis of the tortuosity of vessels shows that the distributions of vessel tortuosity are not significantly changed from day 7 to day 14, although the number of vessels and branching are decreased over the time course regardless of tortuosity (Figure 5). Tortuosity has been shown to increase during tumor angiogenesis (19) and high tortuosity of vessels is correlated with tumor malignancies (20). We could only observe a downward shift of tortuosity from at day 7 to at day 14 when we analyzed only longer branch segments (0.25–1 mm length) (Supplemental Figure). A previous study showed that many of the small vessels in the proliferative phase of wound healing are poorly perfused, as judged by labeling with endothelial cell-specific antibodies systemically administered by IV injection (10). This observation was also confirmed by laser speckle imaging, which also detects only well perfused vessels (21). Given that our angiography visualizes perfused and patent microvascular architectures, smaller vessel segments with poor function were likely excluded in our tortuosity analysis. Using histological methods, we further confirmed that our perfusion filled arterioles as small as 7.3±3.4 SD μm in diameters (Figure 6). Reduced branching number and branching order may reflect the pruning of blood vessels, which has been recently discussed as being critical for the effective perfusion of blood into tissues (22). Overall, our results strongly suggest that reduced branching is more evident than changes in tortuosity during remodeling of vessels in the normally healed wound. However, it is possible that tortuosity could be a useful parameter in pathologic conditions of poor wound healing such as diabetes.
Other imaging modalities such as magnetic resonance angiography (23, 24), laser speckle imaging (21), intravital microscopy (25), and in vivo microCT angiography (13) have been used to visualize microvascular architecture. The advantage of the ex vivo microCT used in the current study is superior spatial resolution (technically as low as 0.5 μm voxel resolution to date) when compared with magnetic resonance imaging, laser speckle imaging and in vivo microCT scan. Ex vivo microCT images provide both small field microscopic and large field macroscopic data, which will aid in minimizing the sampling bias that is often an issue in small field microscopic observation. However, technical constraints did limit our sampling. To obtain an image series from entire mouse skin wounds within a reasonable amount of time and with limited data size, we scanned with a 2.5 μm voxel resolution. Another limitation was computing power for image processing. Processing 21 GB of data is not an easy task for computers that are widely accessible in typical biomedical laboratories. To reduce file size for 3D analysis of high-resolution images, we performed segmentation of specified vessel trees by ROI selection. This step was extremely time-consuming. More powerful computing and advanced analysis algorithms will enhance the potential of high-resolution microCT angiography in the near future.
In summary, we established a method of microCT angiography in mouse excisional skin wounds, which we used to characterize wound vessel structures over the time course of healing. Our results demonstrate robust angiogenesis and subsequent vessel regression in wound vessels, which could be observed in quantitative analysis of reconstructed structures. MicroCT angiography could be a useful technique to study the role of vessel formation, maturation and regression during normal wound healing as well as assessing the dysregulation of vessel formation and remodeling in impaired healing such as in the context of diabetes.
Supplementary Material
Highlights.
We have developed high-resolution ex vivo X-ray micro-computed tomography (microCT) for a mouse skin wound model.
Three-dimensional imaging and analysis of functional vasculature revealed dynamic alterations of vessel structures in wound tissue.
Multiple parameters from three-dimensional analysis characterize vessel formation, regression and remodeling during wound healing.
Our microCT angiography visualizes vascular structures consisting of arterioles, but not capillaries nor large veins.
Acknowledgments
We thank Ryan Ross, Meghan Moran, Rachna Parwani and Rick Sumner at the MicroCT Core of the Rush University for their help with CT scanning, data transfer, and technical consultation. We also thank Rita Mirza for technical assistance. Work in the author’s laboratory is supported by grants from the American Heart Association (12SDG12060100 to N.U.) and the National Institutes of Health (NIH) (R01GM092850 to T.J.K.,5R01GM050875 to L.A.D., and R21 HL119975 to Z.W.Z.).
Footnotes
Author Contributions
Experiments were designed by N.U., T.J.K., and L.A.D. Skin wounding, contrast media perfusion, sample collection and microCT scanning was performed by N.U. Three-dimensional reconstruction and quantitative analysis was performed by U.A.O. with assistance from N.U. M.M.F. performed the histological analysis. Z.W.Z. made bismuth nanoparticles and prepared bismuth-based contrast agent. N.U., U.A.O., M.M.F., T.J.K. and L.A.D. wrote the paper.
Publisher's Disclaimer: This is a PDF file of an unedited manuscript that has been accepted for publication. As a service to our customers we are providing this early version of the manuscript. The manuscript will undergo copyediting, typesetting, and review of the resulting proof before it is published in its final citable form. Please note that during the production process errors may be discovered which could affect the content, and all legal disclaimers that apply to the journal pertain.
References
- 1.Guo S, Dipietro LA. Factors affecting wound healing. J Dent Res. 2010;89(3):219–29. doi: 10.1177/0022034509359125. [DOI] [PMC free article] [PubMed] [Google Scholar]
- 2.Brem H, Tomic-Canic M. Cellular and molecular basis of wound healing in diabetes. The Journal of clinical investigation. 2007;117(5):1219–22. doi: 10.1172/JCI32169. [DOI] [PMC free article] [PubMed] [Google Scholar]
- 3.DiPietro LA. Angiogenesis and scar formation in healing wounds. Current opinion in rheumatology. 2013;25(1):87–91. doi: 10.1097/BOR.0b013e32835b13b6. [DOI] [PubMed] [Google Scholar]
- 4.Carmeliet P, Jain RK. Molecular mechanisms and clinical applications of angiogenesis. Nature. 2011;473(7347):298–307. doi: 10.1038/nature10144. [DOI] [PMC free article] [PubMed] [Google Scholar]
- 5.Heil M, Eitenmuller I, Schmitz-Rixen T, Schaper W. Arteriogenesis versus angiogenesis: similarities and differences. J Cell Mol Med. 2006;10(1):45–55. doi: 10.1111/j.1582-4934.2006.tb00290.x. [DOI] [PMC free article] [PubMed] [Google Scholar]
- 6.Korn C, Augustin HG. Mechanisms of Vessel Pruning and Regression. Developmental cell. 2015;34(1):5–17. doi: 10.1016/j.devcel.2015.06.004. [DOI] [PubMed] [Google Scholar]
- 7.Wiedeman MP. Dimensions of blood vessels from distributing artery to collecting vein. Circulation research. 1963;12:375–8. doi: 10.1161/01.res.12.4.375. [DOI] [PubMed] [Google Scholar]
- 8.Bearden SE, Payne GW, Chisty A, Segal SS. Arteriolar network architecture and vasomotor function with ageing in mouse gluteus maximus muscle. J Physiol. 2004;561(Pt 2):535–45. doi: 10.1113/jphysiol.2004.068262. [DOI] [PMC free article] [PubMed] [Google Scholar]
- 9.Swift ME, Kleinman HK, DiPietro LA. Impaired wound repair and delayed angiogenesis in aged mice. Laboratory investigation; a journal of technical methods and pathology. 1999;79(12):1479–87. [PubMed] [Google Scholar]
- 10.Bluff JE, O’Ceallaigh S, O’Kane S, Ferguson MW, Ireland G. The microcirculation in acute murine cutaneous incisional wounds shows a spatial and temporal variation in the functionality of vessels. Wound Repair Regen. 2006;14(4):434–42. doi: 10.1111/j.1743-6109.2006.00142.x. [DOI] [PubMed] [Google Scholar]
- 11.Wietecha MS, Cerny WL, DiPietro LA. Mechanisms of vessel regression: toward an understanding of the resolution of angiogenesis. Curr Top Microbiol Immunol. 2013;367:3–32. doi: 10.1007/82_2012_287. [DOI] [PubMed] [Google Scholar]
- 12.Ehling J, Theek B, Gremse F, Baetke S, Mockel D, Maynard J, Ricketts SA, Grull H, Neeman M, Knuechel R, Lederle W, Kiessling F, Lammers T. Micro-CT Imaging of Tumor Angiogenesis: Quantitative Measures Describing Micromorphology and Vascularization. The American journal of pathology. 2013 doi: 10.1016/j.ajpath.2013.10.014. [DOI] [PMC free article] [PubMed] [Google Scholar]
- 13.Lee S, Barbe MF, Scalia R, Goldfinger LE. Three-Dimensional Reconstruction of Neovasculature in Solid Tumors and Basement Membrane Matrix Using Ex Vivo X-ray Microcomputed Tomography. Microcirculation. 2014;21(2):159–70. doi: 10.1111/micc.12102. [DOI] [PMC free article] [PubMed] [Google Scholar]
- 14.Tirziu D, Moodie KL, Zhuang ZW, Singer K, Helisch A, Dunn JF, Li W, Singh J, Simons M. Delayed arteriogenesis in hypercholesterolemic mice. Circulation. 2005;112(16):2501–9. doi: 10.1161/CIRCULATIONAHA.105.542829. [DOI] [PubMed] [Google Scholar]
- 15.Schindelin J, Arganda-Carreras I, Frise E, Kaynig V, Longair M, Pietzsch T, Preibisch S, Rueden C, Saalfeld S, Schmid B, Tinevez JY, White DJ, Hartenstein V, Eliceiri K, Tomancak P, Cardona A. Fiji: an open-source platform for biological-image analysis. Nature methods. 2012;9(7):676–82. doi: 10.1038/nmeth.2019. [DOI] [PMC free article] [PubMed] [Google Scholar]
- 16.Mirza RE, Fang MM, Novak ML, Urao N, Sui A, Ennis WJ, Koh TJ. Macrophage PPARgamma and impaired wound healing in type 2 diabetes. J Pathol. 2015 doi: 10.1002/path.4548. [DOI] [PMC free article] [PubMed] [Google Scholar]
- 17.Mirza RE, Fang MM, Ennis WJ, Koh TJ. Blocking interleukin-1beta induces a healing-associated wound macrophage phenotype and improves healing in type 2 diabetes. Diabetes. 2013;62(7):2579–87. doi: 10.2337/db12-1450. [DOI] [PMC free article] [PubMed] [Google Scholar]
- 18.Arganda-Carreras I, Fernandez-Gonzalez R, Munoz-Barrutia A, Ortiz-De-Solorzano C. 3D reconstruction of histological sections: Application to mammary gland tissue. Microsc Res Tech. 2010;73(11):1019–29. doi: 10.1002/jemt.20829. [DOI] [PubMed] [Google Scholar]
- 19.Dewhirst MW, Richardson R, Cardenas-Navia I, Cao Y. The relationship between the tumor physiologic microenvironment and angiogenesis. Hematol Oncol Clin North Am. 2004;18(5):973–90. vii. doi: 10.1016/j.hoc.2004.06.006. [DOI] [PubMed] [Google Scholar]
- 20.Bullitt E, Zeng D, Gerig G, Aylward S, Joshi S, Smith JK, Lin W, Ewend MG. Vessel tortuosity and brain tumor malignancy: a blinded study. Acad Radiol. 2005;12(10):1232–40. doi: 10.1016/j.acra.2005.05.027. [DOI] [PMC free article] [PubMed] [Google Scholar]
- 21.Rege A, Thakor NV, Rhie K, Pathak AP. In vivo laser speckle imaging reveals microvascular remodeling and hemodynamic changes during wound healing angiogenesis. Angiogenesis. 2012;15(1):87–98. doi: 10.1007/s10456-011-9245-x. [DOI] [PMC free article] [PubMed] [Google Scholar]
- 22.Ricard N, Simons M. When it is better to regress: dynamics of vascular pruning. PLoS Biol. 2015;13(5):e1002148. doi: 10.1371/journal.pbio.1002148. [DOI] [PMC free article] [PubMed] [Google Scholar]
- 23.Kim E, Zhang J, Hong K, Benoit NE, Pathak AP. Vascular phenotyping of brain tumors using magnetic resonance microscopy (muMRI) Journal of cerebral blood flow and metabolism: official journal of the International Society of Cerebral Blood Flow and Metabolism. 2011;31(7):1623–36. doi: 10.1038/jcbfm.2011.17. [DOI] [PMC free article] [PubMed] [Google Scholar]
- 24.Radbruch A, Eidel O, Wiestler B, Paech D, Burth S, Kickingereder P, Nowosielski M, Baumer P, Wick W, Schlemmer HP, Bendszus M, Ladd M, Nagel AM, Heiland S. Quantification of tumor vessels in glioblastoma patients using time-of-flight angiography at 7 Tesla: a feasibility study. PloS one. 2014;9(11):e110727. doi: 10.1371/journal.pone.0110727. [DOI] [PMC free article] [PubMed] [Google Scholar]
- 25.Fukumura D, Jain RK. Imaging angiogenesis and the microenvironment. APMIS. 2008;116(7–8):695–715. doi: 10.1111/j.1600-0463.2008.01148.x. [DOI] [PMC free article] [PubMed] [Google Scholar]
Associated Data
This section collects any data citations, data availability statements, or supplementary materials included in this article.


